Microstructural Analysis of NdFeB Ternary Alloy for Magnets Fabricated Using
a Strip-Casting Method
*1Kazuhiko Yamamoto
1,*2and Ryo Murakami
21Santoku Corporation, Kobe 658–0013, Japan
2Nissan Motors Corporation, Yokosuka 237–8523, Japan
The microstructural evolution of a NdFeB starting alloy fabricated by a strip-casting method was investigated as a function of the surface roughness, surface velocity, and thermal conductivity of the cooling roll of the strip caster. The nucleation of the solid phase took place prefer-entially at the edges of grooves machined on the roll and the grain size was inversely proportional to the frequency of nucleation. A higher surface velocity produced thinner strip-cast samples. The growth rate of the solid phase weakly influenced the dendrite sizes compared with the case of a thin plate obtained using mold-casting. Cooling rolls with higher thermal conductivity resulted in alloys with smaller grain and dendrite sizes. [doi:10.2320/matertrans.MG201624]
(Received April 22, 2016; Accepted May 18, 2016; Published June 17, 2016)
Keywords: strip-casting, magnet, microstructure, cooling rate, neodymium, surface roughness, surface velocity, thermal conductivity, nucle-ation, dendrite
1. Introduction
In the early 1980s, Sagawa et al. developed a new sintered NdFeB magnets.1,2) In the same year Croat et al. developed
equi-axis NdFeB magnet powders.3,4) Sintered NdFeB
mag-nets are widely used in voice coil motors and their application has increased with the expanding market for hard disk drives in personal computers (PCs). The use of equi-axis NdFeB magnet powders is also increasing for the ring-shaped bonded magnets used in spindle motors of PCs. Recently, sintered NdFeB magnets have also been used for home electric appli-ances, electric vehicles, hybrid electric vehicles, and elec-tronic power steering systems. These days, NdFeB magnets are an important component of many technologies that facili-tate a more sustainable society.
In the early days of producing sintered NdFeB magnets, the starting alloy was prepared using the mold casting meth-od. The solidification process of the Nd-Fe-B ternary alloy system occurs over a wide range of temperatures. The prima-ry γ-Fe crystal was precipitates at approximately 1200 C, Nd2Fe14B phases form by the peritectic reaction at
tempera-tures lower than approximately 1100 C, and the solidification finishes at approximately 650 C.5) Therefore the starting
al-loy using mold cast method generally includes primary α-Fe crystals with segregation of the rare-earth elements.
Generally, starting alloys for sintered magnets are crushed and pulverized into powders with an average particle size around 3 μm and pressed while exposed to a magnetic field to align the c-axis of the particles.1) After forming, the compact
is sintered to achieve a dense alloy. Starting alloys require three important characteristics in order to produce magnets with appropriate properties after sintering: 1) No remaining primary α-Fe crystals, 2) the pulverized powders are mo-no-crystalline, and 3) the R-rich phase (as the grain boundary phase) is finely and uniformly dispersed. Hirose et al. and
Sugimoto et al. reported microstructural characteristics and improvements in the previously mentioned properties of Nd-Fe-B alloys fabricated using strip-casting (SC) methods.6,7)
However, to the best of our knowledge, a thorough investiga-tion of the relainvestiga-tionship between SC condiinvestiga-tions and the result-ing microstructures of the fabricated alloys has not been pub-lished. Therefore the objective of this study is to clarify the microstructural evolution of a Nd-Fe-B starting alloy pre-pared using the SC method.
2. Experimental
2.1 Strip casting
In this study, Nd14.65Febal.B6.11 (atomic %) was selected as
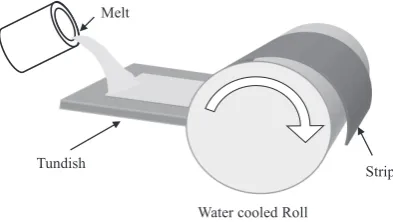
the desired alloy composition. A Crucible containing 3 kg raw materials of Nd metal (Nd/(total rare-earth) = 99.9 mass%), Fe-21.3 mass%B alloy, and 99.9 mass% pure-iron was placed in a furnace chamber and the air evacuated down to a pressure of 2 Pa. Then, Ar was introduced into chamber and the alloy melt was prepared by induction heat-ing up to 1550 C. The samples were then cast by the SC method illustrated in Fig. 1. The melt was poured onto the tundish at 1450 C and guided through a 150 mm diameter Cu cooling roll cooled by a flow of water.
To investigate the effect of the surface roughness of the cooling roll on the microstructure of SC samples, two
differ-*1
This Paper was Originally Published in Japanese in J. Japan Inst. Met. Mater. 80 (2016) 1–6.
*2
[image:1.595.329.526.662.773.2]ent copper rolls (N1 and N2) were prepared. The surfaces of both rolls were finished using P150 emery paper. In addition, grooves with a depth of 80 μm were machined at 500 μm in-tervals on the surface of the N2 roll. The roughness values of the roll surfaces were measured using a contact probe profilo-meter.
In order to clarify the relationship between dendrite size (d) and growth rate (R), SC samples were prepared using dif-ferent roll surface velocities Vs = 0.23, 0.46, 1.00, and 2.00 m/s. The pouring rate of the melt was controlled to keep the height of the puddle between the melt and the roll con-stant at 10 mm.
In order to investigate the influence of thermal conductivity of the cooling roll on the microstructure, SC samples were prepared using three different rolls (T1, T2, and T3), as shown in Table 1. The roll surfaces were polished using P150 emery papers (as for the N1 roll) and a surface velocity of 1 m/s was used during casting.
2.2 Microstructural analysis
The microstructures of the chilled surface in contact with the cooling roll, and the cross-sections of SC samples were observed using optical microscopy. The chilled surfaces were used to analyze the nucleation sites within the grain structure. Dendrites in the sub-grains were observed after the surface was etched with an aqueous solution of 3 mass% HNO3. The
internal grain structures were observed from the cross-sec-tioned samples.
2.3 Grain size calculations
The size of the grains and dendrites were determined using the relationship (L/N) where (L is the length of a line drawn perpendicular to the solidification direction and 200 μm from the chilled surface, and N is the number of grains intersected by this line. An average value was calculated from 10 differ-ent optical microscopy images of the same sample.
3. Results and Discussion
Various strip-casting operation conditions influencing the microstructure were investigated, including the surface roughness, velocity, and thermal conductivity of the cooling roll. These factors are discussed in this section in detail.
3.1 Cooling roll roughness
Figure 2 (a) and (b) show the roughness amplitudes of the surfaces of the N1 and N2 rolls measured using the surface roughness meter. The surface of the N1 roll showed a random roughness of around ±5 μm (Fig. 2 (a)), while the wedge-shaped grooves machined on the surface of N2 roll are visible
in Fig. 2 (b).
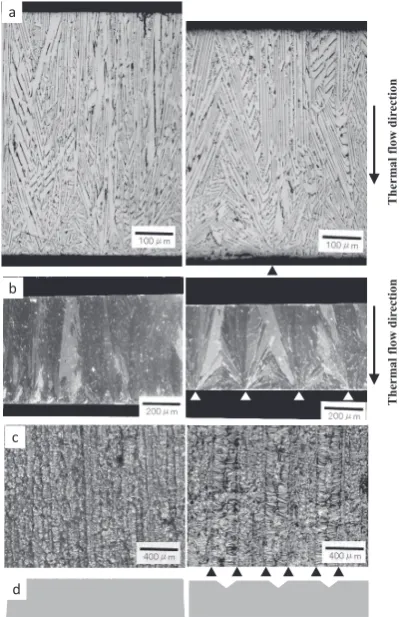
Figure 3 shows the microstructure of SC samples prepared using N1 (left row) and N2 (right row). Figure 3 (a), (b), (c), and (d) show the dendrite structures as sub-grains, the grain structures, microstructures of the chilled surface in contact with the cooling roll, and schematic images of the roll sur-face, respectively. In images (a) and (b) the thermal flow di-rection was downwards (as indicated by the arrows on the images). Figure 3 (b) shows many small grains grown from nucleation sites resulting from contact with the N1 roll (left row), and large grains grown from the contact with the edges of the machined grooves on the N2 roll surface (right row). Figure 3 (a) shows that the sub-grain dendrite structures have
Fig. 2 Surface roughness of copper rolls (a) N1 and (b) N2.
[image:2.595.330.525.74.192.2] [image:2.595.48.293.96.159.2] [image:2.595.327.527.238.547.2]a similar morphology to the grains. Figure 3 (c) shows that the nucleation sites produced by the N1 roll approximately follow the roughness features, forming morphologies linearly arranged in the rolling direction. In contrast, the nucleation sites from the N2 roll are aligned along the edges of the ma-chining grooves (indicated by the black triangles in the fig-ure). In addition, it seems that the frequency of nucleation sites was low between the grooves (the flat area of the trape-zoid) and in the area where there was not good contact be-tween the sample and roll. Hence, we conclude that the nucle-ation process occurred easily at the edges of the machining grooves. In a similar study, Biloni and Chalmers reported in 1965 that the micro-profile of the mold surface could affect the heterogeneous nucleation process for Al-Cu and Sn-Pb alloy.8) Prates and Biloni also studied the relationship
be-tween the chill zone microstructure and the surface micro-ge-ometry of the mold and discussed the nucleation generated from a convex area of the mold for a Al-Cu alloy in 1972.9)
Here, we observed similar nucleation behavior for the NdFeB alloy.
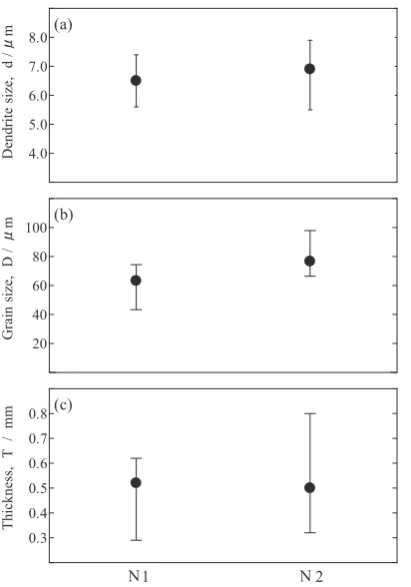
Figure 4 (a), (b), and (c) shows the mean dendrite sizes, mean grain sizes, and thicknesses of SC samples, respective-ly, obtained using the N1 and N2 rolls. It can be seen from Fig. 4 (b) that the mean grain size of SC samples produced using N2 was larger than that of N1. From Fig. 3 (c) and (d), it can be seen that the frequency of nucleation obtained using N1 was higher than that for N2. Esaka et al. reported in 2003 that the grain sizes of an Al-Cu alloy decreased with increas-ing nucleation frequency for dipped chilled plate samples.10)
These result imply that the number of nucleation sites gener-ated from contact with the roll was less for N2 than for N1,
and the grain size is smaller for N1 than N2 due to grain growth occurring from these nucleation sites. There were no significant differences between the mean dendrite size (d) and thickness (T) of SC samples obtained using the N1 and N2 rolls (Fig. 4 (a) and (b), respectively).
3.2 Dendrite size and growth rate
Figure 5 shows the relationship between the surface veloc-ity and thickness of SC samples, where it can be seen that the samples prepared with higher Vs (i.e., lower contact time with the roll) were thinner. Figure 6 shows the dendrite size as a function of the distance (l) from the surface in contact with the roll for the various surface velocities. It can be seen that the dendrite size increased with increasing distance and de-creased with increasing Vs.
Figure 7 shows a schematic model of the solidification pro-cess during strip-casting. The puddle height between the melt on the tundish and the cooling roll was set to 10 mm. The Fig. 4 (a) dendrite size, (b) grain size, and (c) thickness of strip-cast
sam-ples obtained using the N1 or N2 roll.
Fig. 5 Relationship between roll surface velocity and thickness of strip-cast samples.
Fig. 6 Relationship between the distance from the cooled surface in contact with the roll and the dendrite size.
[image:3.595.324.527.69.198.2] [image:3.595.67.273.70.364.2] [image:3.595.323.524.250.389.2] [image:3.595.342.511.446.512.2]solidification of SC samples started at X0 and the thin strips
were separated from the puddle at X1. From this model, it was
considered that the thickness of SC samples could be estimat-ed as a function of the solidification time (t) definestimat-ed as the puddle height divided by the surface velocity. Table 2 shows the values of Vs, T, and t. The speed of the solidification phase was assumed equal to Vs. Figure 8 (a) depicts the solidifica-tion time as a funcsolidifica-tion of the thickness where this relasolidifica-tionship can be approximated by the following equation.
T =0.1492×ln(t)+0.9992 (1)
From eq. (1), the growth rate (μm/s) of the solidification phase can be expressed as follows:
R=dT/dt=0.1492/t (2)
Figure 8 (b) shows the relationship between T determined from eq. (1) and R of the solidification phase calculated using eq. (2), where we can express the growth rate as a function of the thickness:
R=196.81×T2−223.26×T+66.521 (3)
In previous studies,5–8) the dendrite size was described as:
d=c/(Ga×Rb) (4)
where G is the temperature gradient, and a, b, and c are con-stants.
In the case of the strip-casting method, the temperature gradient can be assumed constant because of the thin solidifi-cation phase moving in the molten puddle with a much larger volume. Hence, we can express the dendrite size as follows:
d≈A×R−b (5)
where A and b are constants.
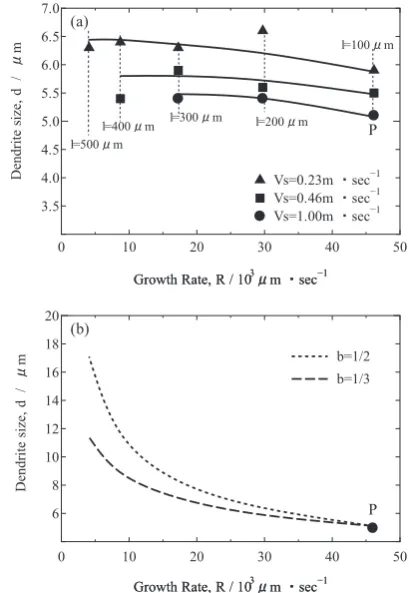
Figure 9 (a) shows the relationship between R calculated using eq. (2) and experimentally measured d values at steps of 100 μm from the surface in contact with the cooling roll. Figure 9 (b) shows the dendrite size as a function of R calcu-lated using eq. (5) assuming b = 1/2 or 1/3 passing through P (shown in Fig. 9 (a), Vs = 1 m/s and l = 100 μm)
The experimental dendrite sizes shown in Fig. 9 (a) did not correlate well with the values calculated using eq. (5). This could be because our growth rate (0.5 − 5 × 104μm/s) was
faster than in the previous studies (about 10 − 102μm/s)11–14),
and the concentration of the solution, especially that of Nd, near the solid/liquid interface being diminished due to the solidification phase moving in the puddle.
3.3 Influence of thermal conductivity on the microstruc-ture
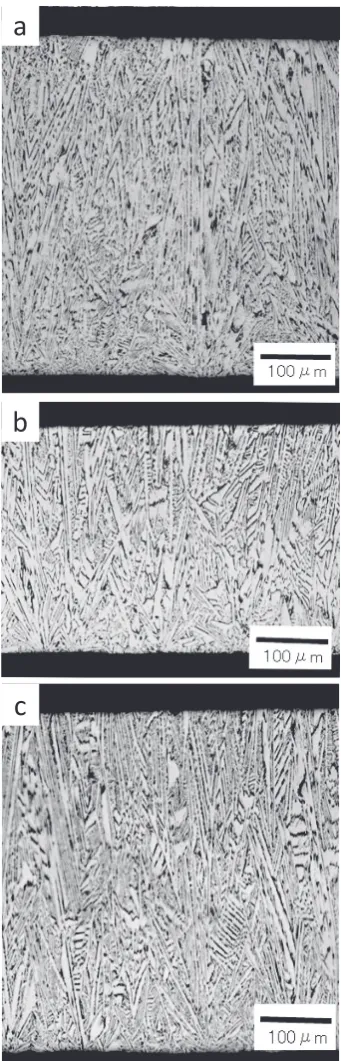
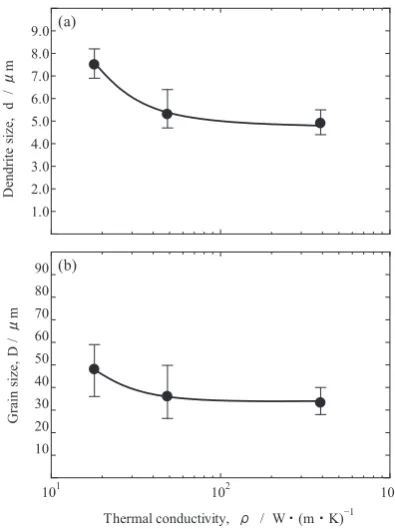
Figure 10 shows optical microscopy images of the dendrite Fig. 8 Relationship between (a) assumed solidification time and the
thick-ness of the strip-cast samples, and (b) thickthick-ness of strip cast samples and the growth rate.
[image:4.595.322.527.70.367.2] [image:4.595.61.276.97.494.2]sub-structures, and Fig. 11 shows polarized microscopy im-ages of the grain structures of SC samples obtained using the T1, T2, and T3 rolls. Figures 12 (a) and (b) show the dendrite size and the grain size of SC samples as functions of thermal conductivity (ρ). Both the dendrite and grain sizes became finer with increasing thermal conductivity of the roll. These fine grains were observed near the surface that was in contact with the cooling roll. The flow of thermal energy from the solidification shell to the cooling roll was assumed to be larg-er for cooling rolls with highlarg-er thlarg-ermal conductivity values. A higher thermal conductivity of the roll increased the cooling
rate (i.e., solidification rate), and as a result, the dendrite and grain sizes were finer. Mizuno et al. investigated the influence of the thermal conductivity of the chill block on the cooling rate for the case of a dipping test for steel (S45C) in 2008.18)
The chill blocks with three different thermal conductivities (SUS304, carbon steel, and copper) were dipped into the mol-ten steel. The grain sizes of solidified steel became finer with increasing thermal conductivity, as observed in our study.
4. Conclusion
[image:5.595.326.526.68.576.2]The influence of the surface roughness, surface velocity, and thermal conductivity of the cooling roll on the micro-structure of Nd14.65Febal.B6.11 samples prepared using
Fig. 11 Grain structure of samples obtained using rolls (a) T1, (b) T2, and (c) T3.
[image:5.595.83.254.69.601.2]strip-casting was investigated.
The nucleation of the grains occurred at the convex points of the cooling roll surface. The grain size decreased with in-creasing thermal conductivity of the cooling roll. The den-drite size was not significantly influenced by the growth rate during solidification because of the reduced the concentration of the solution, especially that of Nd, near the solid/liquid interface being diminished due to the solidification phase
1431617 (Filed: Aug. 21, 1982).
2) M. Sagawa, S. Fujimura, N. Togawa, H. Yamamoto and Y. Matsuura: J. Appl. Phys. 55 (1984) 2083–2087.
3) J. J. Croat, General Motors Corporation: US Patent No. 4851058 (Filed: Sep. 3, 1982).
4) J.J. Croat, J.F. Herbst, R.W. Lee and F.E. Pinkerton: J. Appl. Phys. 55 (1984) 2078–2082.
5) M. Sagawa, S. Hirosawa, H. Yamamoto, S. Fujimura and Y. Matsuura: Jpn. J. Appl. Phys. 26 (1987) 785–800.
6) Y. Hirose, H. Hasegawa, S. Sasaki: Proceedings of the 15th conference on rare-earth magnets and their applications, Dresden, (1998) 77–86. 7) T. Hattori, N. Fukamachi, R. Goto, N. Tezuka and S. Sugimoto: Mater.
Trans. 50 (2009) 479–482.
8) H. Biloni and B. Chalmers: Trans. Metall. Soc. AIME 233 (1965) 373– 379.
9) M. Prates and H. Biloni: Metall. Trans. 3 (1972) 1501–1510. 10) H. Esaka, K. Shinozuka and M. Tamura: ISIJ Int. 43 (2003) 1751–1757. 11) W. Kurz and D.J. Fisher: Acta Metall. 29 (1981) 11–20.
12) R. Trivedi: Metall. Trans. A 15 (1984) 977–982.
13) S.Z. Lu and J.D. Hunt: Metall. Trans. A 27 (1996) 611–623.
14) E. Çadirli, I. Karaca, H. Kaya and N. Maraşli: J. Crys. Growth 255 (2003) 190–203.
15) M.L. Minges and G.K. White: Thermophysical Properties of Some Key Solids, An Update (1997) 1269–1327.
16) A Report from the Physics Division, the National Physical Laboratory, JISI 154 (1946) 83.
17) T.G. Kollie, D.L. McElroy, R.S. Graves and K.E. Gilchrist: Inter. J. Thermophys. (1991) 409–415.
[image:6.595.68.266.70.335.2]18) H. Mizuno, H. Ezaka, K. Shinozuka and M. Tamura: ISIJ Int. 48 (2008) 270–276.