Texture Evolution in AZ80 Magnesium Alloy by the Plane Strain
Compression Deformation at High Temperature
+1Jinuk Kim
+2, Kazuto Okayasu and Hiroshi Fukutomi
Department of Solid State Materials and Engineering, Graduate School of Yokohama National University, Yokohama 240-8501, Japan
The formation behavior of textures during high temperature plane strain compression deformation is experimentally studied on AZ80 magnesium alloy. Three kinds of specimens with different initial textures are prepared from the extruded bars having ah1010ifiber texture. Plane strain compression is conducted at 723 K, 5.0©10¹2s¹1 and strains ranging from ¹0.4 to ¹1.0. New grains appeared after the deformation up to¹0.4 in true strain. Initial texture gradually changes with increasing strain. After the deformation up to¹1.0 in true strain, (0001)h1010i,f1120gh1010i, (0001)h1120iandf1010gh0001iappeared depending on the initial texture. (0001)h1010iandf1120gh1010iare formed irrespective of the initial texture. Simple crystallographic examination showed that all the texture components are orientations stable for the plane strain compression. [doi:10.2320/matertrans.L-M2012828]
(Received May 1, 2012; Accepted August 31, 2012; Published October 17, 2012)
Keywords: high temperature, plane strain compression, texture, magnesium alloy
1. Introduction
The importance of weight reduction has been recognized in variousfields, and interest for magnesium alloys has been growing in recent years. However, the practical use of magnesium alloys in a wide range of fields has not been achieved yet due to the poor formability at room temperature. Deformability improves when active slip systems increase during high temperature deformation. Hence, magnesium alloys are usually deformed at high temperatures.1,2) The
texture which is formed by high temperature deformation affects not only the formability at room temperature but also the strength and other characteristics of polycrystals. There-fore, understanding the formation behavior of textures and the analysis of the formation mechanism during high temperature deformation of magnesium alloys are important subjects of academic interest, as well as for industrial application.
Two of the authors have been investigating the formation behavior of textures during high temperature deformation by uniaxial and plane strain compression of AlMg solid solution. It was found that the main component of the texture and the developmental process of the texture would change significantly depending on deformation conditions. The orientation dependence of stored energy becomes higher when the viscous motion of the dislocation is the dominant deformation mechanism, with grain boundary migration occurring extensively. As the result, it is considered that the sharp texture which is different from preferred orientation at room temperature deformation was formed.3)
The main alloy element in an AZ system magnesium alloy is aluminum. Between the AZ magnesium alloy and the Al Mg alloy, there is a solute and solvent element replacement relationship. It is possible for this solid solution AZ magnesium alloy to have the same dependence on the deformation condition, however, a systematic investigation
has never been found. In the study of the AlMg alloy, the characteristics of texture formation became clear with an increase in solute content.4) In this study, the AZ80 magnesium alloy which has a high solute aluminum concentration with three kinds of initial textures was experimentally investigated by plane strain compression under various deformation conditions.
2. Experimental Procedure
AZ80 magnesium alloy specimens with strong textures were prepared from a commercial extruded bar with a diameter of 15 mm. In order to elucidate the characteristics of texture formation by plane strain compression, three kinds of specimens with different textures were machined from the same extruded bar. Figure 1 shows thef1010gpolefigure of the AZ80 extruded bar after annealing. Pole densities are projected onto the plane normal to the extrusion direction. Mean pole density is used as a unit. It is seen that the pole density is distributed in a concentric circular manner. The area of high pole density appears in the center. This means that the widely reported5)f1010gfiber texture is formed.
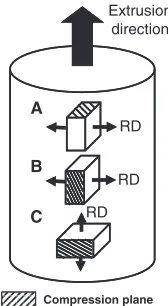
Three types of specimens with different preferred orienta-tions were machined. The size of the specimens is 6.7© 10©10 mm. Figure 2 shows the geometric characteristics of the samples. RD in the figure is the elongation direction for plane strain compression. The hatched area indicates the compression plane. The compression (normal) direction (ND) of specimen A, constraint (transverse) direction (TD) of specimen B and elongation (rolled) direction (RD) of specimen C are equal to the extrusion direction of the base material, respectively. All the specimens were annealed at 723 K for 1 h before the test. The average grain size after annealing was 60 µm using the geometric correction factor. The (0001) pole figures derived from the EBSD measure-ments are shown in Fig. 3. Pole densities are projected onto the compression plane. Since the base material is the same, the maximum pole densities of specimen A, B and C are almost the same at 7.9, 8.1 and 7.8, respectively. The position
+1This Paper was Originally Published in Japanese in J. JILM62(2012)
5459.
+2Graduate Student, Yokohama National University
of the maximum pole densities exist at the outer periphery of A, on the great circle 90° away from the TD of B and on the great circle 90° away from the RD of C.
Plane strain compression tests were conducted at a temperature of 723 K and a strain rate of 5.0©10¹2s¹1,
with a strain range of between ¹0.4 and ¹1.0. After a deformation of up to a certain strain, the furnace was immediately opened and, simultaneously, the power supply was switched off. Then, the specimens were quenched in oil, in order to prevent a change in the microstructure. For texture measurements, mid-plane sections of the deformed speci-mens were prepared by mechanical polishing. Texture measurements were conducted by the Schulz reflection method. For EBSD (Electron Back-Scattered Diffraction) measurements, the electrolytic polishing was performed on the mechanically polished sample.
Texture measurements were conducted using a nickel filtered copper K¡ radiation. Based on the{0001}, f1010g,
f1011g, f1012g and f1120g pole figures and on these five polefigures, the orientation distribution function (ODF) was calculated by the DahmsBunge method.6) Textures were
examined on the basis of the polefigures and the inverse pole figures were calculated from the ODF.
Local crystal orientations were measured by the EBSD system equipped on the JEOL JSM-5600 scanning micro-scope. The minimum rotation angle between neighboring points of measurement was calculated by the commercial program (OIM Analysis) developed by TexSEM Laborato-ries, Inc. When the neighboring point is larger than 15°, it is defined as a high angle grain boundary (HAGB). The region of 1.8 mm©5.4 mm was scanned using the beam control option with a scan step of 6 µm. Figures on the position and the shape of grains were drawn based on the orientation measurement. Thesefigures are expressed as“grain structure maps”in the present paper.
3. Results
3.1 True stresstrue strain curves
Figure 4 shows the true stresstrue strain curves for the three types of specimens. The true strain of the figure is shown as an absolute value. Immediately after the deforma-tion, the maximum value of theflow stress (work softening) is observed in all the cases. The work softening immediately after the deformation was also observed in the case of Al Mg7) and AZ318) during high temperature deformation.
A
B
C
RD
RD
RD Extrusion
direction
Compression plane
Fig. 2 Geometry of the specimens for plane strain compression.
Specimen A
Maximum pole density: 7.9
Specimen B
Maximum pole density: 8.1
Specimen C
Maximum pole density: 7.8
4
2
1 2 1
4
4 8
2
1 4
4 Levels:1, 2, 4, 8
(a)
(b)
(c)
Fig. 3 (0001) Polefigures showing the crystallographic characteristics of the specimens. (a), (b) and (c) show the specimens of A, B and C, respectively. Pole densities are projected onto the compression plane. Mean pole density is used as a unit.
Maximum pole density: 13
[image:2.595.63.276.67.241.2] [image:2.595.384.468.70.223.2] [image:2.595.128.470.301.462.2]Specimen A which formed thef1010gtexture before the test, shows the highest peak stress of the three kinds of specimens. 3.2 Textures
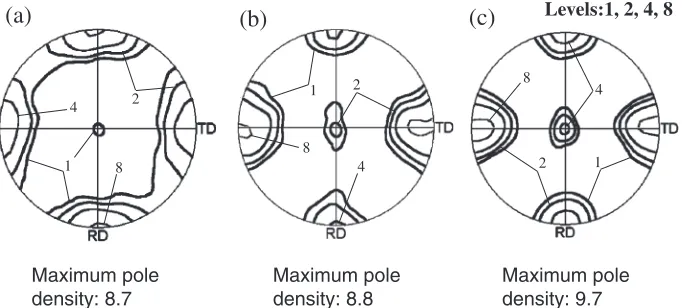
[image:3.595.64.278.70.228.2]3.2.1 Formation process of texture in specimen A Figure 5 shows the (0001) pole figures for specimen A derived from EBSD measurements up to a strain of (a)¹0.4, (b) ¹0.7 and (c) ¹1.0. In all cases, pole densities are projected onto the compression plane. Before the deformation shown in Fig. 3(a), the (0001) pole densities are distributed 360° uniformly at the periphery of the pole figure. After the deformation up to a strain of ¹0.4, the accumulation of the pole density is changed at the center, left, right, top and bottom, as shown in Fig. 5(a). If there is no distinction between the left and right, and top and bottom pole densities, respectively, the number of pole densities are said to be three. This characteristic becomes clearer as the strain increases to ¹0.7 and ¹1.0.
A texture measurement using X-ray was conducted at a strain of ¹0.4 because the number of crystal grains is not enough for the EBSD measurement. Figure 6(a) shows the (0001) polefigure for the specimen and Fig. 6(b) shows the inverse pole figure showing the density distribution of the compression axis on the same specimen. Figure 6(a) shows a pole density distribution similar to that of Fig. 5(a). In addition, the accumulation of axial densities is shown at
h0001iand h1010iin Fig. 6(b).
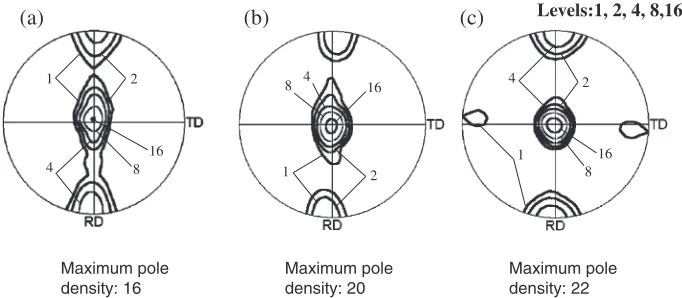
3.2.2 Formation process of texture in specimen B Figure 7 shows the (0001) pole figures for specimen B up to a strain of (a)¹0.4, (b)¹0.7 and (c)¹1.0. Before the deformation shown in Fig. 3(b), the (0001) poles distribute on the great circle 90° away from the TD. Unlike specimen A, the (0001) pole distribution does not exist near the TD when the true strain is ¹0.4. However, when the true strain is¹1.0, the (0001) pole distribution accumulates near the TD. The results show that the (0001) polefigure is similar to that of specimen A. When the strain is ¹1.0, the accumulation of the pole density at the center is about 10 in the case of specimen A. Specimen B has a high pole density which is over 22.
3.2.3 Formation process of texture in specimen C Figure 8 shows the (0001) pole figures for specimen C up to a strain of ¹0.4, ¹0.7 and ¹1.0. Specimen C has a geometric relationship of 90° rotation around the compres-sion axis of specimen B.
As shown in Fig. 3(c), the pole density continuously distributes at twice the average level as the rotation axis at the RD axis before deformation. When the strain is ¹0.4, the pole density at the intermediate region between TD and the center of the (0001) pole figure decreases as shown in Fig. 8(a). This trend is remarkable at ¹0.7 true strain. The accumulation of the pole density at the right, left and center of the (0001) polefigure is confirmed at¹1.0 true strain. The accumulation area of the pole density is two, if it is deemed
0 0.2 0.4 0.6 0.8 1
0 10 20 30 40 50
T
rue stress,
σ/ MPa
True strain, ε
T=723K
ε=5.0 x 10 -2s-1 Extruded AZ80
Plane strain compression
Specimen A Specimen B Specimen C
Fig. 4 True stresstrue strain curves for the specimens of A, B and C.
Levels:1, 2, 4, 8
1
2 4
8
1 2
4 8
4 8
1 2
(a)
(b)
(c)
Maximum pole density: 8.7
Maximum pole density: 8.8
Maximum pole density: 9.7
Fig. 5 (0001) Polefigures showing the effect of strain on the texture development of the specimen A. True strains of (a), (b) and (C) are
¹0.4,¹0.7 and¹1.0, respectively.
(a) (b)
1
3 3
6 6
Levels:1, 3, 6
1
1 3
2 4
0001
1010
1120
Maximum pole density: 9.1
[image:3.595.313.542.70.178.2] [image:3.595.129.470.265.419.2]that the accumulation of the polefigure at the left and at the right is the same. The pole density at the center of the pole figure is very high; it is 26 times the average level. Moreover, it is different from those of specimens A and B, as there are no accumulations of the pole density at top and bottom of the polefigure (RD direction).
3.3 Deformation microstructures
Figures 9(a) and 9(b) show the grain structure maps observed from EBSD measurements for specimen A after
deformation up to strains of (a)¹0.4 and (b)¹1.0. The gray grains are within 15° from (0001) (compression plane). Figures 9(a) and 9(b) have the same magnification. There is no existence of (0001) before deformation, but the appearance of (0001) is confirmed at ¹0.4 true strain. The (0001) grains constitute a considerable fraction of the observation area at¹1.0 true strain. Despite the compression plane of the observation area, grains are not elongated towards the RD direction. There is no significant difference in the grain diameter between the strain of¹0.4 and¹1.0.
Levels:1, 2, 4, 8,16
1 2
4 8
16
1 2
4
8 16
1 2 4
16 8
(c)
(b)
(a)
Maximum pole density: 16
Maximum pole density: 20
Maximum pole density: 22
Fig. 7 (0001) Polefigures showing the effect of strain on the texture development of the specimen B. True strains of (a), (b) and (c) are
¹0.4,¹0.7 and¹1.0, respectively.
Levels:1, 2, 4, 8, 16, 24
1 2 4
8
1
2 4
8 1
2 4
8 16 24
(c)
(b)
(a)
Maximum pole density: 15
Maximum pole density: 9.3
Maximum pole density: 26
Fig. 8 (0001) Polefigures showing the effect of strain on the texture development of the specimen C. True strains of (a), (b) and (c) are
¹0.4,¹0.7 and¹1.0, respectively.
TD
RD
(a)
(b)
[image:4.595.127.468.71.220.2] [image:4.595.126.468.269.412.2] [image:4.595.112.486.458.632.2]Rather, the grain diameter is getting smaller at a ¹1.0 true strain.
These characteristics indicate the occurrence of nucleation and grain boundary migration during deformation; that is, dynamic recrystallization (DRX) occurs. These character-istics are also observed in specimens B and C.
4. Discussion
4.1 Components of the texture
A study reports9) that the main component of the texture
after the rolling of the magnesium alloy is (0001)h1120i. Gottsteinet al.investigated the deformation texture of AZ31 magnesium alloy for plane strain compression at various temperatures.10) They reported that the main components
of the texture are (0001)h1120i and (0001)h1010i when deformed at 473 and 573 K, with the deformed texture mainly as (0001)h1010i. A plane strain condition is thus observed for both (0001)h1120iand (0001)h1010i. As shown in Figs. 5, 7 and 8, the high accumulation of pole density exists at the center of each (0001) pole figures for the three kinds of specimens. This suggests that AZ80 also formed a similar texture as AZ31. In fact, as described later, the existence of the (0001)h1120iand (0001)h1010i textures is confirmed. In the case of specimen A, there is no distribution of pole density at the center of the (0001) pole figure before deformation, and the pole density is 10 times the average level after deformation. In the case of specimens B and C, there are distributions of pole density at the center before deformation, and the pole densities of specimens B and C are 22 times and 26 times the average level after deformation, respectively. This means that (0001) (compression plane) is a stable orientation for deformation and inconsumable during DRX.
Furthermore, this is confirmed except for the (0001)huvtwi
texture in Figs. 5, 7 and 8. This means that unreported preferred orientations exist during the high temperature deformation of this alloy. Hence, the preferred orientation was investigated by calculating the ODF based on the results of the EBSD measurements.
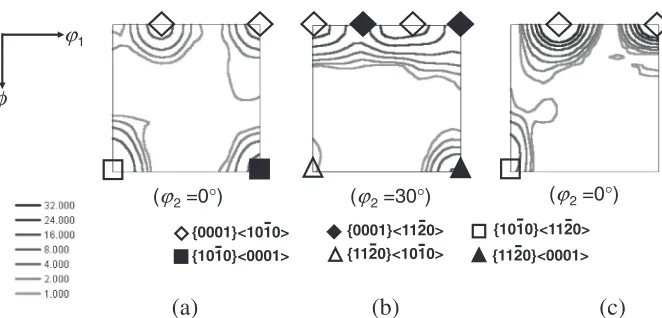
Figure 10 is the¤2=0° section or 30° section for the three
kinds of specimens deformed up to ¹1.0. The preferred orientations are shown below the ¤2 sections. The present
study uses a coordinate system wherein if (¤1,¯,¤2)=
(0°, 0°, 0°), then the coordinates become (0001)h1120i. In Fig. 10 and the other ¤2 sections, (0001)h1010i and
f1120gh1010i are found in all three specimens. The study confirms that (0001)h1120i (Fig. 10(b)) and f1010gh0001i (Fig. 10(a)) exist before deformation, and remain after deformation. As described in section 3.2.2, the texture component around TD in the (0001) pole figure for specimen B that deformed up to a strain of ¹1.0 is also
f1120gh1010i.
The (0001)h1010i is probably produced by DRX as shown in Fig. 9, since the texture was almost non-existent before deformation in the case of specimen A. Jin et al.11)
have reported that the basal texture formation appearing in hot-rolled AZ31 alloy material is caused by the growth of the (0001) oriented grain which was formed through twinning during the initial deformation. As shown in Fig. 9, twinning is not observed during the EBSD measure-ment of specimen A, but the (0001) grains oriented in the direction 90° from the compression axis before deformation shifted to the compression direction by f1012g twinning (h1120i axis 86° rotation) after deformation. Hence, if the twinning grains grow, it is possible to form the (0001) (compression plane) texture. Additional careful examination is needed in the future to understand why twinning causes the (0001)h1010i texture formation.
4.2 Preferred orientation and deformation of the plane strain compression
Two of the authors found that the texture formation (preferred orientation) by grain boundary migration in the AlMg solid solution fulfills two conditions when the viscous motion of the dislocation is dominant. The first is the correspondence to the Taylor factor. The preferred orientation appearing in the AlMg alloy has a low Taylor factor, and such orientation can grow by consuming other grains. The second is that it is a stable orientation for deformation. A texture with a different stable orientation for deformation is formed through grain boundary migration during the high temperature deformation of AlMg alloy. It is understood that the orientation simultaneously fulfills both the first and second conditions.
The work softening type stressstrain curves shown in Fig. 4 for this alloy suggest that the viscous motion of ϕ1
(a)
(b)
(c)
(ϕ2=0°) (ϕ2=30°) (ϕ2=0°)
{0001}<1120> {1010}<1120> {0001}<1010>
{1010}<0001> {1120}<1010> {1120}<0001>
[image:5.595.132.463.66.225.2]φ
dislocation is dominant in the conditions of the present examination. Therefore, there is a possibility that the characteristics of the texture will also fulfill the two conditions described above. Since there is no fixed Taylor factor in HCP, from the point of view of the second condition, all the appearing orientations in all of the specimens were examined.
Figure 11 shows the standard stereographic projection shown in the relationship between the active slip system and the plane strain deformation. Figures 11(a) and 11(b) show the (0001)h1010i and f1120gh1010i, respectively. The slip system of magnesium alloy is a basal slip (0001)h1120i at around room temperature. It has been known for a long time that the f1010gh1120i prismatic slip system and the
f1122gh1123ipyramidal slip system which can contribute to the deformation towards the c-axis can be activated at high temperatures.12,13) Activating the basal slip is considered to
be most difficult in specimen A. As shown in Fig. 4, theflow stress of specimen A is the highest among the three kinds of specimens. This fact suggests that the basal slip system is the easiest to activate even at a temperature of 723 K.
As shown in Fig. 11(a), all the slip direction and compression plane are parallel to each other, so all the
h1120icannot contribute to the compression deformation in this orientation. Whereupon, the four pyramidal slip systems can be activated for the plane strain deformation because the
f1122gh1123ihas a mirror symmetry as the center symmetry for the NDRD plane. Deformation which satisfies the conditions for plane strain and which has no crystal rotation occurs when these slip systems are activated equivalently. That is, (0001)h1010iis considered to be a stable orientation for slip deformation. In the case of f1120gh1010i, as shown in Fig. 11(b), the prismatic slip systems have mirror symmetry at the TD axis, and the two h1120i directions don’t have the components of the TD direction. It is possible to deform while satisfying the conditions for plane strain and with no crystal orientation if the pyramidal slip systems are active. It is found that (0001)h1120i and f1010gh0001i are also stable orientations for deformation when analyzed in the
same way. These orientations exist after deformation. Unlike the two orientations described above, these two orientations do not develop. Although the details are not described in this paper, it is presumed that these can be attributed to the difference in the priority for grain boundary migration. However, this point needs further examination.
5. Conclusions
In order to clarify the characteristics of texture formation during high temperature deformation in an AZ80 solid solution magnesium alloy, three kinds of specimens with different initial textures were experimentally studied in terms of the process of texture formation by plane strain compression. The major results are as follows.
(1) The texture by plane strain compression at high temperatures is formed along with the occurrence of DRX.
(2) The formation texture deformed up to a strain of¹1.0 were constructed from the components of (0001)h1010i,
f1120gh1010i, (0001)h1120iandf1010gh0001i. (3) The texture components can be divided into two types.
Thefirst type is one wherein the components don’t exist before the deformation, while the other type is one wherein the components exist before the deformation. They both are stable orientations for plane strain compression through slip deformation.
(4) When (0001) exists before deformation, an extremely sharp (0001) (compression plane) texture is formed. This means that the (0001) is a stable orientation for plane strain deformation, and that the orientation is difficult to consume during DRX.
Acknowledgement
The authors are grateful to The Japan Light Metal Educational Foundation, Inc. for thefinancial support.
REFERENCES
1) J. Kaneko and M. Sugamata:J. JILM54(2004) 484492.
2) Y. Tozawa:J. JILM51(2001) 492497.
3) K. Okayasu, H. Takekoshi and H. Fukutomi:Mater. Trans.48(2007) 20022007.
4) K. Okayasu, H. Takekoshi, M. Sakakibara and H. Fukutomi:J. Japan Inst. Metals73(2009) 5863.
5) T. Al-Samman:Acta Mater.57(2009) 22292242.
6) M. Dahms and H. J. Bunge:J. Appl. Crystallogr.22(1989) 439447.
7) K. Okayasu and H. Fukutomi:Mater. Sci. Forum495497(2005) 579 584.
8) L. Helis, K. Okayasu and H. Fukutomi:Mater. Sci. Eng. A430(2006) 98103.
9) K. Ohtoshi and M. Katsuta:J. JILM51(2001) 534538.
10) G. Gottstein and T. Al-Samman:Mater. Sci. Forum495497(2005) 623632.
11) Q. Jin, S.-Y. Shin and S.-G. Lim:Scr. Mater.55(2006) 843846.
12) H. Yoshinaga and R. Horiuchi: Trans. JIM4(1963) 18.
13) S. Ando, K. Nakamura, K. Takashima and H. Tonda:J. JILM42(1992) 765771.
(a) (b)
[image:6.595.56.285.69.208.2](0001) {1010} {1122} <1120> <1123>
Fig. 11 Standard stereographic projection showing (0001), f1010g and