Microstructural Modification in a Beta Titanium Alloy for Implant Applications
Tsing (Qing) Zhou
1;*1, Goroh Itoh
2;*2, Yoshinobu Motohashi
3and Mitsuo Niinomi
4;*31Satellite Venture Business Laboratory, Ibaraki University, Hitachi 316-8511, Japan
2Department of Mechanical Engineering, College of Engineering, Ibaraki University, Hitachi 316-8511, Japan 3
The Research Center for Superplasticity, Ibaraki University, Hitachi 316-8511, Japan
4Department of Production Systems Engineering, Toyohashi University of Technology, Toyohashi 441-8580, Japan
A recently developed beta titanium alloy, Ti–29–13, for biomedical applications has been subjected to microstructure examination and tensile test. Band structure is observed both in the as-received and cold-rolled specimens. By EDX in SEM, the band structure is confirmed to originate from the segregation of beta stabilizer. Thermomechanical processings consisting of repeated solution treatment, water quenching and cold-rolling are performed to reduce the segregation. The considerable reduction of the band structure is found in the processed specimen. The elongation at high temperature of the processed specimen is larger than that of the cold-rolled specimen although no difference in the strain rate sensitivity is confirmed between them.
(Received August 11, 2005; Accepted October 6, 2005; Published January 15, 2006)
Keywords: beta titanium alloy, biomaterial, segregation, deformation, high temperature
1. Introduction
Titanium alloy are known as excellent implant materials for their high specific strength (the ratio of the strength over the density) and high corrosion resistance. For example, Ti– 6Al–4V has been used as artificial hip joint, artificial bone etc. in a great amount. The disadvantage of the alloy is that its Young’s modulus is still greater than that of bone. Further-more, the element of vanadium, etc. is reported to have a
toxic effect on the tissues.1,2) Recently, a V-free beta-type
titanium alloy was developed by one of the authors3)that is
composed of approximately 29 mass% niobium, 13 mass% tantalum and 5 mass% zirconium. The modulus of solution-treated Ti–29–13 (Ti–29–13 is referred as the alloy of Ti– 29%Nb–13%Ta–5%Zr in this paper) is half as that of Ti–
6Al–4V.3)Excellent biocompatibility4)has been found in the
test of implanting the alloy into the femur of a rabbit when compared with the testing result of implantation of Ti–6Al– 4V and other materials. Because of these excellent mechan-ical properties and biocompatibility, the application of the alloy on implant materials has been highlighted.
However, it is known that the machinability of titanium alloy is poor, which has limited the application of the metal. Recently, beta titanium alloy has attracted more attention because the plastic formability of beta titanium alloy is
better than alpha alloy or þ alloy. Further, superplastic
forming at high temperature, a method of near-net-shape forming, is expected to be used for forming complex shape component at low cost. Studying on the plastic deformation behavior at high temperature becomes important for the reason that it plays a basic role of understanding the superplastic processing.
In the former report,5)the tensile tests at high temperatures
with a cold-rolled Ti–29–13 under constant cross-head speed
have been performed. The strain to failure is generally smaller than that of Ti–15%V–3%Cr–3%Sn–3%Al, a typical metastable beta-type alloy, called as Ti–15–3 in this paper.
The maximum one is 1.33 at 800C, as low as half of that of
Ti–15–3.
In this paper, for higher ductility at high temperature of the alloy, the microstructure of the Ti–29–13 will be checked and improvement on the microstructure will be done. The relation of the microstructure to the high temperature mechanical properties will be presented.
2. Experimental Procedures
The Ti–29–13 was induction-skull-melted,
hot-isostatic-pressed at 1174C and 172 MPa for 4 h, hot-forged in air at
950C into round bar of 40 mm in diameter and then further
hot-forged in air at 840C to 12 mm in diameter. A hot-rolled
Ti–15–3 plate with the thickness of 12 mm was also prepared. The rod and plate of two alloys were cold-rolled into 1.5 mm thickness with the step of 0.025 mm per pass, and then machined into tensile-test pieces with gauge length of 15 mm and width of 3 mm where tensile direction is parallel to the rolling direction. Tensile test was performed on a screw-driven testing machine with a chamber able to be evacuated. After the test piece was attached to the machine, the chamber
was evacuated to a pressure of 102Pa, back-filled with
argon to the atmospheric pressure. Then the test piece was heated to the testing temperature, held at this temperature for 15 min, and finally tested at constant cross-head speeds to
failure. The initial strain rate was between 1102 and
1104s1, and the temperature was 750C (¼0:52T
m,
whereTmis the melting point of pure titanium in Kelvin).
[image:1.595.304.551.755.783.2]The chemical compositions of the two alloys are listed in Table 1 and Table 2, respectively. The alloy of Ti–29–13 is
Table 1 Chemical composition of Ti–29–13 alloy (mass%).
Nb Ta Zr Al Fe O C N H Ti
31.5 11.6 4.7 0.02 0.03 0.14 0.02 0.03 0.006 Bal.
*1Present address: College of Mechanical and Electrical Engineering,
Nanjing University of Aeronautics and Astronautics
*2Corresponding author, E-mail: [email protected]
*3Present address: Department of Biomaterials Science, Institute for
metastable beta alloy which can be testified by molybdenum
equivalent,6) Mo Eq, which is defined by the following
equation:
Mo Eq¼1.0Moþ0.67Vþ0.44Wþ0.28Nb
þ0.22Taþ2.9Feþ1.6Cr1.0Al; ð1Þ
where the element symbol is the concentration of the beta
stabilizing elements in mass percent. The Mo Eqindicates
beta stability of the various alloys. The beta transus
temper-ature is decreased as theMo Eqis increased. TheMo Eqof
Ti–15–3, a typical metastable beta alloy, is approximately
12.2,7)near that value 11.4 for theMo Eqof Ti–29–13. For
examining the beta transus temperature of Ti–29–13, the observation of optical microstructure is performed with
solution treatment in the temperature range of 700–800C
and subsequently quenched to room temperature. In the temperature range, alpha phase has not been found, which explains that the transus temperature of the present alloy is
below 700C.
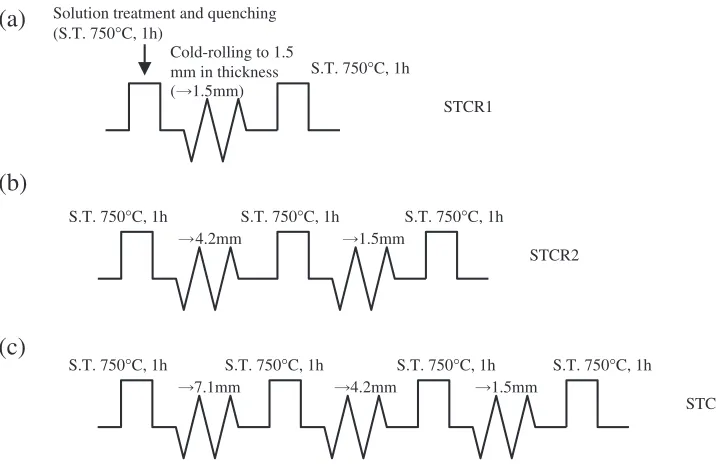
For modifying the microstructure, some Ti–29–13 rods were subjected to the thermomechanical processing consist-ing of solid solution treatment, quenchconsist-ing and cold-rollconsist-ing, which is schematically shown in Fig. 1. The as-received rod
was solution-treated at 750C for 1 h, water-quenched,
cold-rolled to 1.5 mm in thickness and solution-treated and quenched again, which will be referred to as STCR1. The other rod was solution-treated, quenched, cold-rolled to an intermediate thickness of 4.2 mm and then treated with the same procedure as STCR1, being referred to as STCR2. The other rod was cold-rolled to the intermediate thicknesses of 7.1 mm and subsequently subjected to the same procedure as
STCR2, referred to as STCR3. The final thicknesses were identically 1.5 mm. The tensile specimens were cut from the final sheets and tested under constant cross-head speeds at the temperature over the beta transus.
The microstructures of the specimens were investigated with an optical microscope (OM) and a scanning electron microscope (SEM) with an energy dispersive X-ray spectro-scopic (EDX) device.
3. Results and Discussion
Figure 2 shows the optical microstructures for the as-received and cold-rolled specimens. On both photographs, band-like transgranular structures are observed; the spacing of the band in Fig. 2(b) is smaller than that in Fig. 2(a). The grain of the as-received Ti–29–13 shows equiaxed feature
with about 15mmin average size. To further define the band
structure, a region between two indentation markers was investigated by backscattered electron images (BSEI) in the SEM, as well as OM. The obtained photographs are shown in Figs. 3(a) and (b) for the same area. Comparing the two micrographs, it is found that the dark bands in the OM photograph are imaged also as dark bands in the BSEI. In the BSEI, the dark and light parts indicate the reflection of the relatively light Ti atom, and relatively heavy Nb and Ta atoms, respectively. Further, the neighboring dark and light bands shown in Fig. 3(a) were subjected to a semi-quanti-tative EDX analysis under the same condition in the SEM.
Integrated intensity of the major elements:ITi,INbandITawas
measured from the EDX spectra and listed in Table 3. Since the EDX apparatus used in this study was not equipped with quantitative analysis software, a simple equation
¼ INbþITa
INbþITaþITi
ð2Þ
[image:2.595.45.292.83.112.2]is used to assess the content of the beta stabilizing elements in the two parts. It can be seen from Table 3 that, except for Table 2 Chemical composition of Ti–15–3 alloy (mass%).
Al Sn V Cr Fe O C N H Ti
3.19 3.10 15.05 3.27 0.01 0.081 0.0049 0.011 0.0189 Bal.
Solution treatment and quenching (S.T. 750°C, 1h)
Cold-rolling to 1.5 mm in thickness ( 1.5mm)
S.T. 750°C, 1h
S.T. 750°C, 1h
4.2mm
S.T. 750°C, 1h S.T. 750°C, 1h
7.1mm 4.2mm 1.5mm
1.5mm S.T. 750°C, 1h
S.T. 750°C, 1h S.T. 750°C, 1h S.T. 750°C, 1h
(a)
(c)
(b)
STCR1
STCR2
STCR3
[image:2.595.114.472.537.771.2]one point, the three points show the X-ray integrated intensity
of the beta stabilizers,, is larger for the light part than that
for the dark part. It confirms that the amount of Nb and Ta atom in the dark band is smaller than that in the light band. The above observation reveals that the band structure is yielded by the segregation of beta stabilizing elements. It also explains that the segregation has already taken place in the as-received state [Fig. 2(a)].
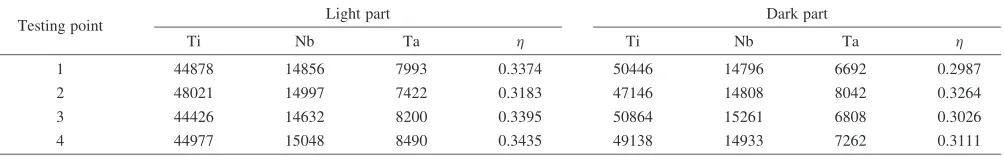
The thermomechanical processing was carried out to attempt to diminish the band structure. Firstly, the
as-received specimen was applied to a single annealing at 750C
for 4 h in the argon atmosphere. The result is shown in Fig. 4, together with that of the as-received specimen. Comparison of the photograph of the as-received one, Fig. 4(a), with the annealed one, Fig. 4(b), shows some reduction of the intensity of band structure, but a complete diminishing of the band has not been observed. Secondly, the cold-rolled sheets were treated with the processes of STCR1, STCR2 and STCR3. The BSEI photographs of the processed specimens are shown in Figs. 5(a), (b) and (c). It is found that with the
progress of the STCR (Figs. 5a!b!c), the band structure is
[image:3.595.97.495.73.202.2] [image:3.595.98.500.244.370.2] [image:3.595.48.550.441.519.2]reduced gradually and almost diminished in the STCR3 [Fig. 5(c)]. Dramatic reduction of the segregation band after STCR3 is found when comparing to that of the single
annealing at 750C for 4 h [Fig. 4(b)].
The diffusion of the beta stabilizing atoms in the annealing is considered to be the mechanism eliminating the segrega-tion. The total annealing time in the processing of STCR3 is the same as that of the single annealing. The different results in the band structure can be attributed to the microstructures before annealing, as shown in Fig. 2. The cold-rolled band structure [Fig. 2(b)] shows that the band space between two neighbor bands is reduced significantly comparing with that in the as-received specimen [Fig. 2(a)]. Because a high density of dislocations is induced in the microstructure by the cold-rolling and hence subgrains and fine recrystallized grains are formed in the following restoration process, enhanced diffusion behavior along dislocations, subgrain boundaries and grain boundaries occurs and is the primary reason for the diminishing of segregation.
30
µµ
m
(a)
(b)
ST
L
Fig. 3 Microstructure photographs of the cold-rolled Ti–29–13 observed by (a) back scattering electron image in the SEM and (b) optical microscope. Two Vickers indentations are made to identify the same observed area.
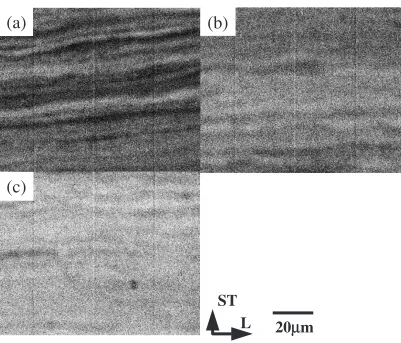
Table 3 X-Ray integrated intensity of the major elements in Ti–29–13 by EDX in SEM.
Testing point Light part Dark part
Ti Nb Ta Ti Nb Ta
1 44878 14856 7993 0.3374 50446 14796 6692 0.2987
2 48021 14997 7422 0.3183 47146 14808 8042 0.3264
3 44426 14632 8200 0.3395 50864 15261 6808 0.3026
4 44977 15048 8490 0.3435 49138 14933 7262 0.3111
ST
L
20
µ
m
(a)
(b)
Figure 6 shows the strain to failure of the Ti–29–13 after the processing of STCR3 in comparison with those of the cold-rolled Ti–29–13 and the cold-rolled Ti–15–3. Although smaller than that of Ti–15–3, the strain to failure is significantly larger than that of the cold-rolled Ti–29–13
within the initial strain rate range of1104–1102s1.
The stable true stress appears in the true stress–true strain curves of Ti–29–13 before the stress decreasing and the fracture, which shows steady deformation before necking. The flow stress defined as the true stress at 0.15 true strain in
the true stress–true strain curve, where the deformation is regarded as steady state, is plotted in Fig. 7 against the initial
strain rate ranging from1104to1102s1. The strain
rate sensitivity, the dependence of the flow stress on the strain rate, is near 0.3. It is almost the same as that of the simply cold-rolled Ti–29–13 and that of the cold-rolled Ti–15–3. The stress exponent, which is the reciprocal of the strain rate sensitivity, approximately 3, implies a solute-drag
deforma-tion mechanism,8) which is based on the dislocation creep,
not grain boundary sliding, and may be correspondent to the
20
µµ
m
ST
L
(a)
(b)
(c)
Fig. 5 Back scattering electron images in the SEM for Ti–29–13 specimens processed with (a) STCR1, (b) STCR2, (c) STCR3.
L
ST
Observation area(a)
(b)
20
µ
m
[image:4.595.98.498.73.257.2] [image:4.595.97.498.286.629.2]deformation condition in the single beta phase state with a high concentration of solute atoms.
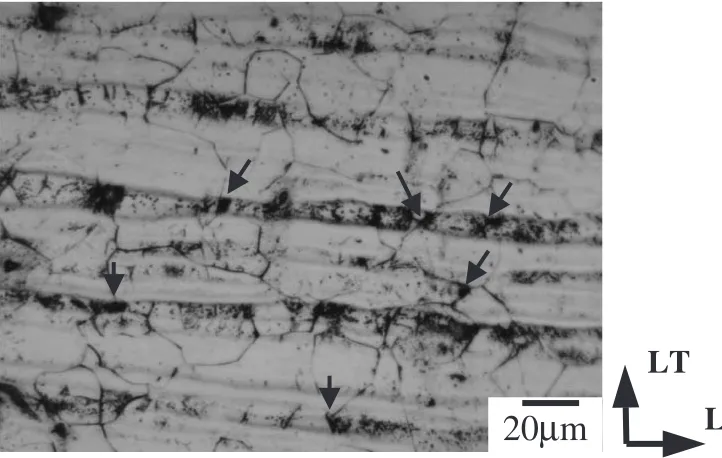
The grain size in the STCR3-processed specimen, regard-ed as the same as that just before the tensile test, is found to be close to that of the cold-rolled Ti–29–13 just before the tensile tests. Except for the grain size factor, the increase in the elongation by the STCR3 processing in Ti–29–13 (Fig. 6) is understandable from the solute-drag deformation model although precise mechanism should be investigated else-where in the near future. The segregation band structure may produce two zones having different solute-drag forces for the dislocation gliding. In the zone with lower solute drag force, the local flow stress will be lower although the total flow stress is the same as the STCR3-processsed homogeneous specimen. The lower-drag-force zone will tend to deform more largely than the higher-drag-force zone, resulting in a local strain. In this study, the two zones are in the form of band structure, and the bands are parallel to the tensile direction. This geometric condition will suppress the relax-ation of the local strain. Hence, the higher drag force will facilitate the intergranular cavitation which will be the cause for the lower fracture strain than that in the STCR3-processed
specimen. The photograph taken near the fracture surface, Fig. 8, showing the formation of cavities in the dark part of the band structure, testifies different flow stresses between the dark and light part.
4. Conclusion
For near-net-shape forming application, the deformation behavior of recently developed Ti–29–13 alloy at a high temperature has been studied. Band structures are observed on the as-received and cold-rolled specimens with both the optical microscope and the backscattered electron image in SEM. It is found by the analysis of the X-ray intensity in EDX that the band structure is caused by the segregation of the beta stabilizing elements. The thermomechanical proc-essing consisting of repeated solution treatment, water quenching and cold rolling is applied to attempt to reduce the segregation. Considerable reduction is obtained by the procedure of STCR3. Enhanced diffusion along dislocations, subgrain boundaries and grain boundaries is deduced to
Cold-rolled Ti-29-13
Cold-rolled Ti-15-3 STCR3
Ti-29-13
10-4 10-3 10-2 10
100
Flow stress,
/ MPa
σ
/ s
ε
iInitial strain rate, · -1
Fig. 7 Plotting of the flow stress against the initial strain rate at 750C.
20
µ
m
LT
L
Fig. 8 Optical micrographs of the cold-rolled Ti–29–13 tensile-tested at 750C and the initial strain rate of1104s1to the failure. The
specimen is polished and etched by Kroll solution before observation. The left side of the photograph is near the fracture surface. The arrows indicate the places of the cavity.
/ s ·
i
Cold-rolled Ti-29-13 STCR3, Ti-29-13
Cold-rolled Ti-15-3
10-4 10-3 10-2 0
0.5 1.0 1.5 2.0
Strain to failure,
εf
Initial strain rate, ε -1
[image:5.595.325.526.323.478.2] [image:5.595.70.272.350.479.2] [image:5.595.116.477.518.747.2]primarily contribute to diminishing the segregation. The strain to failure of the STCR3-processed specimen at constant initial strain rates is found to be increased compar-ing to that of the cold-rolled specimen. The strain rate sensitivity of the STCR3-processed specimen is near 0.3, which is almost the same as those of the cold-rolled Ti–29–13 and the cold-rolled Ti–15–3.
Acknowledgement
The authors wish to thank Mr. T. Horikoshi and Mr. T. Ichikawa, Research and Development Center, Hitachi Cable, Ltd. for the assistance of tensile tests. This study has been conducted with financial supports by the Research Group on New Development of Body-Centered-Cubic Titanium in the Iron and Steel Institute of Japan, and by the Light Metal Education Foundation, which are gratefully acknowledged.
REFERENCES
1) R. Zwicker, K. Bu¨ehler and R. Mu¨eller:Titanium 1980, Science and Technology, Proc. 4th Int. Conf. on Titanium, (The Metallurgical Society of AIME, 1980) pp. 505–514.
2) M. Semlitsch, F. Staub and H. Webber: Biomed. Technik30(1985) 334– 339.
3) D. Kuroda, M. Niinomi, M. Morinaga, Y. Kato and T. Yashiro: Mater. Sci. Eng. A243(1998) 244–249.
4) M. Niinomi, H. Fukui, T. Hattori, K. Kyo and A. Suzuki: Materia Jpn.41
(2002) 221–223.
5) Q. Zhou, G. Itoh, H. Hasegawa, Y. Motohashi and M. Niinomi: Mater. Sci. Forum475–479(2005) 2299–2302.
6) P. J. Bania: J.O.M.41(1994) 16–19.
7) D. Eylon:Metallurgy and Technology of Practical Titanium Alloys, ed. by: S. Fujishiro, D. Eylon and T. Kishi, (TMS, Warrendale, PA, 1994) pp. 29–34.