Determination of Cyclic-Tension Fatigue of Al-4Cu-1Mg Alloy
Using Ultrasonic Shear Waves
H. Yamagishi
1;*and M. Fukuhara
2 1Central Research Institute, Toyama Industrial Technology Center, Takaoka 933-0981, Japan 2Institute for Materials Research, Tohoku University, Sendai 980-8577, Japan
Cyclic-tension fatigue of aluminum alloy, Al-4Cu-1Mg, was determined by an analysis of diffracted SH and SV waves, passing through the surface and reflecting the bottom of the specimen, respectively. The propagation time of SH waves and the internal friction of SV waves begins to decrease and increase from fatigue damage ratio (¼N=Nf) of 0.5, respectively, suggesting noticeable increase of movable dislocation.
From the analysis of SH waves along the direction to the loading axis, the damping ratio decreases and the phase advances with increasing of the degree of fatigue. Assumed from SH wave flux model, the former behavior correlates well with increasing of the residual stress by cyclic tension. The latter may be characterized by viscoelasticity. These results show that ultrasonic transmission method is useful probe for evaluation of fatigue in aluminum alloy. [doi:10.2320/matertrans.48.550]
(Received November 15, 2006; Accepted January 22, 2007; Published February 25, 2007)
Keywords: fatigue, aluminum alloy, cyclic tension, nondestructive inspection, acoustic characteristics
1. Introduction
When engineering metals are subjected to fluctuating loads in service, they are liable to fracture by fatigue, the most
common of all causes of engineering failure.1–3)Thus there
have been extensive efforts to relate observed data using
X-ray diffraction,4–6)positron annihilation,7,8)laser diffusion,9)
ultrasonic transmission,10–12) acoustic emission,13,14)
hard-ness15) methods to evaluate the actual fatigue level in
materials. However, conventional methods are not necessa-rily satisfactory to predict the damage of fatigued materials for field application.
To develop a nondestructive inspection technique for fatigue, we investigated acoustic characteristics of an aluminum alloy, using horizontally polarized shear wave and vertically polarized shear wave (here after referred to as SH and SV wave, respectively). The shear waves are known as sensitive to even atomic or molecule level material
change.16)SH wave has polarized plane which is parallel to
the interface when it propagates with the angle of incident, that is, the transmission wave is easy to propagate under the target surface. And as further advantage, it does not transform its wave mode from shear wave to longitudinal wave, just
remains shear wave mode.17) However, having some great
advantages, this method needs adequate condition of meas-uring such as surface roughness, pressing load, load-holding
time18)and so on, because it is contact method. Utilizing the
advantage of this wave, we must keep these precautions in mind.
In this study, we selected the aluminum alloy as fatigued material, because it is the most commonly used light-metal that fatigue evaluation has not fully developed.
2. Experimental
2.1 Material
The material used in this study was Al-4Cu-1Mg alloy
(JIS-A2024, temper T3) supplied by Corus Aluminum Walzprodukte GmbH. The chemical composition and me-chanical prosperities of material are shown in Table 1 and Table 2, respectively. The specimen configuration, which originally designed for fatigue tests, is shown in Fig. 1. The specimen is a flat-rolled bar with a narrow part for break.
2.2 Experimental methods
Specimen was subjected to a cycle stress amplitude of 233 MPa under load control with 30 Hz frequency in monaxial tensile mode at room temperature, to apply fatigue damage. The fatigue tests were interrupted at various cycles to obtain fatigued specimens having different damages. After
specified number of cycles,N=Nf ¼0, 0.03, 0.16, 0.32, 0.48,
0.64, 0.80, 0.96 (N: number of cycles,Nf: number of cycles to
failure =3:12105), the waveform deviation between the
two contact lines in the center sections of the specimens (Fig. 1) was measured by the use of a bridge with an ultrasonic transmitter/receiver set (Fig. 2). Ultrasonic wave pattern analysis was made by diagnosis and analyzing apparatus (Toshiba Tungaloy).
The apparatus and a block diagram for the measurement are presented schematically in Fig. 2. Facing narrow-band
width SH wave transducers, with probe area of 6mm
6mm, were used as the transmitter and the receiver. The two
facing transducers in the bridge were arranged by a ditch of 10 mm width. The incident and receiving angles of the SH
waves were fixed at 21 which gives maximum receiving
amplitude derived from following formula:
Sin1 V1
¼Sin2
V2
ð1Þ
whereSin1 andSin2are incident and refracting angles for
boundary normal, respectively. V1 and V2 are shear wave
velocities of contacting material of piezoelectric element and
pure aluminum, respectively.2is designed for surfacewave,
i.e., critical angle 90. In order to prevent propagation loss
due to high frequency and signal broading due to low frequency, a frequency of 5 MHz was selected as center
*Corresponding author, E-mail: [email protected]
frequency of transducer. The transducer was contacted at one edge of specimen under a pressure of 3.1 MPa, by water-free
naphthenic hydrocarbon oil (Tungsonic Oil H19)).
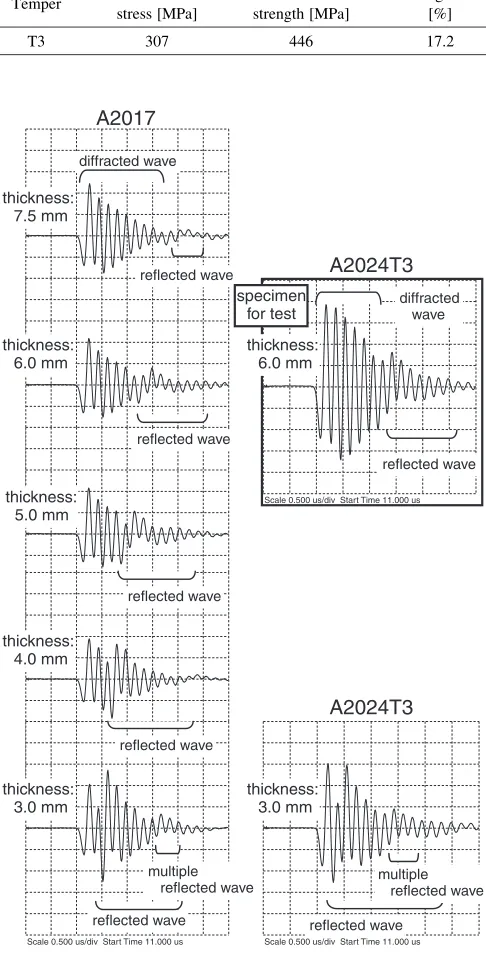
[image:2.595.50.549.85.124.2]Figure 3 shows propagation behavior of SH wave in thin plate using this probe. This result shows that the effective depth of SH wave is up to around 7.5 mm and the influence of reflected wave at the bottom surface of specimen, A2024T3 thickness 6.0 mm, is confirmed around 7–8th wavelet.
Table 2 Mechanical prosperities of material.
Temper 0.2% Proof stress [MPa]
Tensile strength [MPa]
Elongation [%]
T3 307 446 17.2
Direction A
Direction B Loading axis
(=Rolling direction)
t6
Fig. 1 Configuration of the tension test specimen (dimension in mm).
Specimen (A2024T3 t6)
AD Converter
Wave Memory
Filter
Peak Detector
Spectrum–Analyzer
Receiver
Transmitter
SH sensor
(Specimen)
(SH sensor)
(Pressing Jig)
Pressing
Jig
Weight
Pulser / Receiver
10
22
6
(mm)
Fig. 2 Schematic diagram for measurement.
Scale 0.500 us/div Start Time 11.000 us Scale 0.500 us/div Start Time 11.000 us Scale 0.500 us/div Start Time 11.000 us
A2017
A2024T3
A2024T3
diffracted wave
reflected wave
reflected wave
reflected wave
reflected wave
reflected wave reflected wave
diffracted wave
reflected wave
multiple
reflected wave multiple reflected wave
thickness: 7.5 mm
thickness: 6.0 mm
thickness: 5.0 mm
thickness: 4.0 mm
thickness: 3.0 mm
thickness: 6.0 mm
thickness: 3.0 mm specimen
for test
Fig. 3 Propagation behavior of SH wave in thin plate. Table 1 Chemical composition of material [mass%].
Material Si Fe Cu Mn Mg Cr Zn Ti Ti+Zr Others
each
[image:2.595.51.284.130.239.2] [image:2.595.305.548.172.650.2] [image:2.595.57.283.294.769.2]Therefore we decided to analyze the waveform until 3rd wavelet to avoid the influence of reflected wave. In this case it can be estimated the effective depth of SH wave is up to around 4 mm.
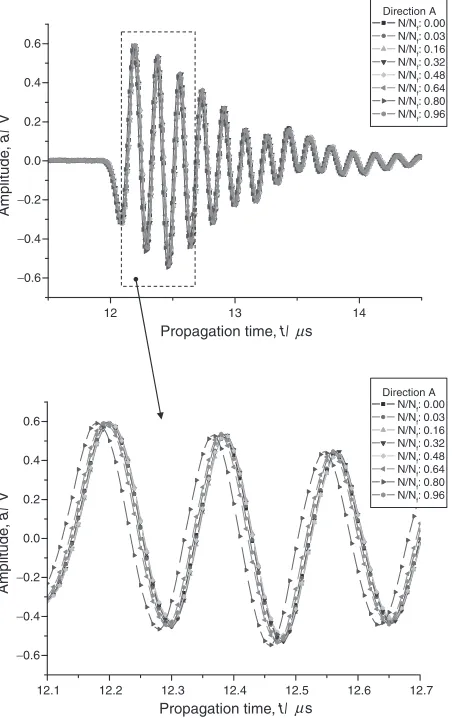
After application of a given cyclic load, we analyzed the wave patterns of SH waves propagated through the fatigued specimens. Figure 4 and Figure 5 show transitions of receiving waveform with fatigue damage ratio in direction A and its superposition corrected to be equivalent maximum amplitude, respectively. Apparently, it is hard to find
informative shift except for the time advance of N=Nf ¼
0:80. The transition of direction B is much the same to
direction A. Since the receiving waveform varies delicately with the degree of fatigue, we extracted the specific parameters, propagation time, damping ratio and phase from receiving waveform for more advanced analysis.
Figure 6 shows a representative SH waveform pattern. We measured the position of the 1st wavelet as propagation time
T1. The damping ratios,P1=P2andS1=S2, were calculated
from amplitudes and its integrated area, respectively. And we use conveniently the waveform from 1st to 3rd wavelets for fast fourier transform (FFT) to determine the main frequency
f and phase’ at f. The phase’ was calculated using the
following formula:
¼arctan Imð!Þ Reð!Þ
ð2Þ
where!¼2f.Reð!ÞandImð!Þare the real and imaginary
parts of wave passing through the sample.
The internal friction at intersection of parallel and Scale 0.500 us/div Start Time 11.000 us
Scale 0.500 us/div Start Time 11.000 us
Scale 0.500 us/div Start Time 11.000 us
Scale 0.500 us/div Start Time 11.000 us
N/N
f: 0
N/N
f: 0.32
N/N
f: 0.64
N/N
f: 0.96
Fig. 4 Transition of receiving waveform with fatigue damage ratio.
12.1 12.2 12.3 12.4 12.5 12.6 12.7
−0.6
−0.4
−0.2 0.0 0.2 0.4 0.6
Amplitude
,
a
/
V
Propagation time, t/µs
12 13 14
−0.6
−0.4
−0.2 0.0 0.2 0.4 0.6
Amplitude
,
a
/
V
Propagation time, t/ µs
Direction A N/Nf: 0.00
N/Nf: 0.03 N/Nf: 0.16
N/Nf: 0.32
N/Nf: 0.48
N/Nf: 0.64 N/Nf: 0.80
N/Nf: 0.96
Direction A N/Nf: 0.00
N/Nf: 0.03
N/Nf: 0.16
N/Nf: 0.32
N/Nf: 0.48
N/Nf: 0.64
N/Nf: 0.80
N/Nf: 0.96
[image:3.595.98.242.65.696.2] [image:3.595.316.542.75.434.2]perpendicular directions to the loading axis,i.e., direction A and B, respectively shown in Fig. 1, was measured by a SV wave with frequency of 5 MHz at room temperature. The
logarithmic dampingwas determined by the form:
¼ln A1
A2
ð3Þ
whereA1andA2are 1st and 2nd amplitudes of the receiving
waves, respectively.
The internal friction Qs1 is defined by the following
formula:
Qs1 ¼
Vsln
A
1 A2
2l f ð4Þ
whereVsis the sound velocity of SV wave.lis the thickness
of the specimen and f is the center frequency.
3. Results and Discussion
The relationships of propagation time and internal friction
for fatigue damage ratio N=Nf are shown in Fig. 7. The
propagation times for parallel and perpendicular directions to the loading axis increase smoothly, respectively, and then,
from aroundN=Nf ¼0:5, decreases absurdly up toN=Nf ¼
0:8 with increasing of N=Nf. For both directions, a
sub-sequent beading makes the propagation time lengthen. On the other hand, the internal friction does not change distinctly up
to around N=Nf ¼0:5, but noticeably increases for beading
overN=Nf ¼0:5. Therefore, the sharp change in propagation
time correlates with the rapid increase in internal friction. Here we consider a relation between fatigued degree and internal friction in terms of energy consumption by
disloca-tion modisloca-tion. Koehler,20)Granato and Lu¨cke21)produced KGL
model expressing dislocation motion by assuming elastic
string model under the condition of viscoelasticity. Accord-ing to KGL model, the internal friction is leaded by the
following equations:22)
A@ 2u @t2 þB
@u
@t C @2u
@x2 ¼b ð5Þ
whereu,A,B,Candbare displacement, effective mass per
unit length, viscous resistance, line tension and Burgers vector, respectively. The solution of normal vibration is expressed in the following form:
u¼4b0
A sin
Lx
exp½ið!t
0Þ
ffiffiffiffiffiffiffiffiffiffiffiffiffiffiffiffiffiffiffiffiffiffiffiffiffiffiffiffiffiffiffiffiffiffiffiffiffiffi ð!2
0!2Þ
2þ ð!dÞ2
q ;
!0¼ L
ffiffiffiffi
C A
r
; tan0¼ !d
ð!2 0!2Þ
; d¼B
A
! ð6Þ
whereL is transposition length. On the assumption that all
transposition lengths are the same, the distortion"dcaused by
dislocation displacement is calculated by the following form:
"d ¼
b L
ZL
0
udx ð7Þ
where is dislocation density. Substituting eq. (5) into
eq. (6), the internal friction is leaded by following form:
Q10L
2
w20wd
½ðw20w2Þ2þ ðwdÞ2; 0¼
8b2 3CÞ ð8Þ
Scale 0.500 us/div Start Time 11.000 us
T1
P1
P2
Range of FFT
S2
S1
Fig. 6 Example of a receiving waveform using SH sensor.
0.0 0.2 0.4 0.6 0.8 1.0
0.006 0.007 0.008 0.009 0.010 0.011
Fatigue damage ratio, N/Nf
Inter
nal fr
iction,
∆
Qs
−
1
12.185 12.190 12.195 12.200 12.205 12.210
Propagation time
,
t
/
Propagation time
,
t
/
s
µ
Direction A
Direction B
12.365 12.370 12.375 12.380 12.385 12.390
s
µ
[image:4.595.54.284.69.329.2] [image:4.595.314.541.71.398.2]where is shear modulus. As from N=Nf ¼0:5 of Fig. 7
according to the internal friction form of eq. (8), the rapid increasing point in internal friction suggests the drastic change of material in terms of fatigue. Thus it seems that measurement of propagation time and/or internal friction become a probe for evaluation of fatigue.
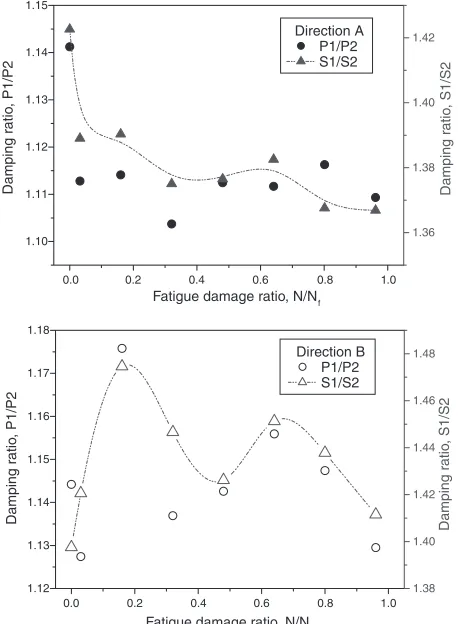
The relationships between fatigue damage ratioN=Nf and
damping ratios,P1=P2andS1=S2, are shown in Fig. 8. The
damping ratios of parallel direction to the loading axis,
direction A, decrease inversely with the increase ofN=Nf. In
particular, the integrated area ratio of amplitude S1=S2
correlates well with the fatigue damage ratio N=Nf in
comparison with damping ratioP1=P2.
Here we consider a relation between fatigued degree and damping ratio in terms of acoustoelasticity. If a
two-dimen-sional x-y plate to which a stress is applied in the xandy
directions of a cartesian coordinate system (x;y;z) (Fig. 9),
where a residual stress exists in the plate, the acoustic energy
flow P of the SH waves propagating in the x-y plane at an
arbitrary anglefrom the norminal (i.e.,z) can be expressed
in the following form;23)
P¼
ffiffiffiffiffiffiffiffiffiffiffiffiffiffiffiffi
P2
xþP2y
q
¼
ffiffiffiffiffiffiffiffiffiffiffiffiffiffiffiffiffiffiffiffiffiffiffiffiffiffiffiffiffiffiffiffiffiffiffiffiffiffiffiffiffiffiffiffi 1
2u xz
2
þ 1
2u yz
2
s
ð9Þ
¼tan1Px
Py
¼tan1 yz
xz
ð10Þ
xz¼
@u
@x; yz¼ @u
@y ð11Þ
u¼Aexp½iðxsinctþzÞ ð12Þ
wherePxandPyare energy flux of direction x and direction
y, respectively.uis the displacement of SH wave to direction
z. xzand yzare shearing stress of directionzatxplane and y
plane, respectively. , A, and are shear modulus,
displacement amplitude, number of waves, element of wave number to direction z, respectively. As can be seen from decrease in damping of Fig. 8 (Direction A) and the energy flux angle of eq. (10) and considering the simulation result that the energy flow of SH wave bends to more interior as the
deeper it propagates,24)it is clear that the incident waves shift
to the specimen surface with increasing residual stress as the
degree of fatigue,i.e., the crystal lattice distortion by tensile
stress. So it is summarized that the damping ratio S1=S2
decreases with the increase of cyclic-tension fatigue. As for
the increase of S1=S2 (Direction A) at N=Nf ¼0:64, it is
assumed to be due to noticeable increase of movable dislocation indicated by Fig. 7. Since a movable dislocation consumes energy of SH wave, the interior wave propagating for a longer path is subject to attenuate. So it is summarized
that the damping ratio S1=S2 increases with the increase of
movable dislocation. However, compared to the influence of residual stress, tensile stress makes the incident waves shift to specimen surface, energy decay by movable dislocation does not seem to carry much weight on damping ratio.
Since interest results of viscoelasticity of aluminum alloy are evaluated from the phase modulation in complex waves,
the relationship between fatigue damage ratio N=Nf and
phaseis shown in Fig. 10. Although the center frequency of
receiving waves does not shift throughout the test, i.e.,
maintains 5.4 MHz for both directions, the phase advances. This means an increase in viscoelasticity during progressive fatigue such as thermal degradation of resin reported by Ref. 25 using SH wave. Although we should investigate why the phase advances with the increase of fatigue, this result is a note of high interest for the possibility of determination of metal’s viscoelasiticity using SH wave.
On the other hand, both damping ratio and phase modulation for perpendicular direction to the loading axis,
directionB, did not show simple characteristics in variation
of N=Nf. The path length for perpendicular direction to the
loading axis is considerably long against the specimen width, 22 mm nearly the specimen width 25 mm, so we must consider the effects of stress gradient and its transition with
increasing of N=Nf. Inflecting of ultrasonic wave by stress
0.0 0.2 0.4 0.6 0.8 1.0
1.10 1.11 1.12 1.13 1.14 1.15
Direction A P1/P2 S1/S2
Fatigue damage ratio, N/Nf
Damping r
atio
, P1/P2
1.36 1.38 1.40 1.42
Damping r
atio
, S1/S2
0.0 0.2 0.4 0.6 0.8 1.0
1.12 1.13 1.14 1.15 1.16 1.17 1.18
Direction B P1/P2 S1/S2
Fatigue damage ratio, N/Nf
Damping r
atio
, P1/P2
1.38 1.40 1.42 1.44 1.46 1.48
Damping r
atio
, S1/S2
Fig. 8 Relationship between fatigue damage ratio and damping ratios.
<
Px
><
Py
><
P
>α
Z
y
x
[image:5.595.336.510.71.221.2] [image:5.595.55.284.74.386.2]gradient has reported by Ref. 23, 26 and eq. (10). Therefore, it may be assumed that the cyclic transitions of damping ratio and phase modulation for perpendicular direction to the loading axis are due primarily to cyclic changes of the traveling path by inflecting due to positioning error of every specimen mounting, process of fatigue itself and so on. In the following paper, we must investigate minutely about this subject using X-ray diffraction (XRD) and transmission electron micrography (TEM).
4. Conclusion
In this study, we analyzed the wave patterns of SH and SV waves propagating through cyclic-tension fatigued alloy, Al-4Cu-1Mg, in view of viscoelasticity and acoustoelasticity. The propagation time both parallel and perpendicular direction to the applied stress and the internal friction at the center of specimen decreases and increases as the number of
cycles increases over N=Nf ¼0:5, respectively. This
sug-gests increasing in movable dislocations, i.e., the drastic
change of material in terms of fatigue. Furthermore the damping ratio and the phase decreases and advances with increasing fatigue, respectively. Assumed from SH wave flux model, the residual stress field applied by cyclic tension makes the damping ratio decrease. The advance of the phase indicates the possibility of fatigue evaluation in terms of viscoelasticity. On the other hand, both damping ratio and phase modulation along the perpendicular direction to the applied stress, the path length is nearly the specimen width,
did not show simple characteristics in variation ofN=Nf. This
would be estimated due to inflection of ultrasonic wave attributed to stress gradient and its transition caused by positioning error of every specimen mounting or process of fatigue itself and so on. As far as we detect acoustic characteristics along the direction to the loading axis, the ultrasonic SH wave method is suitable probe for fatigue evaluation in aluminum alloy.
REFERENCES
1) S. Fujiki: How to look at the fractured surface due to fatigue, (Nikkankougyou, Tokyo, 2002) pp. 2–4.
2) S. Fujiki: Maintenance135(1991) 25–29.
3) K. Moriet al.:Fractography(Maruzen, Tokyo, 2000) pp. 136–137. 4) T. Ungar, G. Ribarik, J. Gubicza and P. Hanak: Trans. ASME. J. Eng.
Mater. Technol.124(2002) 2–6.
5) P. J. Withers: Mater. Sci. Technol.17(2001) 759–765.
6) A. Olchini, H. Stamm and F. D. S. Marques: Surf. Eng.14(1998) 386– 390.
7) F. Hori: Applied Surf. Sci.242(2005) 304–312.
8) Y. Kawaguchi and S. Yasuharu: J. Nucl. Sci. Technol.39(2002) 1033– 1040.
9) A. Kato and F. Okutani: Collected papers of the Japanese society of the mechanical engineers for materials and mechanics division, (2002) pp. 193–194.
10) E. R. Reinhart, S. Kaminski and M. Monaco: Pap. Summ. ASNT. Conf. Qual. Test. Show, (2005) pp. 339–346.
11) J. Frouin, S. Sathish, T. E. Matikas and J. K. Na: J. Mater. Res.14
(1999) 1295–1298.
12) H. Ogi, T. Hamaguchi and M. Hirao: Metall. Mater. Trans.31A(2000) 1121–1128.
13) Z. Shi, J. Jarzynski, S. Bair, S. Hurlebaus and L. J. Jacobs: Proc. Inst. Mech. Eng. Part C214(2000) pp. 1141–1149.
14) J. P. Bonnafe, G. Maeder and Bathiasc: Proc. 3rd Int. Conf. on Shot Peening (1987) pp. 485–497.
15) H. Hattori, M. Kitagawa and K. Sugai: Current Advances in Materials and Processes1(1988) 901.
16) M. Fukuhara and A. Sanpei: Phys. Rev.B49(1994) 99–105. 17) H. Fukuoka, H. Toda and M. Hirao: Basis and application of
acoustoelasticity(Ohmsha, Tokyo, 1993) pp.18–19.
18) N. Oguma and T. Mikami: KOYO Engineering Journal162(2002) 38–42.
19) M. Fukuhara and T. Tsubouchi: Chem. Phys. Lett.371(2003) 184. 20) J. S. Koehler:Imperfections in Nearly Perfect Crystals(John Wiley and
Sons inc., New York, 1952) pp.197.
21) A. Granato and K. Lu¨cke: J. Appl. Phys.27(1956) 583–593. 22) O. Izumiet al.:Atomic theory for strength of materials(The Japan
Institute of Metals, Tokyo, 1985) pp. 77–78.
23) M. Fukuhara, Y. Kuwano, K. Saito and I. Furumura: Collected abstracts of the 1996 Autumn meeting of the Japanese society for non-destructive inspection, (1996) pp. 175–178.
24) H. Toda: J. Jpn. Soc. Nondestructive Inspection40(1991) 415–420. 25) Y. Ueda, T. Tanaka, H. Baba and M. Fukuhara: Collected papers of
the Institute of Electrical Engineers of Japan2(2000) pp. 713. 26) A. Takaoki: J. Japan Inst. METALS23(1959) 108–112.
0.0 0.2 0.4 0.6 0.8 1.0 6
8 10 12
Phase
,
φ
/r
ad
Direction B
Phase
,
φ
/r
ad
Fatigue damage ratio, N/Nf
0.0 0.2 0.4 0.6 0.8 1.0 5.4
5.6 5.8 6.0 6.2
[image:6.595.55.282.69.247.2]6.4 Direction A