111
Cd(
111In) Time Differential Perturbed Angular Correlation (TDPAC)
Spectroscopy in Fe/Ag Films
Takashi Otomo
1;*, Saburo Nasu
1, Shotaro Morimoto
1, Koji Baba
1;*,
Masayoshi Nishiyama
2and Tadashi Saito
31Department of Physical Science, Graduate School of Engineering Science, Osaka University, Toyonaka 560-8531, Japan 2Central Workshop, Osaka University, Toyonaka 560-0043, Japan
3Radioisotope Research Center, Osaka University, Toyonaka 560-0043, Japan
We have investigated the magnetic properties of Cd atoms decayed from111In at the interfaces of Fe/Ag evaporated films. In order to
determine the magnetic properties of the films, we have measured111Cd( 111In) time differential perturbed angular correlation (TDPAC)
spectra at room temperature as a function of distance from the interface. Fe and Ag were evaporated using electron beam evaporation, and small amounts of radioactive111In were evaporated by resistance-heating. The evaporated films had the following stacking orders on kapton polyimide
film substrate: (1) polyimide/Fe 50 nm/111In/Fexnm/Ag 20 nm (x¼0:2;0:3;1;3;5;10), (2) polyimide/Fe 50 nm/Agxnm/111In/Ag 20 nm
(x¼0;0:2;1). We used an Ag layer as a cap layer in order to prevent oxidation in air. TDPAC spectra were measured using a four-detector arrangement. The hyperfine magnetic field tends to be slightly larger when111In is close to the interface of the Fe/Ag layer. The intensity of
perturbation damps rapidly as111In is close to the interface of Fe and Ag. These behaviors are thought to depend on electric field gradients and
the influence of the surface roughness.
(Received September 20, 2005; Accepted January 24, 2006; Published March 15, 2006)
Keywords: 111Cd perturbed angular correlation, time differential perturbed angular correlation, hyperfine magnetic field, iron/silver film
1. Introduction
The physical properties of a particular localized area, such as a surface or an interface, dictate the nature of a material. In order to understand the nature of a [magnetic/non-magnet-ic]nmultilayer, it is necessary to investigate the microscopic nature of the surface and the interface of a magnetic layer with a non-magnetic layer. An effective method for this is to introduce small amounts of a radioisotope as probe atoms into the material for investigating the properties of the interface. The magnetism and local area structure can then be determined through hyperfine interactions (hyperfine mag-netic field and electric field gradient) using Mo¨ssbauer spectroscopy and time differential perturbed angular corre-lation (TDPAC) spectroscopy. The purpose of this research is to investigate the surface and interface of an evaporated Fe film microscopically using the111Cd( 111In) TDPAC.
It is thought that the magnetic moment at the surface of a ferromagnetic metal in vacuum is larger than the magnetic moment inside the crystal at low temperatures.1) It is concluded from theoretical calculations that the magnet-ization of the ground state (T ¼0) increases at the surface of a magnetic metal such as Ni and Fe.
In previous work, the surface of Fe has been investigated by57Fe Mo¨ssbauer spectroscopy,2)wherein an57Fe layer was
evaporated on the surface of a56Fe layer for57Fe Mo¨ssbauer
spectroscopy. The dead-layer model has been proposed.2) In order to confirm this experimentally, the hyperfine fields of an ultra-thin Fe film (4 atomic layers thick) placed between Ag layers were measured using Mo¨ssbauer spectroscopy.3,4) The results showed that the hyperfine field is larger at the center of the Fe layer than at the interface at room temperature, and the hyperfine field is larger at the interface
of the Fe layer than at the center at low temperatures under about 170 K.3)
In order to study the properties of the selected layers in detail, the quantity of the atomic probes needs to be very small. If the quantity of atomic probes is much, we will get the nature of global film. If 57Co is evaporated instead of 57Fe, it is possible to carry out measurements with very small
quantities of the probe. However, this is a difficult experi-ment, because of the long half-life of radioactive57Co. The
half-life of57Co is 271 days. On the other hand, the lifetime
of 111In is 2.8 days, and it is easy to use 111In for the
experiments.
Some multilayer films sandwiched between non-magnetic and magnetic layers show giant magnetoresistance. Such films are expected to be used in sensors or as recording head materials. For these, a small difference in magnetic field is converted into an electric signal. It is a major technological hurdle to translate a minute magnetic field change to a large resistance change at room temperature. For improvements and further development of these multilayered films, we need to investigate and understand the magnetism of a layer in detail. The method of evaporation of111In, in amounts of less
than 1 monolayer, can introduce 111Cd probe atoms at a
particular position in a film (an interface or a shallow position in a non-magnetic layer,etc.) and the hyperfine interactions of the probe nucleus can clarify the physical properties of the particular position.
2. Experimental Procedure
A very small quantity of111In was introduced into an Fe film as described below. Fe was first evaporated using an electron beam evaporation method. Then,111In was evapo-rated using a resistance heating method. Thus, a Fe/111In/Fe sandwich film was formed. All the experiments were
*Graduate Student, Osaka University
performed at the Toyonaka Annex to the Osaka University Radioisotope Center.
We extracted111In from a carrier-free111In HCl solution.
The reason for this is that Cl atoms have an adverse influence on TDPAC spectra. Half of the111In HCl solution (74 MBq,
1 mL, Nihon Medi-Physics) was dropped on a Tungusten boat (SF-156W, Nilaco). This 111In HCl solution contains 111In (about4:21013 atoms per 1 mL) and Cd impurities
(110Cd, 111Cd, etc.; less than about 1:11016 atoms per
1 mL) at the time of delivery as a result of the production process. The111In HCl solution was dried to111InClxusing infrared light. The W boat with 111InClx was covered with another W boat facing each other. Both ends of the W boats were attached using Pt wire. We placed the boats in an atmosphere of Ar + 7% H2 (purity of Ar: 99.99%, H2:
99.9%) after forming a vacuum in the silica tube containing the W boats. The boats were heated to 873 K using an infrared image furnace. The temperature was raised for 30 min and was then maintained at the specified temperature for 5 min.111In and111InCl
xmelt at 873 K (the melting point of InCl: 498 K, InCl2: 508 K, InCl3: 859 K, In: 430 K,
sublimation point of InCl3: 859 K). 111In remained on the
upper W boat since In tends to wet W. Cl2 from 111InClx flowed with the Ar + 7% H2gas to the gas flow outlet. After
heating, the radioactivity of111In and111InCl
xon the W boats were measured from a distance of 5 cm using a-ray Geiger-Muller (GM) survey meter (TGS-133, Aloka). The radio-activity of the111In on the upper W boat and the radioactivity of the111InClxon the W boat on the lower side measured by the GM tube was about 0.1–0.2 MBq, respectively. However, this is a referential value, since the GM tube is only able to calculate hundreds of Bqs precisely for its dead time. The remaining111In and111InCl
xwere found on the silica tube. Polyimide/Fe 50.0(1) nm/111In/Fe x nm/Ag 20.0(1) nm
(x¼0:2ð1Þ;0:3ð1Þ;1:0ð1Þ;3:0ð1Þ;5:0ð1Þ;10:0ð1Þ) multilay-ers, which were used in this study, were prepared using the following evaporation conditions. The purities of Fe and Ag were 99.999% and 99.999%. The Fe and Ag ingots were placed in copper crucibles, which were cooled with water. A carbon crucible liner was set between the copper crucible and Ag. A high vacuum was maintained using a turbo-molecular pump and a liquid N2trap. The vacuum at the time of sample
production was 1105Pa, and the evaporation rate in vacuum was 0.2 nm/s. The emission current of the electron beam ranged from 20 to 30 mA. 50 nm of Fe was evaporated on a polyimide (Kapton film) substrate using the electron beam vacuum evaporation apparatus. The evaporated films are supposed to be polycrystalline with included vacancies, dislocations and grain boundaries because the substrate is polyimide. However, the results of the experiment do not change even if better quality films with fewer defects are made using a different substrate (e.g.MgO(100) substrate). We monitored the thickness of a layer with a thickness gauge using the traditional quartz vibrator method. 111In was
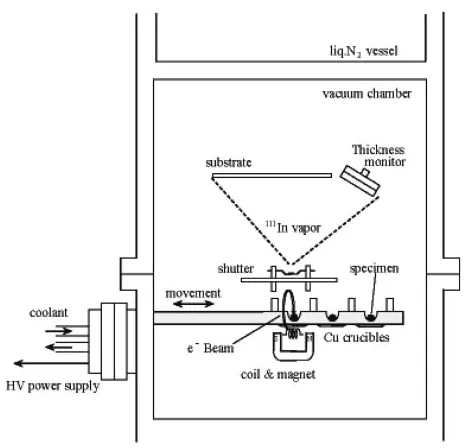
evaporated using a handmade resistance heating apparatus on the shutter for electron beam evaporation (Fig. 1). 80 A of electric current was passed through the W boat for 10 min. We continued to maintain a vacuum during the evaporation processes. The evaporated 111In layer was too small to measure using a thickness gauge. After taking a sample out
from the chamber, it was measured using a-ray GM survey meter to estimate the amount of111In. The radioactivity of the
evaporated film (69cm2) was about 1.6–2.4 kBq as
determined using a -ray GM survey meter located at a
distance of 5 cm from the films. The111In was calculated to be approximately 7:4108–1:1106 atoms/nm2. Cd was less than approximately1:1104–1:7103 atoms/
nm2. Therefore, the 111In probes and the Cd impurities are
present in very small quantities and are completely less than a monolayer to detect the local states. Next, we evaporated
xnm of Fe and 20 nm of Ag using an electron beam
evaporation method. Ag is used as a cap layer. In the same way, we made other evaporated films: polyimide/Fe 50.0(1) nm/Agxnm/111In/Ag 20.0(1) nm (x¼0;0:2ð1Þ;1:0ð1Þ).
At room temperature, all TDPAC measurements were performed without the application of an external magnetic field. The films were cut and divided into55mm2squares, and set parallel to the detector plane. However, in the case of the TDPAC measurement at 22 K, performed using a He gas cryostat, the film was placed perpendicular to the detector plane and an external magnetic field was applied (0.25(1) T) using permanent magnets (NEOMAX, height: 5 mm, diam-eter: 6 mm).
We measured TDPAC of polyimide/Fe 50.0(1)/111In/Fe
xnm/Ag 20.0(1) nm (x¼3:0ð1Þ;10:0ð1Þ) after annealing at 473 and 673 K for 30 min using a Gold image furnace in an atmosphere of Ar + 7%H2. We also prepared the
follow-ing films and measured TDPAC: polyimide/Fe 50.0(1)/
111InCl
x/Fe 10.0(1) nm/Ag 20.0(1) nm, and polyimide/Fe 50.0(1)/O/111In/Fe 10.0(1) nm/Ag 20.0(1) nm. In addition,
we also prepared and measured TDPAC from bulk Fe con-taining isolated111In probe atoms using an arc furnace.
The111Cd( 111In) isotope is the best known nucleus for
TDPAC measurements in materials science5) and has a
suitable half-life at an intermediate state of t1=2¼85:0ns.
TDPAC measurements were performed with the well-known
Fig. 1 Schematic illustration of the electron beam vacuum evaporation apparatus, as well as the resistance heating apparatus on the shutter for
[image:2.595.310.542.68.292.2]171.3–245.4 keV – cascade, successively emitted from
111Cd, using a conventional four-detector arrangement in a
plane with 90 degree angular separations. Photomultiplier tubes (XP2020Q, Phillips) mounted BaF2scintillators
(cylin-der form with diameter 1.5 inch, height 1 inch, OKEN) were used.
3. Results and Discussion
TDPAC measurements were performed at room temper-ature using a four-detector measurement arrangement. We can obtain the perturbation functionRðtÞusing the following equation, from eight time spectra,Ci j.
RðtÞ ¼2 ðC13C24C31C42Þ
1=4 ðC
14C23C41C32Þ1=4 ðC13C24C31C42Þ1=4þ2ðC14C23C41C32Þ1=4
ð1Þ
C13;C24;C31;C42 are the time spectra of the angular
cor-relations obtained with the counter set at 180. C
14;
C23;C41;C32 are the time spectra of the angular correlation
that are obtained at 90. When there is a magnetic field vertical to the plane including the sample and the detectors, the left side of eq. (1) is given as follows:
RðtÞ ¼a0þa1cosð2!LtÞ ð2Þ
Here, a0 and a1 are coefficients, and !L is a Larmor
frequency. If the directions of the magnetic moment are random, such as in a powder pattern, eq. (1) becomes:
RðtÞ ¼a0þa1cosð!LtÞ þa1cosð2!LtÞ ð3Þ
If we suppose that the Larmor frequency has a Gaussian distribution, eqs. (2) and (3) become:
RðtÞ ¼a0þa1expðð2!LtÞ2Þcosð2!LtÞ ð4Þ
RðtÞ ¼a0þa1expðð!LtÞ2Þcosð!LtÞ
þa1expðð2!LtÞ2Þcosð2!LtÞ ð5Þ
Here, a0 and a1 are coefficients, and expðð!LtÞ2Þ is the damping factor when!Lis the Gaussian distribution.
If a perturbation is due to a quadrupole interaction, and the spin of the intermediate state is 5/2, then:
RðtÞ ¼a0þa1expðð!1tÞ2Þcos!1t
þa2expðð!2tÞ2Þcos!2t
þa3expðfð!1þ!2Þtg2Þcosð!1þ!2Þt ð6Þ
Here,a0,a1,a2anda3are coefficients,!1and!2are related
to the quadrupole frequencies, andexpðð!ntÞ2Þexpresses damping when!n is the Gaussian distribution. In this paper, we do not discuss the electric field gradient and details of the theory regarding the electric field gradient are given in another paper.5)
The TDPAC spectra of Fe/Ag containing 111In in an Fe
layer can be fitted to a pure magnetic interaction pattern expressed by eq. (5), and the spectra of Fe/Ag containing
111In at the interface. Similarly, the spectra in an Ag film can
be fitted to a pure electric quadrupole interaction pattern, which is expressed by eq. (6). The spectra were fit by one kind of Larmor frequency, and this means that there is a predominant component in the observed spectra. We can satisfactorily obtain the value of the hyperfine magnetic field
except for the influence of the electric field gradient that appeared until about 10 ns in the PAC spectra [Figs. 2(a), (b), (c), (d), 3(a), (b), (c)]. The spectrum of the Fe/Ag film measured at 22 K was fitted using eq. (4) that contains only 2 times the Larmor frequency, because the magnetic moments are aligned by the external magnetic field which is perpen-dicular to the 4 detector plane. The spectrum of isolated111In
in the bulk Fe was fitted using eq. (5).
The Larmor frequency,!L, is proportional to a hyperfine magnetic fieldHas given below:
!L ¼ gNNH
h ð7Þ
Here,gNis a g-factor (0:306for111Cd), andNis a nuclear magneton.
We can consider the PAC spectra of polyimide/Fe 50 nm/
111In/Fe x nm/Ag 20 nm (x¼0:2;0:3;1;3;5;10) together
with the power spectra, Fourier-transformed using a max-imum entropy method (Figs. 2, 3). As 111In is introduced close to the interface, the intensity of the PAC spectrum is weak. This is because of an electric field gradient and the
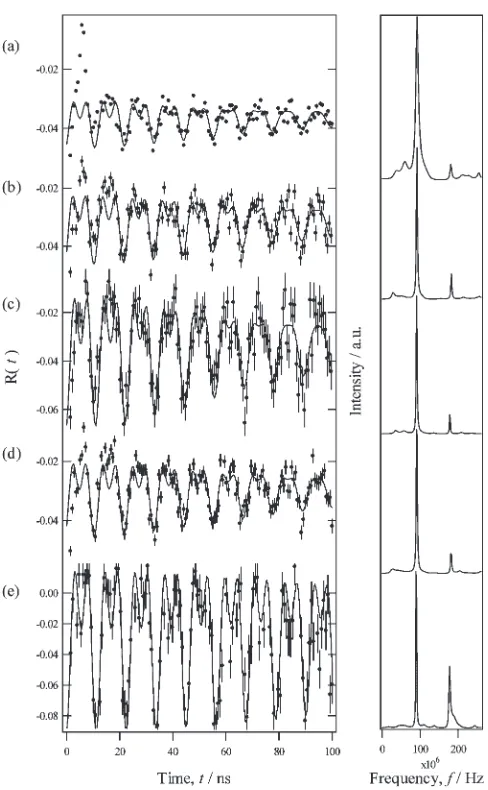
Fig. 2 TDPAC spectra at room temperature of polyimide/Fe 50.0(1) nm/
111In/Fe x nm/Ag 20.0(1) nm. (a) x¼1:0ð1Þ, (b) x¼3:0ð1Þ, (c) x¼
5:0ð1Þ, (d)x¼10:0ð1Þ, (e)111In in the Fe bulk. The solid lines are the
[image:3.595.305.549.66.461.2]influence of the turbulent Fe/Ag interface. When there are various 111In sites, the spectrum is the sum of the cosine
curves of the various frequencies, and the intensity of the spectrum decreases. An Fe layer and a Ag layer form the interface, and slight atom mixing at the interface might occur. Also, lattice strains are induced in the crystal structure since the Cd atom has a larger atomic size and the lattice constants of Fe and Ag are different.
We now consider the PAC spectra of samples containing
111In at a deep location in relation to the Fe/Ag interface
(Fig. 2). These are the samples containing 111In in the Fe layers at 1, 3, 5, and 10 nm from the Fe/Ag interface. When compared to the PAC spectrum of the111In isolated in bulk Fe, they show the same trend as the spectrum for111In in the
bulk. In these spectra, the component of a Larmor frequency and the component of 2 times the Larmor frequency are shown. This indicates that the directions of the magnetic moments of Fe are isotropic and random in the detector plane. Generally, the angular distribution of 171.3 keV-ray (1) and 245.4 keV -ray (2) is twice symmetrical with
respect to the rotation axis of an atomic nucleus.5)At room temperature, the films are parallel to the detector plane. When the magnetic moment of Fe is vertical with respect to the film plane, the frequency of a PAC spectrum is only twice the Larmor frequency. However, when the magnetic moments of Fe are parallel to the detector plane, the frequency of a PAC spectrum becomes a Larmor frequency.
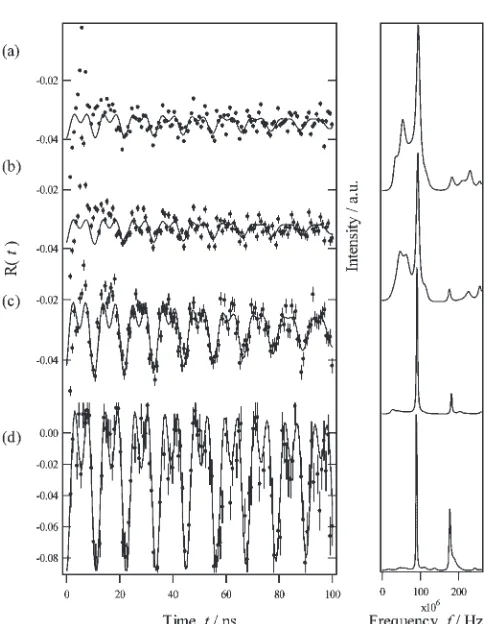
Next, we consider the PAC spectrum of the sample with
small amounts of 111In located very close to the Fe/Ag interface at positions of 0.2 and 0.3 nm from the interface (Fig. 3). These PAC spectra are compared with the PAC
spectrum of 111In at a position 10 nm from the Fe/Ag
interface and the PAC spectrum of 111In in the bulk. The
comparison shows that these trends are different. The components of 2 times the Larmor frequency and the Larmor frequency are shown in the spectra of the bulk and the 10 nm location. On the other hand, the component of 2 times the Larmor frequency is extremely weak in the PAC spectrum of
111In very close to the interface, although the component of
the Larmor frequency is shown. This indicates that the direction of the hyperfine magnetic field close to an interface with111In is parallel to the film plane. The reason for this has been described in the previous paragraph. On the other hand, it was indicated in ref. 1 that the magnetic moment of Fe at an Fe/Ag interface is perpendicular to the film plane. This difference depends on the fact that an In atom is large in comparison with an Fe atom. The ion radius of Fe, In and Ag is 0.127, 0.166 and 0.145 nm, respectively.6)In other words, the Fe/Ag interface is different from the Fe/In/Ag interface, even though111In is present in a very small amount, less than
a monolayer. The low frequency component is thought to correspond to the component of an electric field gradient. The high frequency components, other than the Larmor frequen-cies, depend on mechanical noise. This noise is common to other spectra as well.
The hyperfine magnetic field as a function of the distance from the Fe/Ag interface is shown in Fig. 4. Hyperfine fields of 111In are slightly larger in the Fe film with111In 0.2 nm from the interface than in the bulk Fe. From the results of fitting the spectra (Figs. 2, 3) in the range of 20–100 ns to minimize the influence of the electric field gradient and mechanical noise, the hyperfine fields of111In in the Fe film
0.2 nm from the interface is calculated to be 38.9(3) T and the hyperfine field of111In in the bulk Fe is 38.0(1) T.
Mo¨ssbauer spectroscopy of the Fe/Ag film was carried out in a previous study.1)This is the experiment that measured the Mo¨ssbauer spectra of Fe/Ag film at a low temperature, using a57Fe layer as the probe. The hyperfine magnetic field
even in the present study became large near the Fe/Ag interface. However, the previous study was performed at a low temperature, therefore a direct comparison is not possible. Freeman has reported a theoretical study in a Fe/ Ag film at a low temperature.7–9)A hyperfine magnetic field becomes large at the interface of the Fe/Ag film at a low
Fig. 3 TDPAC spectra at room temperature of polyimide/Fe 50.0(1) nm/
111In/Fe x nm/Ag 20.0(1) nm, (a) x¼0:2ð1Þ, (b) x¼0:3ð1Þ, (c) x¼
10:0ð1Þ, (d)111In in the Fe bulk. The solid lines are the fitting curves. The
figures on the right are their frequency spectra.
Fig. 4 Hyperfine fields of polyimide/Fe 50.0(1) nm/111In/Fe x nm/Ag
[image:4.595.47.291.62.374.2] [image:4.595.310.542.640.747.2]temperature. However, it is thought3) that a hyperfine magnetic field becomes small at room temperature. When the temperature is high, the exchange field fluctuates. An Fe– Ag interface containing In is different from the Fe–Ag interface since In is larger than Fe. If a Fe/Ag film is measured at a low temperature, we can examine the consistency of the experimental results at a low temperature compared to past theoretical and experimental studies. However, there have been only few measurements at low temperatures thus far.
In the present study, we performed measurements at 22 K (Fig. 5). A film was placed vertical to the detector plane and an external magnetic field (0.25(1) T) was applied in parallel to the film. The reason for applying an external magnetic field is that only the 2 times Larmor frequency component can be observed. The frequency became large because of the measurement at low temperature. The hyperfine field is 40.7(6) T as calculated from the results of fitting and subtracting the external magnetic field. For comparison, the hyperfine field at room temperature is 38.3(2) T.
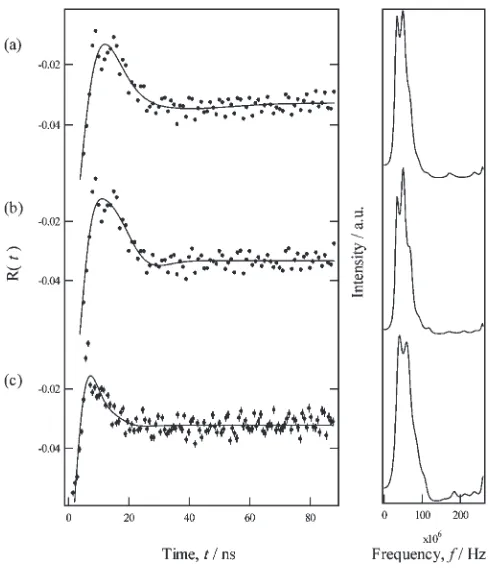
We now consider the TDPAC spectra of the sample containing 111In at the Fe/Ag interface and the sample containing111In in the Ag layer (Fig. 6). The component of the Larmor frequency due to the hyperfine magnetic field from Fe is not clearly seen in these spectra. Only the low frequency component due to the electric field gradient can be seen. From this result, it can be concluded that there is no influence of the hyperfine magnetic field derived from Fe at the Fe/Ag interface and in the Ag layer.
The TDPAC was also measured after the evaporated film was annealed at 473 and 673 K for 30 m in a Gold image furnace in an atmosphere of Ar + 7%H2. When films are
produced, the temperature of the substrate is maintained at room temperature. Therefore, some defects and dislocations are present in them. The decrease in the amplitude in the PAC spectra became small after the film was annealed. This suggests that some defects and dislocations were removed after the annealing treatment. Prior to annealing, there are
various states of 111In depending on the defects and
dislocations present. Thus, the distribution of the frequencies is broad in the frequency spectra. As a result of annealing, some defects and dislocations decreased, and the number of the states of 111In decreased. However, the state does not
change much by annealing after evaporation.
4. Conclusions
We produced an evaporated thin film of polyimide/Fe 50 nm/111In/Fe x nm/Ag 20 nm (x¼0;0:2;0:3;1;3;5;10
nm etc.). The amplitude of a PAC spectrum became weak with the introduction of 111In close to the interface. This is due to the fact that the interface is turbulent. On the other hand, hyperfine fields are slightly larger for 111In in the Fe bulk (38.0(1) T) to 111In 0.2 nm from the interface (38.9(3) T). The component of the Larmor frequency due to the hyperfine magnetic field from Fe is not seen clearly in the spectra of the sample containing111In at the Fe/Ag interface
and the sample containing111In in the Ag layer.
Acknowledgements
This work was supported by a Grant-in-Aid for Scientific Research on Priority Area (B-12130205) and a Grant-in-Aid for Scientific Research (C) 17540326, from the Ministry of Education, Culture, Sports, Science and Technology of Japan.
Fig. 5 TDPAC spectra of polyimide/Fe 50.0(1) nm/111In/Fe 3.0(1) nm/
Ag 20.0(1) nm measured at (a) 22 K with an external applied magnetic field of 0.25(1) T, and (b) room temperature. The solid lines are the fitting curves. The figures on the right are their frequency spectra.
Fig. 6 TDPAC spectra at room temperature of polyimide/Fe 50.0(1) nm/ Agxnm/111In/Ag 20.0(1) nm (a)x¼1:0ð1Þ, (b)x¼0:2ð1Þ, (c)x¼0.
[image:5.595.48.292.68.248.2] [image:5.595.304.549.69.353.2]REFERENCES
1) S. Ohnishi, M. Weinert and A. J. Freeman: Phys. Rev. B30(1984) 36– 43.
2) T. Shinjo: Surf. Sci. Rep.12(1991) 49–98.
3) G. Lugert and G. Bayreuther: Phys. Rev. B38(1988) 11068–11074. 4) G. Bayreuther and G. Lugert: J. Magn. Magn. Mater.35(1983) 50–52. 5) H. Frauenfelder and R. M. Steffen:In Alpha-, Beta- and Gamma-Ray Spectroscopy2, (ed. K. Siegbahan), (North-Holland, Amsterdam, 1965)
pp. 997–1198.
6) C. Kittel:Introduction to Solid State Physics, 7/th Edition, (John Wiley & Sons, Inc., New York, 1996) pp. 78–79.
7) S. Ohnishi, A. J. Freeman and M. Weinert: Phys. Rev. B28(1983) 6741–6748.
8) E. Wimmer, A. J. Freeman and H. Krakauer: Phys. Rev. B30(1984) 3113–3123.