Dissimilar Friction Stir Welded Joints between 2024-T3 Aluminum Alloy
and AZ31 Magnesium Alloy
Saad Ahmed Khodir
*and Toshiya Shibayanagi
Joining and Welding Research Institute, Osaka University, Ibaraki 567-0047, Japan
Dissimilar alloys such as 2024-T3 Al alloy and AZ31 Mg alloy of plates in 3 mm thickness has been friction stir butt welded. The welding was carried out at a constant rotation speed of 2500 min 1and welding speeds of 200, 300, 400 and 550 mm/min. Effects of welding speeds on
microstructures and hardness distributions of the joints were investigated. Distribution of phases in the stir zone (SZ) was analyzed by a scanning electron microscope (SEM) equipped with an energy dispersive X-ray spectroscopy (EDS).
Increasing welding speed brought about a redistribution of phases in SZ where the regions occupied by 2024 Al alloy concentrated in the lower portion of SZ while AZ31 Mg alloy concentrated in the upper region beneath the tool shoulder. The laminated structure was formed in the SZ near the boundary between SZ and TMAZ on the advancing side of 2024 Al alloy regardless of the welding speed. The hardness value fluctuates in the SZ due to formation of intermetallic compounds that formed by constitutional liquation during welding.
[doi:10.2320/matertrans.MRA2007093]
(Received May 1, 2007; Accepted July 5, 2007; Published August 22, 2007)
Keywords: 2024-T3 aluminum alloy, AZ31 magnesium alloy, friction stir butt welding, welding speed, scanning electron microscope (SEM)-energy dispersive X-ray Spectroscopy (EDS) method, hardness distributions
1. Introduction
Dissimilar joints between aluminum and magnesium alloys would be required in the future for transportation application to increase the possibilities for flexible design and get the benefits from each material in a functional way. Formation of brittle intermetallic compounds such as Al2Mg3, Al12Mg17 and Al30Mg23 has long inhibited the use
of fusion welding processes for joining these dissimilar joints.1)Over the last decade, friction stir welding (FSW) has
offered excellent welding quality to the joining of similar aluminum2,3) and magnesium alloys.4)FSW is a solid state
welding process which was invented at The Welding Institute (UK) in 1991,5)and has been applied to lots of commercial
production in a number of applications.5,6)
FSW joint is known to generally possess four zones such as intensively deformed zone called stir zone (SZ), thermome-chanically affected zone (TMAZ), heat affected zone (HAZ), and non-affected base metal (BM).7) Concerning FSW of dissimilar joints between aluminum to magnesium alloys, there is no information about dissimilar joining of 2024 aluminum alloy to AZ31 magnesium alloy; although a number of studies reported on dissimilar joining between other aluminum alloys and AZ31 magnesium alloy.8–12)
According to these studies, Al12Mg17 intermetallic
com-pound also formed in the weld zone as a result of constitu-tional melting due to higher temperature achieved during FSW. Since Al12Mg17 phase formed at a lower temperature
such as 733 K, it would be rather difficult to avoid the formation of intermetallic compound in the SZ during FSW. Although, some intermetallic phases such as Al3Mg2and
Al12Mg17were formed in SZ, Hiranoet al.11)and R. Zettler12)
obtained a high quality dissimilar FSW joints of aluminum and magnesium alloys. Their result encourages the possibil-ity of applying FSW to the jointing of dissimilar aluminum to magnesium alloys. The present study aims to investigate the
effect of welding speed on microstructure and hardness distribution in dissimilar FSW joints of 2024-T3 aluminum and AZ31 magnesium alloys.
2. Experimental Procedures
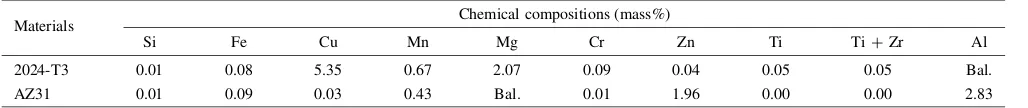
Dissimilar 2024-T3 aluminum alloy and AZ31 magnesium alloy of 3 mm thick plates were friction stir butt welded using a tool made of a tool steel (SKD61). The welding tool is composed of 12 mm diameter shoulder and 4 mm diameter threaded probe. Figure 1 shows the schematic illustration of the tool. The tool axis was tilted by 3 degrees backward with respect to the vertical axis. After fixing (clamping) the specimens on a rigid back plate of the FWS machine, the FSW tool was slowly pushed into the abutting surfaces of specimens to a 3 mm plunge depth. The probe depth and its vertical accurate position were controlled manually by using vertical computerized motor instead of the vertical force because of the limitation of the facility of FSW welding machine. The probe depth was constant for all joints. The chemical composition of base metals is listed in Table 1. Rotation speed was kept constant at 2500 min 1and welding speeds were set at 200, 300, 400 and 550 mm/min. 2024-T3 aluminum alloy plate was located on the advancing side. Changing the fixed location of two alloys led to failure in the dissimilar FSW joints. The chemical composition of base
Fig. 1 Welding tool.
*PhD Student, Joining and Welding Research Institute, Osaka University
[image:1.595.312.541.666.769.2]metals is listed in Table 1. Rotation speed was kept constant at 2500 min 1 and welding speeds were set at 200, 300, 400
and 550 mm/min. 2024-T3 aluminum alloy plate was located on the advancing side.
Specimens for macro and micro-structural observations were machined from the welded plates. The observation was performed on a cross-section in the weld region after mechanical polishing using emery papers (up to grade # 4000) followed by polishing using an oil suspension containing diamond particles with 0.25mm in diameter. Firstly, surface of specimens was chemically etched by an etchant containing 1 gm picric acid, 33 mL ethanol (95%), 2.5 mL acetic acid and 5 mL H2O, then 2024-T3 aluminum
side was etched by a swabbing method using cotton containing Keller’s reagent (1 mL HF, 1.5 mL HCl, 2.5 mL HNO3, and 95 mL H2O). Microstructure of the weld joints
was observed with an optical microscope. The distributions of the constituents of two base alloys in SZ was analyzed by a scanning electron microscope (SEM) equipped with an energy dispersive X-ray spectroscopy (EDS).
Microhardness measurement was carried out along a mid-thick line on the cross section that is transversal to the welding direction with an internal spacing of 0.5 mm under a constant load of 0.98 N for 15 s of loading time.
3. Results and Discussion
3.1 Macrostructure of joints
Figure 2 shows macroscopic appearances of the cross-section of the dissimilar joints produced at different welding speeds. 2024 Al alloy and AZ31 Mg alloy were set on the advancing and retreating sides, respectively. All joints are free from defects such as porosity and tunnel like pores, while kissing bond was observed in the bottom region for all welding speeds.
The SZ comprises of three regions with different contrast such as grey, dark grey and bright. As shown in Fig. 2(a), (b) the bright region tended to exist mainly in SZ on the retreating side, while middle portion of SZ near the advancing side is occupied by grey or dark grey regions. Increasing welding speed more than 300 mm/min changed the location of bright contrast region structure to the lower portion of SZ near the bottom surface as shown in Fig. 2(c) and (d). Also, increasing welding speed more then 300 mm/ min brought about the change in location of the grey and dark grey regions to the upper portion of SZ beneath the tool shoulder as shown in (c) and (d). The bright and dark grey regions corresponded to 2024-T3 Al alloy and AZ31 Mg alloy, respectively while grey region corresponding to a mixture of them. The position changes of these structures in SZ may be attributed to the alternation of metal flow that depends on the welding speed. Since Mg alloys have inferior
formability to Al alloys, increasing welding speed or decreasing heat input makes Mg alloy related region less mobile around the probe, and eventually the region come to concentrate in the hotter region which locates under the tool shoulder.
The nugget decreased its size and became rounder shape with higher welding speed. A lamellar-like bands where either 2024 Al alloy related region or AZ31 Mg alloy is lying one on another. This laminated structure is observed in SZ near the boundary between SZ and TMAZ of 2024 Al alloy on the advancing side. Formation of the laminated structure near 2024 Al alloy side occurred more frequently than Mg alloy side, and this may be attributed to the relation between welding direction and tangential component of rotation of the welding tool. The directions of welding and rotation are the same on the advancing side, while they are in opposite on the retreating side. Thus steeper gradient of plastic strain caused by the severer deformation in addition to the different deformability of Al alloy than Mg alloy resulted in the formation of laminated structure on the advancing side.
These macrostructural features in nugget suggest that welding speed should be on important factor affecting the evolution process of microstructure in dissimilar joints produced by FSW.
3.2 Microstructure of joints
Figure 3 represents an example of typical microstructures observed in the joint welded at a welding speed of 400 mm/ min, which corresponds to locations in Fig. 2(c). The microstructure of 2024 Al alloy BM is shown in Fig. 3(a), representing elongated grains along the rolling direction with a random distribution of second phase particles recognized as small black particles. The compositions of these particles were reported as CuMgAl2, Cu2MnAl20, and Cu2FeAl7.13)
[image:2.595.46.560.85.139.2]These grains with several hundred microns long and approximately 40–70mmwide are lying along the transversal direction that is normal to the welding direction. Figure 3(b) represents a microstructure of TMAZ and laminated bands in SZ on the advancing side of 2024 Al alloy. The grain size in TMAZ is almost the same as that in BM and the grains were bended by about 45 degrees indicating the severe plastic deformation in this region. However, no recrystallization occurred in this region. On the other hand, there is a sharp transition between the laminated bands in which Al or Mg alloy strips in the vortex and swirl penetrates into each other. Figure 3(c) shows a microstructure of SZ where grey and slightly dark grey regions are observed. The grey region consists of grains with irregular shape. This region includes some small fragments probably coming from Mg alloy side where fine grain structure is represented in the right part of Fig. 3(c). The slightly dark grey region in the left part of Fig. 3(c) consists of equiaxed grains with much smaller size
Table 1 Chemical composition of base metals.
Materials Chemical compositions (mass%)
Si Fe Cu Mn Mg Cr Zn Ti Ti + Zr Al
compared to those in BMs on both sides. The size of recrystallized grains in this area ranges from 3 to 6.7mm, and these grains belong to AZ31 Mg alloy.
Figure 3(d) represents the microstructure of TMAZ on AZ31 Mg alloy side in the joint. No deformation structure such as twins and elongated grains was observed. The grains
are also equiaxed and recrystallized having a size equal to that in the SZ. This results is consistent with the report by N. Afrin14) on similar FSW of Mg alloy. These features in microstructure are considered to be different from the cases of other similar FSW of Mg alloys15,16)as well as most of the Al alloys where the TMAZ was characterized by bended and
Fig. 2 Macrostructures of joints welded at different welding speeds where 2024-T3 fixed at advancing side: (a) 200, (b) 300, (c): 400, and (d) 550 mm/min.
[image:3.595.84.511.70.400.2] [image:3.595.83.512.451.678.2]elongated grains as in the TMAZ of 2024 Al alloy side in the present study. The microstructures of HAZ and BM of AZ31 Mg alloy are shown in (e) and (f), respectively. These microstructures are composed of granular phase of Mg solid solution with remarkable number of deformation twins.
Grain sizes in SZ and TMAZ of Mg alloy side decrease with increasing welding speed due to decreasing heat input. The average grain size decreases from 8.2mm at 200 mm/ min to 4.4mmat 550 mm/min.
3.3 EDS analysis of joints
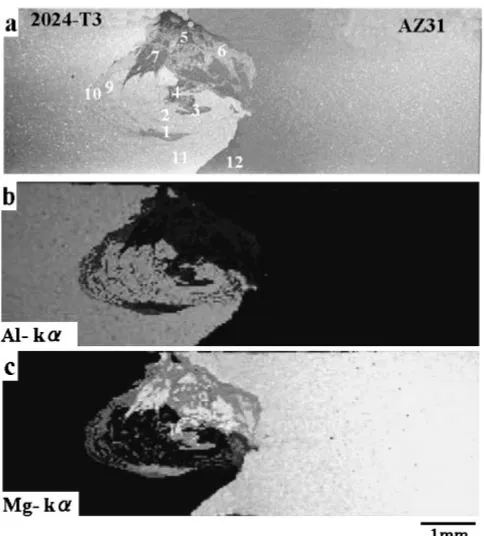
Figure 4 shows a result of SEM-EDS analysis for the joint welded at 550 mm/min. Three regions such as grey, slightly dark grey and dark grey having clearly different contrasts are observed by a back-scattered electron image (BEI) as shown in Fig. 4(a). The slightly dark grey and dark grey regions concentrated in the upper region of SZ. The corresponding X-ray images of Al-Kand Mg-Kare shown in (b) and (c), respectively. As shown in Fig. 4(b), Al is enriched in the lower region of SZ suggesting that this region is occupied by 2024 Al alloy. The brighter region in Fig. 4(c) at upper
[image:4.595.48.290.70.338.2]region of SZ was abundant of Mg while the darker ones were mainly rich with Mg. This result indicates that the region in the upper region of SZ is occupied by AZ31 Mg alloy.
Table 2 summarizes the results of EDS quantitative analysis for the mother and main alloying constituents such as Al, Mg, Cu, Zn and Mn in the two alloys. The measure-ment was carried out at several locations having different contrasts as indicated in Fig. 4(a). The mass percentages of Mg and Al at the positions 1, 3, 6, 9, and 10 were almost corresponding to the intermetallic compounds of Al2Mg3or
Al12Mg1712)observed in the SZ. These positions are located
in the microstructure having irregular shape which is shown in the upper region of Fig. 3(b). The positions 2, 8 and 11 were almost corresponding to 2024 Al alloy which is represented in brighter regions of Fig. 2. The concentrations of Mg and Zn at the positions 4, 5, 7 and 12 were close to those of AZ31 Mg alloy.
The effect of welding speed on the microstructure of weld joints is a heterogeneous distribution of elements in SZ. This could be attributed to the insufficient welding time required for completing diffusion of alloying elements in SZ. In addition, the results of SEM-EDS analysis clearly suggest that a localized region in SZ experienced constitutional liquation or melting during FSW which upon cooling solidifies to produce the intermetallic compound in SZ. This is consistent with the previous studies9,10,12) on FSW of dissimilar joints between other Al alloys and AZ31Mg alloy. The temperature in the SZ for all welding speeds might be higher than the melting points of eutectic reaction (733 K) occurred between Al and Mg in the binary phase diagram.
3.4 Hardness of joints
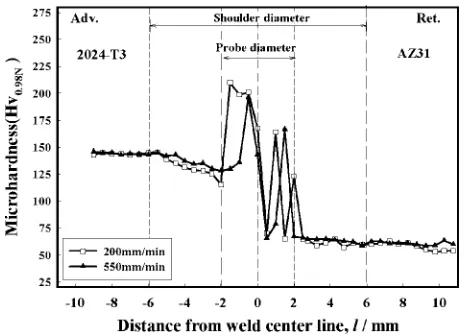
Figure 5 shows microhardness profiles of joints welded at 200 and 550 mm/min. The measurement was carried out across the nugget on the transversal cross-section normal to the welding directions. BMs of 2024 Al and AZ31 Mg alloys have average hardness values of 143 and 60 Hv, respectively. The hardness value in SZ varies from 65 to 220 Hv due to the presence of intermetallic compounds as well as Al and Mg phases. The lower hardness value of 65 Hv corresponds to the AZ31 region while the higher values from 140 to 220 Hv are caused by the intermetallic phases. No significant change in hardness distributions was observed in SZ between 200 and 550 mm/min of welding speed.
On the other hand, increasing welding speed has a significant influence on the hardness distribution in HAZ and TMAZ of 2024 Al alloy side but is less effective for AZ31 Mg alloy side. This is directly related to the fact that 2024-T3 Al alloy is age hardening alloy which is affected by
[image:4.595.50.548.693.784.2]Fig. 4 SEM and EDS images of joint welded at 550 mm/min of welding speed: (a) SEM image of weld joint, (b) EDS image of Al, and (c) EDS image of Mg.
Table 2 EDS quantitative analysis of regions corresponding to Fig. 4(a) for the welding speed of 550 mm/min.
Alloying Content/mass%
elements 1 2 3 4 5 6 7 8 9 10 11 12
Al 30.84 92.2 37.02 8.63 2.68 34.53 2.79 84.27 39.45 58.1 90.65 2.42 Mg 63 1.56 59.01 88.89 94.35 60.09 94.33 10.23 58.51 36.35 1.77 94.56
the thermal history during welding, while AZ31 Mg alloy is a solid solution. The slight increase in hardness by about 5 Hv in the regions in SZ occupied by Mg alloy and TMAZ on the AZ31 Mg alloy side could be attributed to the grain refinement in these regions. On the contrary, hardness in BM increases with decreasing grain size according to the Hall Petch equation.
4. Conclusions
Effect of welding speed on microstructures and hardness distributions of the friction stir welded dissimilar joints composed of 2024-T3 Al alloy and AZ31 Mg alloy were investigated and the following results were obtained;
(1) Increasing welding speed lead to redistributed phases in SZ where the regions occupied by 2024 Al alloy concentrated in the lower part of SZ, while AZ31 Mg alloy concentrated in the upper regions beneath the tool shoulder. The laminated structure was formed in the SZ near the boundary between SZ and TMAZ on the advancing side of 2024 Al alloy regardless of welding speed.
(2) SZ comprises of three main regions occupied by the microstructure of 2024 Al alloy, and AZ31 Mg alloy, and irregular structure containing of some fragments came from the Mg Alloy. Average grain size of microstructure occupied by Mg alloy in SZ and TMAZ decreased with increasing welding speed.
(3) The irregular-shaped regions and laminated structure in SZ contained large volume of intermetallic compounds
which were formed by constitutional liquation during welding.
(4) Increasing welding speed has a significant influence on the hardness distribution in HAZ and TMAZ of 2024 Al alloy on the advancing side but is less effective for AZ31 Mg alloy which is located on the retreating side. The hardness distribution in SZ is slightly effected by welding speed and the harness values varied from 65 to 220 Hv due to the presence of intermetallic compounds and microstructures occupied by either 2024 Al alloy or AZ31 Mg alloy.
Acknowledgements
This work was supported by a grant-in-aid for scientific research B (project No. 17360353) and a grant-in-aid for cooperative research project of nationwide joint-use Re-search Institutes on Development Base of Joining Technol-ogy for new Metallic Glasses and Inorganic Materials from The Ministry of Education, Science, Sports and Culture, Japan.
REFERENCES
1) R. Borrisutthekul, Y. Miyashita and Y. Mutoh: Sci. Technol. Advanc. Mater.6(2005) 199–204.
2) M. A. Sutton, B. Yang, A. P. Reynolds and J. Yan: Mater. Sci. Eng. A
364(2004) 66–74.
3) C. G. Rhodes, M. W. Mahoney, W. H. Bingel, R. A. Spurling and C. C. Bampton: Scripta Materialia36(1997) 69–75.
4) W. Xunhonga and W. Kuaishe: Mater. Sci. Eng. A431(2006) 114– 117.
5) C. J. Dawes and W. M. Thomas: Weld. J.75(1996) 41–45. 6) R. S. Mishra and Z. Y. Ma: Mater. Sci. Eng. R50(2005) 1–78. 7) S. A. Khodir, T. Shibayanagi and M. Naka: Mater. Trans.47(2006)
185–193.
8) A. C. Somasekharan and L. E. Murr: Mater. Characterization52(2004) 49–64.
9) Y. S. Sato, C. H. Seung, M. Michiuchi and H. Kokawa: Scripta Materialia50(2004) 1233–1236.
10) J. Yan, Z. Xu, Z. Li, L. Li and S. Yang: Scripta Materialia53(2005) 585–589.
11) S. Hirano, K. Okamoto, M. Doi, H. Okamura, M. Inagaki and Y. Aono: Quart. J. Japan Welding Society21(2003) 539.
12) R. Zettle: Advanced Eng. Mater.8(2006) 415–421.
13) American Society for metal,Metals Hand Book, Vol. 7, 8th Edition (1972) 246.
14) N. Afrin, D. L. Chen, X. Cao and M. Jahazi: Mater. Sci. Eng. A (2007), doi:10.1016/j.msea.2007.03.018.
15) J. A. Esparza, W. C. Davis, E. A. Trillo and L. E. Murr: J. Mater. Sci. Lett.21(2002) 917–920.
16) W. Xunhong and W. Kuaishe: Mater. Sci. Eng. A431(2006) 114–117. Fig. 5 Hardness distributions for the joints welded at 200 and 550 mm/min
[image:5.595.53.285.71.239.2]

![1,2 Bis[(1,3 benzodioxol 5 yl)methylidene]hydrazine](data:image/gif;base64,R0lGODlhAQABAIAAAP///wAAACH5BAEAAAAALAAAAAABAAEAAAICRAEAOw==)