TO THE STUDY OF LOW ANGLE DIFFRACTION
Thesis by
Warren Evald Danielson
In Partial Fulfillment of the Requirements for the Degree of
Doctor of Philosophy
California Institute of Technology Pasadena, California
It is a pleasure to express my sincere appreciation to Professor J. W. M. DuMond for the encouragement and sound advice he has so frequently given throughout the work described below. The lessons in careful experimentation which were learned through association with him are among the most valuable assets of my graduate years.
My sincere thanks are also due Leon Shenfil who shared equally in the design and construction of the point focusing monochromator.
He also helped considerably with the earlier latex work, and his analysis of the geometry of the instrument proved very useful in controlling its operation.
Finally I wish to thank my wife, Evalyn, for her confidence and patience throughout these busy years of graduate stuqy.
The geometry of the point focusing monochromator is described, and the instrument's uses in connection with low angle diffraction studies are outlined. A careful determination of the particle size of latex spheres by studies of the associated low angle diffraction pattern is made, and an experiment to determine the sensitivity of this particle size to external pressure is described. The results of an experiment in which the monochromator is used to obtain important information on the existence and nature of the collagen molecule are given. A technique for finding the size of particles whose shape is reasonably approximated by two spheroids is given, and the technique is applied to the size determination of bacteriophage type T-4. Improvements in the instrument are discussed and several suggestions for further applications are
Part I
II
III
Title THE POINT FOCUSING MONOCHROMATOR
Method for Obtaining Focused X Rays • . Size and Shape of the Focal Spot •
Position of Scattering Sample and Detector Resolution for Low Angle Scattering • • • • • Salient Physical Dimensions of the Instrument • Means for Detecting Scattered Radiation •
. . .
.
. .
. . .
.
.
. .
.
1 1 6 9 10 11 12 Use of Helium Gas Along the X-Ray Path •• 13 Particle Information Most Easily Obtained From LowAngle Diffraction Studies • • • • • • • • • .
16
DETERMINATION OF THE MEAN DIAMEI'ER OF LATEX SPHERESExperimental Data • • •
Interpretation of Data
.
.
.
.
.
. .
.
.
. .
.
Effect of Finite Size of Point FocusComparison of S~ples • • • • • • • •
.
. .
Use of Relative Intensities at Diffraction Peaks • • Conclusions • • • • • • • •.
.
.
. .
.
.
.
.
. .
.
. •
• EFF~T OF EXTERNAL PRESSURE ON THE SIZE OF LATEX SPHERESVacuum-Air Experiment • • •
.
.
.
.
.
.
. . .
.
Vacuum-Helium Experiment.
.
.
.
.
. .
.
.
.
• • • • Conclusions • • • • • • •.
.
.
. .
.
.
.
.
.
. .
. .
19
19
30 3640
45
46
48
49
56
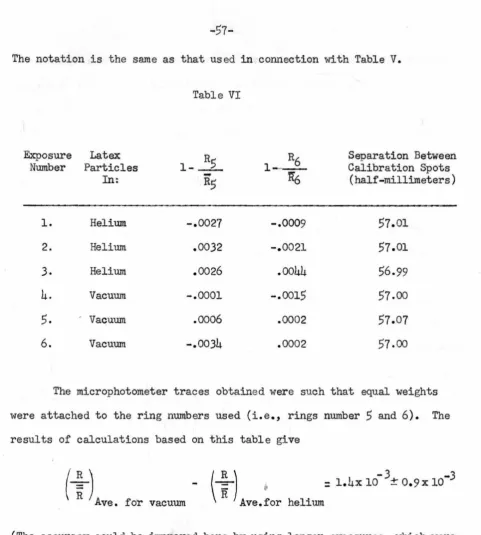
57
IV INVESTIGATION OF THE LCM ANGLE DIFFRACTION FROM ORIENTED
v
VI
Diffraction Pattern Obtained and its Interpretation • • 61 Conclusions • • • • • • • . • • . . . • • • • • • • 69 SCATTERING FROM IDENTICAL NONSPHERICAL PARTICLES RANDOMLY
ORIENTED, WITH APPLICATION TO BACTERIOPHAGE T-4 • • X-Ray Diffraction Pattern from Two Spheroids
. .
Application to Particle Size Determination of Type T-471
71
Bacteriophage • • • • • • • • • • • • • • • • • • •
76
Experimentally Obtained Diffraction Pattern ofBacteriophage T-4 • • • • • • • • • • • • • • IMPROVEMENTS IN THE POINT FOCUSING MONOCHROMATOR AND PROPOSALS FOR FURTHER APPLICATIONS • • • • • •
Intensity Improvements ••
. .
.
.
.
.
.
.
. .
.
.
.
.
.
.
Miscellaneous Improvements.
. .
. .
.
.
.
Proposals for Further Applications.
.
.
.
.
.
.
.
. .
References •.
.
. . .
.
.
.
.
.
.
.
.
.
.
.
.
.
.
.
..
80
84
84
90
Part I
THE POINT FOCUSING MONOCHROMATOR
The basic tool used in the studies to be described is the point
focusing monochromator, an instrument which was designed and built in Norman Bridge Laboratory. This instrument makes use of a method first
proposed by J. W. M. DUMond(l) whereby X rays may be brought anastigmat-ically to a point focus through the use of two elastically bent crystal
laminae. Since efficient operation of the instrument requires a
know-ledge of the way in which the converging monochromatic radiation is
ob-tained as well as a knowledge of the limitations placed on the instrument
by its physical construction, it is appropriate that its geometry and
design be considered at the outset. A fuller description than the one
given below can be found in the doctoral thesis of Leon Shenfil.(2) Method for Qbtaining Focused X Rays
The so-called "Bragg" reflection of X rays from crystals following the well known relation
n A ;;::: 2d sine
produces a reflected beam that is highly selective as regards the
wave-length reflected, but one that nevertheless retains, over a very narrow angular domain, almost the full intensity of that particular wavelength
in the incident radiation that is in resonance with the crystal lattice.
One would therefore expect such reflection to be of prime importance in
devising any system for focusing and monochromatizing an X-ray beam. It is well known(J) that a particular wavelength of the radiation from
bent crystal as shown in Fig. 1. The three requirements (l) that the
angle of incidence of the X rays with the crystal planes used be equal
to the angle of reflection, as required by the Bragg law, · (2') that this
angle be the same for all rays striking the crystal, as required for
monochromatization, and (3) that the rays converge to a line focus are
seen to be satisfied by a system in which source and focus lie on a
circle (the focal circle) defining the concave face of a cylindrically
bent crystal, the crystal reflecting 11planes11 being concentric circular
cylinders. The common axis of these cylinders is a line perpendicular to
the plane of the focal circle passing through a point, (3 , on that circle
midway between source and focus. Using the fact that an angle inscribed
in a circle is equal in radians to half of the intercepted arc, the
proof of the above statements is obvious. It is also easy to show that
the virtual source
..
for the radiation reflected at P is the point V onthe circle through the source S with (3 1 as center.
Since any portion of the crystal lamina shown in Fig. l causes
those rays which strike it at the appropriate angle to converge as
out-lined above, one can construct a line focusing monochromator, if desired,
by using just a portion of the crystal entirely to the left of the plane
of symmetry, (3(3 1
• For rays in the focal plane, the only difference be
-tween the arrangement just suggested and the same arrangement with source
and focal point interchanged is that in the latter case the
source-to-crystal distance is greater than the crystal-to-focus distance instead of
vice versa. Now suppose this latter (second) system is placed so that
its focal circle is in a plane normal to that of the first system and so
'
'
' '
...'
'
t::=
Z2J
BENDING(see Fig. 2). If, further, the central incident ray required for normal
(line focusing) operation of the second system is made coincident with
the central reflected ray of system one, and the distance between the
crystals as measured along this ray is made equal to the difference be
-tween the crystal-to-focus and source-to-crystal distances for either
system, then the compound system has anastigmatic point focusing
proper-ties. It is now clear that the reason for choosing an asymmetric crystal
position for the individual line focusing systems is to allow the crystals
to have a finite separation, as required physically, but still obtain an
anastigmatic focus.
It will be noticed that the discussion so far is based on the
assumption that the crystal faces coincide with arcs of their respective
focal circles. The construction of an instrument with crystals
conform-ing to this ideal geometry would require crystal laminae which were ground
or otherwise cut ,to cylindrical arcs ~ in the unstressed state. This
would comprise a difficult machining task since these surfaces would have
to be accurately cylindrical to within a few fringes of light. Because
of this difficulty, the point focusing monochromator as actually constructed
makes use of crystals which are plane laminae in the unstressed state.
When stressed and placed in its proper position, each lamina is tangent
to the focal circle (the point of tangency being the center of the concave
crystal surface), but the surface of the lamina does not coincide with
the focal circle over a finite arc, its radius instead being equal to the
diameter of the focal circle. Of course the crystal planes are not
parallel to the face of the unstressed lamina, but make a constant dihedral
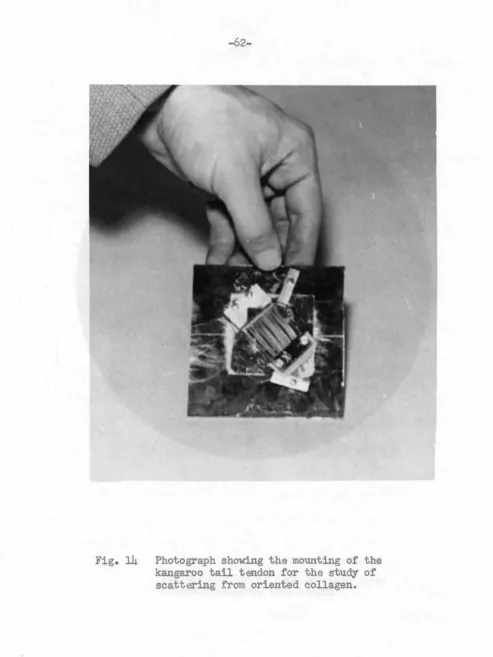
Fig, 2 Showing the 3-dimensiona.J. ge011tetr;y o£ the
the crystal center with the face of this lamina. This condition makes the crystal planes very nearly concentric about the 13 point as required.
Size and Shape of the Focal Spot
The task of predicting quantitatively the size and shape of the
focus obtained with a point focusing instrument of this type was accomplished by L. Shenfil. (2) The major results of this analysis will be given here since they give valuable infomation on the optimum operating conditions for the instrument. These results are qualitatively the same for the ideal system and the one actually employed, the most significant quanti-tative difference being given below. For either arrangement it is found that only radiation from certain points in an ideally placed broad X-ray source can pass the system by means of two successive Bragg reflections.
The projection of these useable points on a plane through the ideal source position (point S in Fig. 1) normal to the central beam turns out to be,
in fact, a diagonal strip inclined at about
45°
with the horizontal focal circle. The width of this strip depends only on(1)
the physical dimen-sions of those parts of the crystal laminae which receive X-radiation and on ( 2) whether or not the ideal system (wherein the crystals are ground prior to bending) is used. Using the physical dimensions of the present monochromator, the expected width of this useable strip is 0.2 mm (inexcellent agreement with experiment), while the expected width for the ideal case of crystals ground initially to a curve in the unstressed state is 0.1 mm.
to Fig. 2 will demonstrate the existence of such a strip and accurately
give its orientation as well:
Consider a point source,
s,
(not shown in Fig.2)
,
situated on agenerator of the first focal cylinder (but not necessarily in the
hori-zontal plane containing S and the centers of the two crystals), this
generator being displaced clockwise from the generator through
s
.
Nowjust as F1F1 (an arc of the horizontal circle about ;3' through S) is
the virtual source for the once reflected beam whose true source is
s,
so the corresponding arc, F1 F' , of the horizontal circle passing
1 1
through
s
1 with center on a vertical line through (3 1 is the virtualsource for the once reflected beam whose true source is
s
1• Furthermore,
the wavelength which crystal
A
can reflect by the Bragg law is propor-tional to sin 0 (see Bragg equation, p. 1), hence the wavelength to be
ascribed to any such virtual source depends only on the angular position
(along the focal circle) of the true source from the crystal. Hence,
since
s
1 was assumed to be displaced in a clockwise direction froms
,
thewavelength associated with arc Fl Fl and its radius of curvature are less
than the corresponding wavelength and radius of curvature, respectively,
of F1F1 •
Now in order for radiation from arc Fl
Fl
to be efficiently reflectedby crystal B, F1 F' must intersect the vertical focal circle at a point,
1 1
Q, so situated that the angle with which rays from this point strike
crys-tal B is equal to the Bragg angle for that particular wavelength
associ-ated with F:L F:L • Since a given displacement from F1F1 along the vertical
focal circle corresponds to the same wavelength change (in the radiation
reflected by crystal B) that occurs (in the radiation reflected by crystal
this last requirement can be met only if
s
1 is as far below the plane of the horizontal focal circle, ,13 S f3 1 , as is point Q.
Designating the angular arc from (3 1 to A (i.e., the center of
crystal A) by 2 0(, it follows that the projection of points satisfYing
this last requirement on a plane through S normal to SA
S whose angle with the horizontal is tan -l
=~~~ ~= ~
is a line through
• Thus for ot.
small in comparison to
e '
this angle is very nearly45°
.t its value forthe present instrmnent (Q ==
40.7°,
oc ==2
'
.1°)
being47.}
0 •By virtue of the symmetry of the entire system with respect to an
interchange between "point" focus and X ray source, it follows that this
focus (i.e., the locus of the points in which the converging beam
inter-sec'b a plane through PF normal to the central ray of this beam) is also
essentially a line inclined at
47.3°
with respect to the vertical focalplane. The breadth of this "line" is determined by the solid angle
sub-tended about the X-ray source by the crystal lamina and is about
0.2
nunfor the instrument under discussion. Since there is a wavelength
differ-ence between the radiation focused at one point along this strip and that
focused· at another, the crystal laminae can be so adjusted that the
wave-length of the radiation focused at the center of this strip is the same
as that of a strong X-ray line in the characteristic spectrum of the target
material of the X-ray tube used as source. The "length" of the focal strip
will then be limited by the natural breadth of this line. Using the KOl1
line of the copper target presently being used, the "length" of this focal
strip is about
1.4
mm.Having established the close correspondence between the focal strip
in the monochromatic, converging beam is proportional to the energy pass
-ing through the useable target strip in the direction SA. Borrm-1ing
terms from the field of optics, this result can be restated: The energy in the converging beam is proportional to the luminance of the X-ray
source as viewed along AS, provided the source fills the useable target
window.
Before applying the foregoing results to a discussion of the reso
-lution control possible with the instrument, some information about the
position of the sample to be studied and the type of data obtained is in
order.
Position of Scattering Sample and Detector
In view of the fact that information concerning the particle size
and/or shape is to be obtained from a study of the X·rays scattered through
small angles (in a range from about 0.002 to 0.1 radians), it is very
important that the detection of the scattered radiation be made where the
position of detection (in the case of a true point focus) uniquely deter
-mines the scattering angle. This is possible only if detection is made in the focal plane (i.e., the plane through PF normal to the converging
pencil of rays). Consequently the sample must be placed in the converg
-ing monochromatic beam between crystal B and the point focus, PF. If all
parts of the scattering sample are equally distant from PF, then all rays
scattered by the sample through a given (small) angle will be detected at
essentially the same lateral distance from the point focus.
A very high p3rcentage of the fairly long X-radiation (say
X> J.i)
scattered at small angles by particles with characteristic diameters of
In
such cases the total diminution of the X-ray intensity in traversing a single particle is so small that it can be neglected. The small angleintensity pattern produced by such particles is in good agreement with the
I
classical assumptions (1) that the electrons of the scattering particle are forced to vibrate with the frequency of the field vectors which describe the X-ray beam and (2) that these electrons must therefore radiate electro-magnetic energy of this same frequency. This ideal lol-T angle scattering of X rays by particles in the size range under consideration is thus a volume effect -- all of the electrons in the particle contribute to the scattered radiation.
Resolution for Low Angle Scattering
Using this theory, it is easy to show that in the case of X-ray diffraction, as in the case of the diffraction of optical light (although
diffraction in this case is more of a surface effect), the pattern obtained from a series of randomly placed but similarly oriented identical particles is the same as the pattern due to a single particle. In such cases the intensity pattern produced by a truly point focusing beam will have
re-gions where the intensity is a relative maximum and others where it is a relative minimum, the separation of successive extrema being of the order of
..l...
radians where ~ is the wavelength o~ the radiation used, and DD
represents the average particle diameter. If, now, the direct beam is finite, but small in comparison with the distance between adjacent extrema, the detail of the pattern can still be observed. In keeping with this qualitative idea of "resolution" as the ability to see detail, the resolu-tion obtainable with a monochromatic X-ray beam is defined as ~ and
the approximate size of the scattering particle whose relative intensity extrema can just be clearly observed. It should be noted that resolution is thus a function of the sample position, and that the study of large particles requires correspondingly ~ resolution.
When equal resolution is desired in all directions in the focal plane, the "point" focus must obviously be as nearly circuJa r as possible. This means that the length and width of the focal strip described above
( p.8 ) should be equal. As mentioned above, the width depends on the solid angle of radiation being used by the crystals, and hence can be controlled by "stopping down" the crystals. This width is, however,
several times smaller than the length of the strip, and no practical advan-tage in utilizing this control, for the samples So far studied, has been found. Since the length of the focal strip cannot be greater than that of the useable target strip, this length can be controlled by placing a suitable slit in front of the X-ray tube. A judicious choice of these parameters (the length and width of the focal spot) allows one to obtain the necessary resolution for a given experiment while keeping the total intensity as high as the required resolution will permit.
Salient Physical Dimensions of the Instrument
Since the alignment procedure for establishing the proper orienta-tion between the X-ray source and the two elastically bent crystal laminae, while exceedingly important in obtaining the point focus itself,- does not
enter into prodedures followed in actually using the instrument, it will suffice to state· that a careful, systematic method of alignment has been
wor:ke d out and is described in reference ( 2). Certain physical dimensions
The radius of the focal circles is nominally 60 em, and the angular
displacement of the crystals along the focal circle from the
!3
1 point is about4°.
The crystal planes utilized in producing the Bragg focusing are the 310 planes of quartz, and the radiation which is focused by theinstru-ment is the Cu K o(l line ( .~:= 1.5374), hence the Bragg angle is approxi-mately
40.7°.
These quantities, together with the finite size of the crys-tal laminae and their clamping blocks, determine the maximum specimen-to-film distance that can be obtained, this distance being about65
em. The dimensions of the crystal laminae· are such that the crossection of the X-ray beam midway between the crystals is approximately a square 2 em on a side. Under normal operating conditions, no "stop" is provided in front of theX-ray tube so that the focal spot is an elongated region with major and mi-nor diameters of about 1.7 mm and 0.2 mm respectively.* Thus, for applica-tions in which the scattered radiation to be studied shows a particular directional orientation, one can obtain the maximum amount of scattered in-tensity with very little loss in resolution by orienting the sample so that the preferred scattering direction is along the minor axis of the focal spot. Means for Detecting Scattered Radiation
As already suggested, the amount of radiation that goes into low angle scattering is in most cases extremely small. For this reason, X-ray film (Eastman medical duplitized, no-screen) has been principally used, the use of Geiger counters being limited to measurements of the direct beam intensity. Film techniques have other advantages over counters for
the study of the low angle diffraction from substances which give rather
complicated patterns in that a single film provides the complete record
of such a pattern whereas a two dimensional scanning of the entire focal
plane by a counter with a very small window would be required to o'9tain
the same information. It must be admitted, however, that for absolute
intensity comparisons a counter method far excels one utilizing film.
Use of Helium Gas Along the X-Ray Path
Provision has been made for the X rays, after passing through the
window of the X-ray tube, to spend the remainder of their traversal of the
point focusing monochromator in an atmosphere of helium. The most important
reasons for choosing helium as the medium through which the X rays are
propagated are threefoJd: (1) The attenuation of the beam in helium gas
is very slight -- a medium of helium at a pressure of one atmosphere
causes only a 2% attenuation of the beam in traversing the 160 em path
of the point focusing monochromator. Thus the low absorption advantage
of a vacuum system is obtained without the construction and operational
difficulties of such a system. (The quantitative advantages of a helium
system over an air-filled system are given in the section on intensity
improvements in Part VI.) (2) Scattering (as distinguished from total
absorption) of Cu K oL radiation by a helium atom is very much Jess than by
an oxygen or nitrogen molecule, so that by using helium one obtains a
second major advantage which a vacuum system has over a medium of air
with-out the accompanying inconveniences.
(3)
With the helium system, wetsamples can be conveniently introduced into the beam merely by enclosing
them in a thin sheet of nylon (for which absorption is extremely low),
the moisture being maintained by a vapor-tight beeswax seal at points
difficulty in a vacuum system. The great advantage in being abl e to use wet samples lies in the fact that many of the substances whose particle
sizes or periodicities are such as to be amenable to study by the point focusing monochromator are biological in nature, with properties that are greatly altered by desic.cation. Thus the physical disposition of the atomic constituents making up the substance may also undergo consider-able change in drying, the phenomenon of shrinkage being the most obvious
one. Hence, measurements made on the substance in its natural environment would be a valuable supplement to measurements of the substance after
desiccation. In part of the size range (from say 20 to 3000 ~) where
low angle diffraction studied with the present instrument are useful,
the electron microscope provides' a very powerful tool for ascertaining size and structure; however, the limitation to samples which are desic-cated is especially severe for this instrument .
Fig. 3 shows the instrument in its present form. The box-like enclosure into which the (horizontal) metallic tube leading from the X-ray source projects contains the two crystal clamping blocks with their re-spective crystal laminae. This box-like enclosure, the horizontal tube, and the rectangular nearly vertical column provide the envelope containing
the helium as well as acting as radiation shields and light shields.
Moreover, the vertical column is provided with a series of shelf-like
openings into which a sample holder can be inserted, much as a drawer, and cover plates with 0-ring seals can be securely fastened over them
to render the system helium-tight. These "shelves" were carefully
machined and their separations accurately measured so that, in the case
directly measured with precision, exposures made at two levels would, by triangulation using some easily measured feature of the diffraction pattern, furnish the effective sample-to-film distance for both exposures. Particle Information MOst Easily Obtained From Low Angle Diffraction
Studies
In view of the fact that distance is usually the physical quantity most amenable to measurement, it is not surprising that those sample
features which are simply related to the positions of the intensity maxima and minima in the diffraction pattern are the features concerning which quantitative information can be most easily obtained. Two examples of samples with features of this type which have been measured with the pre-sent instrument can be cited in this connection. First, a substance made up of many equal spheres with no orderly positional arrangement among the spheres will produce a diffraction pattern which is the superposition of the intensities of all the sp~eres, hence the diffraction pattern is the same for the collection of spheres as for any single one of them. Since the pattern for a single sphere with an electron density that depends only on the radial distance from the center shows relative maxima and minima that depend only on the scattering angle, it is clear that the pattern
•
a directly related period, so that again the sample period can be found by making distance measurements.
In
addition to furnishing a record from which positions ofinten-sity maxima and minima can be found, the film exposed by the diffracted X rays also furnishes a complete record of the way in which the intensity varies from point to point. Now the intensity scattered in a given
direction is, for the wavelength employed, uniquely determined by the projection of the electron density of the sample onto a plane normal to
the bisector of the scattering angle. Hence low angle diffraction studies essentially depend only ~ the projection of the electron density onto ~ plane normal to the central beam. It is thus clear that low angle X-ray diffraction data cannot, even theoretically, completely determine the electron distribution in the sample, but only the projection of this dis-tribution. Consequently, particle shape and size distribution cannot be simultaneously inferred; however, if the shape is known, the distribution of sizes in the sample can often be approximately found and vice versa. For such determinations it is almost always essential that the relative X-ray intensities be known over a finite range of the diffraction pattern
(instead of knowing only the positions of relative intensity extrema). When the particles are known to have a particular shape (say from electron microscope pictures), the approximate size distribution is most easily found by comparing the obtained intensity pattern with a theoreti-cal pattern containing appropriate parameters to describe the types of size distribution most likely to occur in nature (e.g., Gaussian,
can obtain the size distribution to a fair degree of accuracy. If the
particJe s are randomly oriented spheroids (including spheres and long
cylinders as special cases), the task of composing many theoretical
com-parison patterns has already been carried out by Roess and Shull
C4
),
their results being given in the Journal of Applied Physics (1947) 18,
295. An example in which the present instrument has been used for a
sample of this type (carbon black) is given in L. Shenfil1s thesis. (2)
The more complicated problem of treating a particle made up of two
Part· II
DETERMINATION OF THE MEAN DIAMETER OF LATEX SPHERES
A determination of the mean particle size of latex spheres by
observing the X-ray diffraction pattern obtained with these objects as
scatterer was first carried out by Yudowitch(5) using slit-system
collima-tion and approximate monochromatizacollima-tion by filtracollima-tion. Widespread
interest ( 6) has been shown in the particle size of the now famous Dow latex, batch 580-G, lot 3584, extensively used as a valuable comparison
standard of size for electron microscopes (which have revealed that they
consist of spherical particles about 2600
.i
units in diameter). Thiswidespread interest, coupled with the belief that the precision with which
this size can be obtained from X-ray diffraction data could be increased,
have provided the impetus for the latex diffraction stuQies to be described.
The basic approach to the problem is similar to that taken by Yudowitch,
but advantage has been taken of the highly monochromatic sharply
converg-ing beam afforded by the point focusconverg-ing monochromator.
Experimental Data
The samples of latex used were taken from 5 cc vials containing 40%
water suspension of latex* (these are the standard containers and contents
sent to electron microscopists by the Dow Chemical Company). The water was
removed by evaporation, and about 0.4 cc of the latex powder was placed
between 1 mil nylon sheets in a cavity of dimensions 2 x 2 x 0.1 em. This
sample was then placed in the converging beam slightly above the second
crystal of the point focusing monochromator with the 2 x 2 em square
faces normal to the central ray which passes through the centers of the
squares. The sample-to-film distance is given below in conjunction with
the other quantitative experimental data (the film is, of course, normal
to the central ray at the point focus with its center coinciding with the
point focus). The observed diffraction pattern consists of a series of
well defined rings corresponding to intensity maxima for various (small)
angles of deviation in the X-ray beam.
Fig.
4
shows typical diffraction patterns obtained with "coarse"and "fine" adjustment of the focus respectively. In the "coarse"
adjust-ment, the length of the slightly elongated focus is sufficient to blur
out the successive diffraction rings in one azimuth as can be clearly
seen, while in the "fine" adjustment the "point" focus is sufficiently
short along its greatest dimension to make the rings distinguishable in
all azimuths. The dark portion in the center of the left hand picture
is a hole in the film to permit the direct beam to pass freely through the
film without undue fogging. Successive rings, which are seen to be clearly
resolved, are separated by a difference of scattering angle of about 0.002
radians. Fig.
S
shows a microphotometer trace of the129.4
hour exposuremade using high resolution.
In compiling the data, use has been made of diffraction photographs
taken with three physically distinct samples of the Dow latex particles.
Two of these,designated as samples I-a and I-b, respectively, were from
physically distinct portions of the latex loaned to us by
Dr.
Baker ofI
II
I
1.0 MM
I.OMM
Fig.
4
The diffraction pattern reproduced on the left was obtained in 129.6 hours using sample I-b with the "fine" focus arranganent, while the one on the right was obtained in 91.1 hours using sample II with fullFig.
5
Microphotometer curve of diffraction pattern of latexparticles (sample I-b, fine focus,
129
.
4
hr. exposure).Intervals at the bottom represent 0.50 mm on the diffraction
same
5
cc vial as that used by K. L. YudowitchC5)
in his work on latex.This l ast sample was kindly loaned by him so that the possibility of
variation in the average particle size from distinct apportionments of the
same Dow Chemical batch could be investigated. Such a possibility
I
suggested itself when a significant disagreement was found between the
results of measurements made here and those made by Dr. Yudowitch.
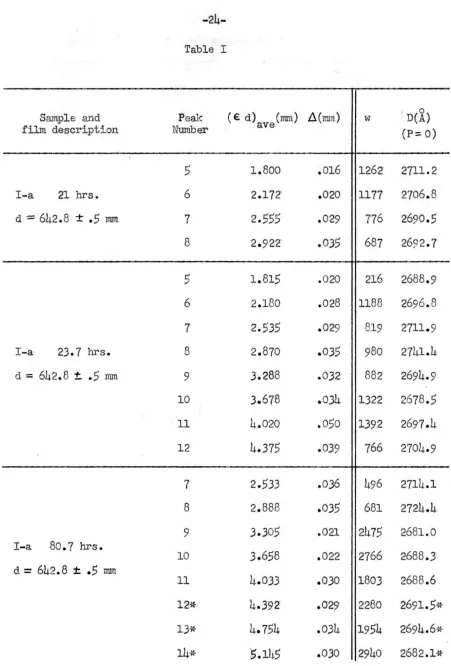
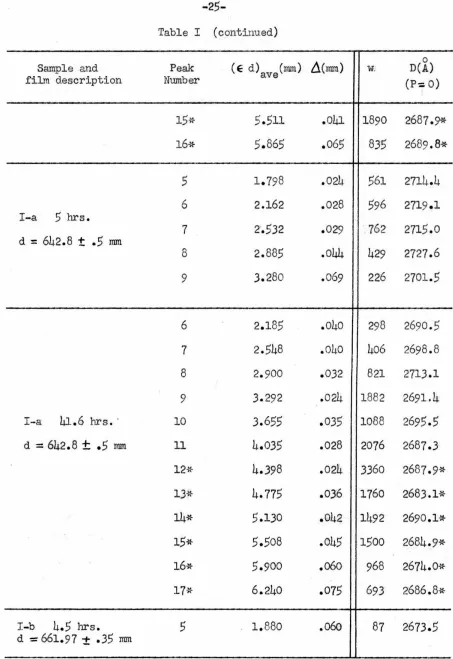
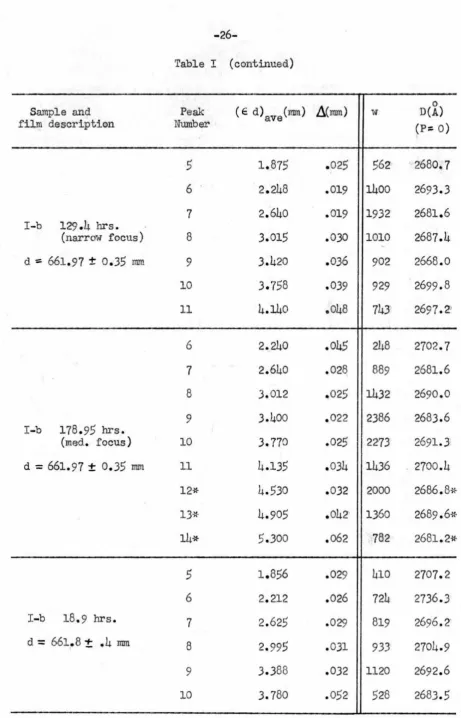
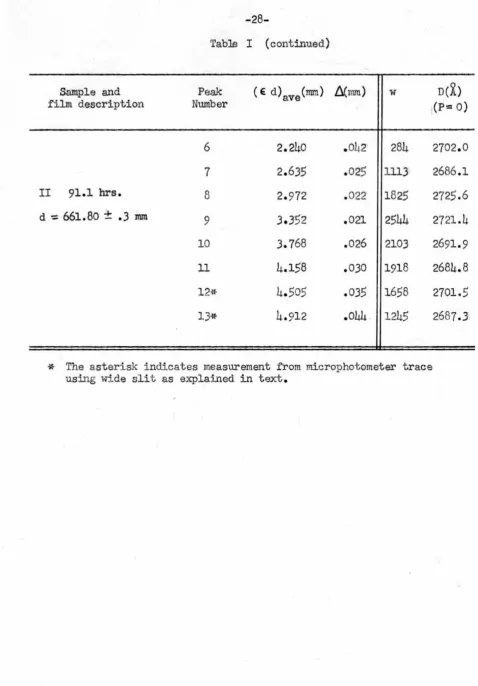
Before discussing the conclusions drawn from these measurements,
an extensive table containing the pertinent experimental data is presented
(Table I). In conjunction with these experimental data, the results of
certain calculations to be described below are given (in the columns to
the right of the double line). The following symbols and numerical values
are used:
). "" Wavelength of Cu K o<
1 line
-=
1.5374i.
D :: Particle diameter of latex spheres.
d -=. Sample-to-film distance (varied from 64 to 66 em)
E- = Angle through which x-ray beam is deviated by scatterer.
u
=
is the maximum phase difference between the radiationscattered in a direction €. by an element at the center of
the sphere and that scattered in the same direction by any
other element. (See Fig.
6).
A c Estimated accuracy limit in measuring a diffraction ring
radius. It is believed that this estimation is such that about
90% of all observations would fall inside the range ± ..d •
w ~ Weight to be attached to a given measurement.
Values for successive diffraction ring radii were measured from
microphotom-Table I
( € d) (mrn) Ll(nun) 0
Sample and Peak w D(A)
film description Number ave (P~ 0)
5 1.800 .016 1262 2711.2
I-a 21 hrs. 6 2.172 .020 1177 2706.8
d = 642.8 ± • 5 mm 7 2.555 .029 776 2690.5
8 2.922 .035 687 2692.7
5 1.815 .020 216 2688.9
6 2.180 .028 1188 2696.8
7 2.535 .029 819 2711.9
I-a 23.7 hrs. 8 2.870 .035 980 2741.4
d = 642.8 :t .5 mrn 9 3.288 .032 882 2694.9
10 3.678 .034 1322 2678.5
11 4.020 .050 1392 2697.4
12 4.375 .039 766 2704.9
7 2.533 .036 496 2714.1 8 2.888 .035 681 2724.4
9 3.305 .021 2475 2681.0
I-a 80.7 hrs.
10 3.658 .022 2766 2688.3 d
=
642.8 ± .5 mm4.033 1803 2688.6
11 .030
[image:29.527.39.490.43.709.2]Table I (continued)
( E d) (nun) Ll(nun) 0
Sample and Peak w. D(A)
film description Number ave (P:
0
)
15*
5
.
511
.
041
1
890
2687.9*
16*
5
.
865
.
065
8
35
2689
.8
*
5
1
.
798
.
024
561
271
4
.
4
6
2
.1
62
.
028
596
271
9
.
1
I-a
S
hrs.7
2'
.
532
.
029
.
762
2715
.
0
d :
642
.
8
t.5
nun8
2
.
885
.
044
429
2727.6
9
3.2
80
.
069
226
2
701.5
6
2.1
85
.
040
2
98
2690
.
5
7
2.548
.
040
4
06
2698
.
8
8
2
.
900
.
032
821
271
3
.
1
9
3.2
9
2
.
024
1882
2691.4
I-a
41.6
hrs. ·10
3
.
655
.
035
1
088
2695
.5
d
= 642.8
±
.5
nun11
4
.
0
35
.
0
2
8
2076
2687
.3
12
*
4
.3
98
.
024
33
60
26
8
7.9*
13
*
4.775
.
036
1760
2683.1
-*
14*
5
.130
.042
14
92
2690.1*
15*
5
.
508
.04
5
1500
2684
.
9*
16*
5
.
900
.060
96
8
2674.0*
17
*
6.240
.07
5
693
2686
.
8*
I-b
4.5
hrs.1.
88
0
.06o8
7
26
73.
5
[image:30.528.40.493.49.708.2]Table I (continued)
( E d) (nun) 8(nun) 0
Sample and Peak w D(A)
film descriptiQn Number ave (P::
0)
5
1
.
875
.
025
56Z
2680
.
7
6
2
.
248
.
019
1400
26
9
3
.
3
7
2
.
640
.
019
1932
2681
.
6
I
-
b
129
.
4
hrs.(narrow focus)
8
3
.
015
.
030
1010
2687
.
4
d ~
661
.
97
±0
.
35
mm9
3
.
420
.
036
902
2668
.
0
10
3
.
758
.
039
929
269
9
.
8
11
4
.
140
.
048
743
2697
.
2
16
2
.
240
.
o45
248
2702
.
7
7
2
.
640
.
028
889
2681
.
6
8
3
.
012
.
025
1432
2690
.
0
9
3
.
400
.
022
2386
2683.6
I
-
b
178
.
95
hrs.(med. focus)
10
3
.
770
.
025
2273
2691.3
d
=
661
.
97
±0
.
35
mm11
4
.
135
.
03
4
1436
270
0
.
4
12*
4
.
5
30
.
032
2000
2686
.
8*
13*
4
.
905
.
042
13
60
268
9
.
6*
14*
5
.
30
0
.
062
782
2681
.
2*
5
1
.
856
.
029
410
2707
.
2
6
2
.
212
.
026
724
2736
.
3
I
-b
18
.
9
hrs.7
2
.
6
2
5
.
029
819
2696
.
2
'
d
=
661
.
8
!: .
4
nun8
2
.
99
5
.
0
31
933
2704
.
9
9
3
.
3
88
.
032
1120
2692
.
6
[image:31.530.27.489.26.745.2]Table I (continued)
( € d) ave (mm) tl(rmn) 0
Sample and Peak w D(A)
film description
Number
(P==0)
5
1.
882
.
OJ8
245
2668.
2
'
6
2.
2
'
42
.
021
1
145
26
98
.
0
7
2.
635
.
026
1
0
27
2684
.
4
II
68
.
2
hrs.8
2
.
972
.030
982
272:3
.
9
d
=
66
1.
39
±0.
3
rmn9
3.
378
.
020
2856
269
8
.
7
10
3.7
85
.
022
'
2
958
2678
.
3
ll
4.
152
.
0
32
16
82
2687
.
0
12*
4.
505
.
055
672
2699
.
8*
13*
4
.
868
.
058
705
2707
.
4*
5
1
.
872
.
031
365
2683.
0
6
2.
238
.
018
1545
2703'
.
7
I I
44.
3
hrs.7
2.
632
.
022
1428
26
88
.
2
d
=
661
.
6
±
.
3
mm8
3
.
000
.
029
1070
26
99
.
5
9
3.
378
.
024
1473
26
99
.
5
10
3.
7
78
.
035
1166
2684
.
0
11
4
.160
.
053
616
26
82
.
7
5
1
.
865
.
03
5
284
2692
.
5
I I
5
.
95
hrs.6
2.
238
.
028
6'38
2702.
9
d =
661.39
±
.
3
rmnTable I (continued)
Sample and Peak ( € d) ave (nun) L\(mm) w
film description Number
6
2.240
.
042
284
7
2
.
635
.
025
11
13
II
91.1
hrs.8
2.972
.
022
1825
d -:::661.80
±.3
mm9
3.3
52
.
021
2544
10
3.7
68
.
026
2103
11
4
.1
58
.
030
1
9
1
8
12*
4
.
505
.
035
1658
13*
4.912
.044
1245
*
The asterisk indicates measurement from microphotometer traceusing wide slit as explained in text.
D(~)
(P:::
0
)
2702.0
2686
.
1
2725
.
6
2721.4
2691.9
2684.8
2701.5
[image:33.536.21.500.45.732.2]-r-D/2
--
eter '~dow" size for most of the traces corresponds to a film area
of
o.o6
x 0.13 mm. For the weaker, larger diameter, diffraction rings(rings beyond No. 11)1 it was found that the effect of film grain could
I be lessened, and consequently more reliable results obtained, if the
"window" were lengthened and an experimental correction made for the
s.1stematic error so introduced. Rings so measured and corrected are
indicated with an asterisk.
Interpretation of Data
In order to be able to infer particle sizes for the latex spheres
from the entire series of rings, consideration has been given to at
least three possible space arrangements of the particles relative to each
other in each of which the particle diameter might be expected to
influ-ence the diffraction pattern differently.
(la) The spheres may tend to clump, in the process of drying,
in such a way that the interior of each clump is made up of a close-packed
hexagonal or cubic array of particles like a crystallite in a
poly-crystalline solid, the orientation of the clumps being random.
(lb) It is also conceivable that, since the particles are large
enough that the interparticle forces probably do not have the nature or
intensity of the interatomic f6rces in crystals, the spheres may tend to
form a close-packed array that is a hybrid of the hexagonal close packing
(layer scheme A, B,
A, B, A,
B etc., see Fig. 7) and the cubic close pack-ing (layer schemeA, B,
c,
A, B,
C etc.) such that the layers in which each sphere makes contact with six others are placed unsystematicallyupon one another instead of having a definite relation to the lower layers.
A
A
A
A
B
B
B
c
c
c
c
A
A
A
B
B
B
B
c
c
c
A
A
A
A
B
B
B
c
c
c
c
Fig. 1 To illustrate the close-packed arrays considered in the text. Any set of like letters is to be thought of as representing the centers of spheres in a given horizontal plane. The different
letters are then to be thought of as lying in
may fall into a spherically symmetric arrangement similar to that commonly
assumed as representative of the disposition of atoms in a liquid, but
with no other more far-reaching type of regularity markedly present.
(3} The particles may be distributed with sufficient lack of
regularity that the distribution is essentially random.
One might suppose that electron microscope pictures of the latex
such as those given by Gerould(6) in the February 1950 issue of the
Journal of Applied Physics offer strong support to the first possibility,
(la). (As further evidence that this possibility should receive careful
consideration, one might cite experiments in which equal spheres of bread
or putty have been squeezed together and the resulting arrangement studied.
Such experiments have shown a tendency for the interior particles to form
a cubic close-packed array.) However, if crystal-type packing were the
major cause for the observed diffraction rings Cas in a Debye-Scherrer
powder pattern) there would be a series of rings corresponding to each
fundamental spacing of "crystallite" planes containing ~ high surface
density of particles. Hence the fact that only a single distinct series
of rings is obtained seems to be proof that such scattering is at most a
minor contributor to the diffraction pattern. The other possibility, (lb),
of a hybrid "crystal" built up as outlined above would indeed lead to
clumps with only one fundamental set of interplanar spacings. However,
such an interpretation of the results yields a value for the particle size
that is wholly incompatible with electron microscope values, and
further-more, the relative intensities between successive rings as observed do
not correspond to those which would be expected in such a case.
arrangement of the particles as conceived under ( 2) above was given by
Gingrich and Warren(7) in 1934, and has been applied to-the present
problem by K. L.
Yudowitch~5)
The main simplifying assumption underly-ing the theory is that the number of spheres per unit volume, as afunc-tion of the radial distance (r) from an arbitrarily chosen sphere, is
essentially constant except for a peak at r -= D and a void for r <. D. To describe the size of the peak at r
=
D, a "packing" parameter (P) is introduced. It is so defined that P==- 0 corresponds to a randomdistri-bution of spheres, hence case (3) considered above is included in this
treatment. Denoting the X-ray intensity scattered at an angle € by
I and setting M
=
number of spheres in the sample, N == number of electronsper sphere and q>(u) ~~(sin u- u cos u), the simplification mentioned
u
above leads to the following formula:
(1)
<l
(u) is z·ero when tan u=
u (except at U'"" 0), hence I has anoscilla-tory character that would account for a series of intensity maxima.
Inso-far as a formula of this type accurately describes the intensity pattern,
measurements of the larger rings obtained yield a particle diameter that
is more reliable than one made using smaller rings because the positions
of the larger rings are less sensitive to changes in P.
A formula quite similar to equation (1) above, but based on
Rodriquez 1 work ( 8) on the kinetic theory of fluids has been given by
Fournet(9):
wherein v0 and v1 are the true and mean particle volumes, respectively, and 11 is nearly constant. The theoretical calcuJa tion of ,I requires
a knowledge of the interaction potential between the particles so that except for relatively few cases<
8
>,
it must be determined experimentally. One of the main assumptions underlying (2) is the supposition that the probability distribution function describing the particle positions does- ¢(r)/kT
not differ markedly from e where ¢ (r) is the interaction poten -tial between spheres. For particles as large as the latex spheres under consideration, the validity of this assumption may be questioned. Never-theless, for large values of u (or small values of P and
v
v0/v1 ),equations (1) and (2) become identical.
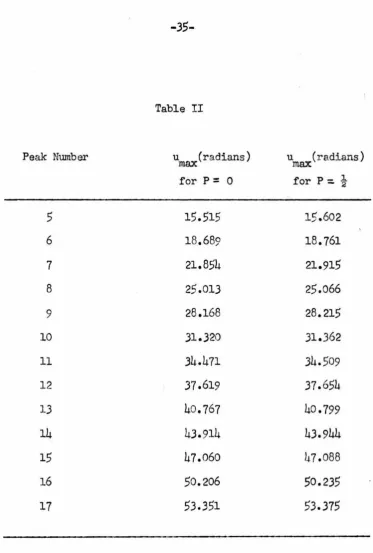
We have based our size determinations upon equation (1). Table I I gives the values of u for which the intensity has a relative maximum for the cases P
=
0 and P=
t
.
The calculation of these u values was made by use of the equationwhere: ~
=
Un - nrr bn == ...!._nrr
c-
335
2 2 2c -
T
pr -
15
P-r
-
2-s Pr
Table II
Peak Number u (radians)
max u max (radians)
for P
=
0
for P=
~5
15.515
15.602
6
1
8
.68
9
18.761
1
21.854
21.915
8
2
5
.013
25.066
9
28.1
68
28.215
10
31.320
31.362
11
34.471
34.509
12
37.619
37.654
13
4
0
.767
40.799
14
43.
9
14
43.944
15
47.060
47.088
16
50.206
50.235
[image:40.530.84.458.46.600.2]equation connecting ~ and bn' the final form being obtained by i tera- ·
tion of the resultant infinite degree algebraic equation.
The numbers in the columns to the right of the double line in Table I give the particle diameter inferred from the corresponding diffraction ring radius (for P
=
0) and the relative weight given to each measurement.(The results based upon equation (1) with P ~
l
are given in TableIv).
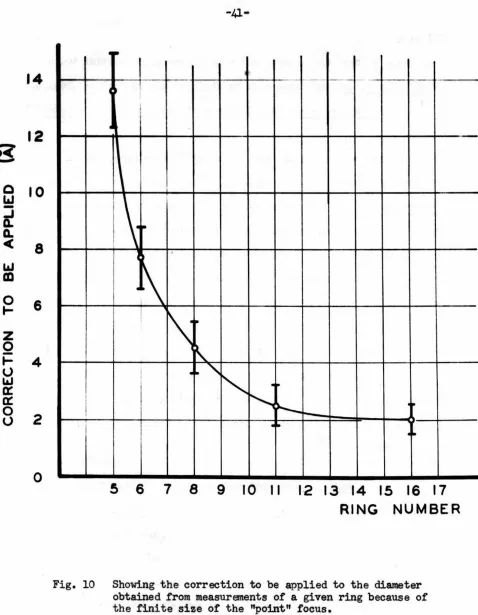
Effect of Finite Size of Point Focus and Microphotometer Window
Probably the most important systematic error introduced into the above calculations, except possibly that due to inadequacies in the theory which yields equation (1), is the error tfhich results from interpreting
/
the data as though the primary beam converged to a mathematical point instead of the finite elongated spot used experimentally. Before describ-ing the correction for this error, it is advantageous to consider the qualitative features of the primary beam. Fig. 8 shmrs two reproductions of exposures made, in the focal plane, with the primary X-ray beam. The
30 minute exposure shows the elongated nature of the point focus very clearly, while the longer exposure ( 31 hours) shows the magnitude and distribution of those much weaker parts of the primary radiation which are not focused in this elongated spot. All of the major features of the 31 hour exposure are readily explained: The streamer which makes an angle of about
45
degrees with the major axis of the focal spot is due to Cu Koc
...,__.
1.0 MM
~
I. 0 MM
Fig. 8 On the left is shown a reproduction of a 31 hour
exposure to the main beam at the "focal point", the
major features of which are discussed in the text.
accompanying (very faint) streamer being due to Cu K oe
2 radiation
scattered by the first crystal and focused by the second. It is important
to note that this non-Bragg reflected radiation has been completely
eliminated from the focal plane except in two well defined regions where
it can be readily distinguished from radiation scattered by the sample
being studied. The true elongated nature of the main focal spot is
some-what obscured in the longer exposure. This is partially due to secondary
scattering at the film.
The finite dimensions of the focal spot introduce an important
systematic error in the diffraction ring diameters to a different degree
for different azimuths of the pattern and different rings. The az-imuth
of best resolution normal to the long axis of the focal spot was the one
invariably used for measuring ring diameters. Fig. 9 shows a map of the
distribution of X-ray intensity over the focal spot as it was used for
most of the latex work. The spot was divided into six annular sections or
zones in such a way that the arcs defining these sections are concentric
with the point of maximum intensity for a specified diffraction ring taken
on the azimuth of greatest resolution, and the total direct beam intensity
in each zone is assumed to be concentrated at the mid-point of the mean
arc in that zone. Hence the effect of the true beam has been approximated
by six ideal beams coming to a small array of true point foci along the
azimuth of best resolution, an array which would yield essentially the same
intensity distribution in the neighborhood of a given ring as that actually
obtained. Finally, the radial position of the maximum expected for
scattering from these six ideal beams is compared with the position of the
DISTANCE FROM CENTER OF "POINT" FOCUS ALONG MINOR DIAMETER
t}o
MM.)Fig. 9 This diagram shows the shape of half of the primary "point" focus, the other half being essentially the reflection of the part shown
in the horizontal axis. The number in each subregion indicate:; the mean relative intensity there, as determined by microphotometer
particle size obtained by this procedure are shown in Fig. 10.
The size of the microphotometer window was such that no appreci
-able error is introduced in assuming it to be a point scanner. The
corrections just obtained for the finite size of the focus are not
in-eluded in Tables I and III, but are included in the final results, Table
IV.
Comparison of Samples
The weighted average values of D together with the statistical
standard deviations, (f i , for the case in which all measured rings for
a given sample are taken as statistically independent are given in
Table III.
Table III
Sample Diameter in
i
External precision index,(not corrected) c5. (by individual samples)
~
p: 0 p-- ;r 1
I-a 2693.7 2697.6 2.0
I-b 2690.7 269.5.9 2.4
II 2696.7 2701.7 2.7
The results of separate calculations for P= 0 and P=! have been
included because the standard deviations given do not reflect the effect
of systematic errors such as those introduced by errors in the assumed
theory. Other systematic errors such as those due to film shrinkage,
sample-to-film distance, and microphotometer distance calibration are
believed to be less than 2!
i
(See evidence, Part III). Although14
12
R
-Q
10
l&J
-
~
Q.
~
8
LtJ
m
0
6
~z
Q
~u
LtJ4
a:
a:
0
2
u
0
I •
- t --
-I
\
~ ~·~
I
1\
~~
!
..
"
"'
~
.
r---
"'-••
••
5
6
7
8
9
I 0 II
1
·
2 I 3 14 15 16
I
7
RING NUMBER
[image:46.538.33.511.51.666.2]predicted values still remain in the results at the stage of Table III, the error introduced is essentially the same in the case of each sample measured, so that we can conclude at this point that ~ significant difference in the ~particle size of the three samples used is
indi-cated.
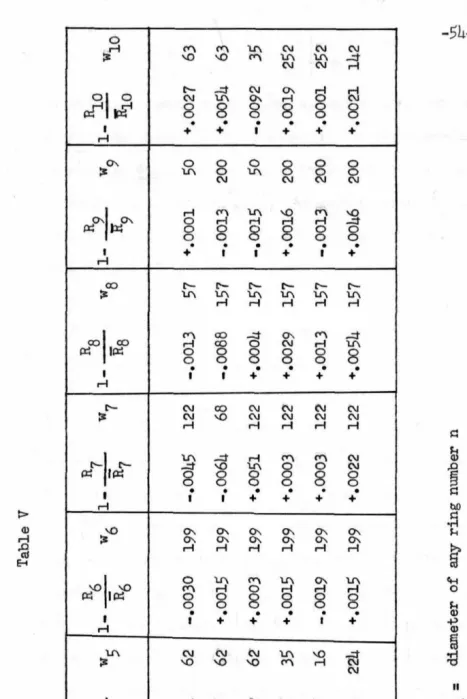
Having established this result, the data can be combined by ring
numbers, considering the different measurements of a given ring (on all
the different exposures in which it can be measured) ~ statistically
independent. Table IV (using P=O) presents the results of this treat-ment. Here an internal as well as an external precision index is attached
to the value of the particle diameter obtained from all measurements of
each ring. This internal index for a given ring is proportional to the
reciprocal of the square root of the total (summed) weight of the indi
-vidual measurements of this ring; the external index is the statistical
standard deviation from their mean of the measurements involved. In
combining the results by rings to give a final weighted mean diameter,
the weight,
w
,
has been taken proportional to --~2
~~2~ __2 __ __
(
)
!
6 int <1ext
Also, data from peak number 8 has here been omitted. This has been done as a result of definite evidence that this ring is distorted due to
radiation that is not scattered by the latex. This distortion is, in
fact, due to the Cu K<X
2 streamer referred to above in reference to Fig.
8.
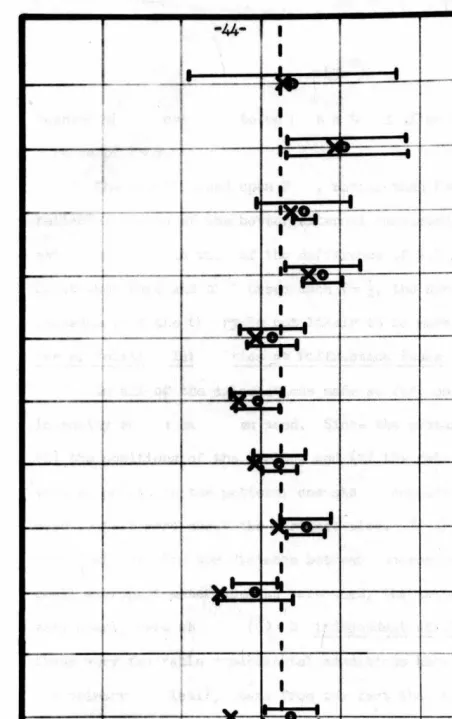
Fig. 11 shows a plot of inferred particle diameter versus the numberof the intensity maximum whose position was used for the calculation, both for P= 0 and for P=
!
.
In the case of P=o,
there appears t.o be little,Table IV
COMPILATION OF DATA BY INDIVIDUAL MAXIMA
I
0
Number Number of
D
P:
O
(
~
)
DP-t(A) 0 0of Measurements <S"ext (A) 6:int(.A)
w
Maximum Involved Uncorrected Corrected Corrected
5
9
269
8.
4
Z684
.
8
2699.9
5
.
4
5
.
4
343
6
11
27
03.
9
2696
.
2
2706.8
3
.
7
3
.
6
750
7
12
'
26
9
2
.
2
2686
.
4
2693
.
9
3
.
4
3
.
3
8
9
1
8
11
2
7
1
1.2
2706
.
7
2712
.
4
5
.
5
3
.
3
(SeeText)
9
10
2694
.4
2690
.
9
2695
.
4
4
.
7
2
.
8
6
6
9
10
9
268
7.2
2684
.
3
268
7.
9
2
.
3
3
.
2
1290
11
8
269
0.3
2687
.
8
2690
.
8
2
.
2
3
.2
1330
12
6
2692
.
5
2690
.
3
2692
.
8
2.8
3
.
3
1070
1
3
5
2
69
0.
7
2688
.
6
2690
.7
3
.
2
4
.
1
739
14
3
2684
.
3
2682
.
2
2684
.
0
2
.
6
4
.
7
693
15
2
2686
.
6
2684
.
6
26
86
.2
1
.
5
5
.
9
5
4
0
16
2
'
2681
.
3
2679
.
3
2680
.
8
7
.
9
8
.
0
158
1
7
1
2686
.
8
2684
.
8
2686
.0
-
13
.
0
5
9
Treating the above data as independent, one obtains:
...
~
ld
2710
-
en
~
2700
!.!
1-
a:
2890
~2887.5
~2880
a:
l&J
~
however there does seem to be such a trend if calculations are based on
a value of P":
t
.
The result based upon P=
o,
rather than P= ~, is taken as the morereliable because of the better external consistency obtained, and it is
estimated that, in view of the difference of
5
.
5
~ between the valuebased upon P= 0 and that based upon P=
t
,
the systematic error due toinadequacy of the theory is not likely to be more than about
7
i.
Use of Relative Intensities at Diffraction Peaks
In all of the calculations made so far, only the positions of the
intensity maxima have been used. Since the pictures obtained also yield
(1) the positions of the minima, and (2) the relative intensity at
various points in the pattern, one should consider how such data can be
used to tell more about the particle size. If the point focus were many
times smaller than the distance between successive rings, and a suitably
small microphotometer opening were used, the intensity should drop to
very nearly zero when ~ (u) -=0 independent of the packing. However,
these very favorable experimental conditions have not yet been realized.
The primary difficulty stems from the fact that the point focus is not
many times smaller than the distance between rings. Hence the positions
of the minima as actually obtained depend markedly on the "point focus 11
spot distribution and are influenced by relative intensities at the
neighboring intensity peaks. Furthermore, film grain, finite range o£
particle diameters, and scattering due to extraneous material contribute
,_
more, percentagewise, at the minima than at the corresponding ~ima~- For
these reasons, we have not been able to make this method of finaing D