ABSTRACT: Offshore wind energy experienced an exponential growth in installed power since the beginning of the current century. While this growing trend is expected to continue, further growth of the sector imposes more demanding engineering methods. It is then envisaged that enhanced technical competitiveness can be achieved through a progressively less deterministic design process. Under the described context, a comparative study on the applicability of different probabilistic methods to estimate the probability of failure (Pf) of offshore wind turbine (OWT) towers under extreme events is presented here. Depending on the complexity introduced in the analysis of the OWT towers the applicability of different probabilistic approaches may be limited. FORM, SORM, Monte Carlo Simulation are examples of well-established methodologies to estimate Pf. Nevertheless, alternative methodologies such as the directional simulation can be an even more efficient solution for the problem. This preliminary assessment of the probabilistic approaches enables further developments in reliability methodologies for the specific case of OWT towers.
KEY WORDS: Offshore wind turbine; Probabilistic analysis; Reliability assessment; Extreme values; Support structures.
1 INTRODUCTION
Offshore wind energy experienced an exponential growth in installed power since the beginning of the current century. While this growing trend is expected to continue, further growth of the sector imposes more demanding, complex and accurate engineering methods. At the same time, improvement of the techniques applied in the sector is necessary to unlock new breakthroughs that will enable it to become progressively more competitive as a source for generating energy.
Addressing the subjacent uncertainty of the variables involved in the analysis of Offshore Wind Turbines (OWT) gives the designer a new dimension of analysis. Perception of the statistical deviations experienced by the design variables, enables a more complete understating of the risk associated with the operation of an OWT.
The probabilistic analysis of OWT is not a new practice. In fact, with a brief analysis of the standards for designing OWT (IEC 61400 class [1], [2]) or some recommended guidelines (e.g. [3]) it is possible to infer that assessing uncertainty is a recurrent process inside the design chain. Although, a significant challenge still exists in this field to progressively improve the established techniques, and to develop new methodologies that address topics where the subject, uncertainty, is not yet accounted for.
When working on a particular OWT project, some ambiguity can be identified in the standards that rule the process. It is frequent for these to require the designer to produce a reliable design, leaving to his/her consideration the methodology applied for the effect. Also, application of deterministic design processes or safety coefficients that account for subjacent uncertainties is still a recurrent practice that leads to structural over-design.
The ultimate goal of a probabilistic assessment is to estimate the risk of failure of a certain system. The criteria for failure is established by the designer, and shall be justified based on physical or other types of coherent constraints.
When a probabilistic approach is used the risk is given by the system's probability of experiencing or exceeding a certain occurrence that is defined as a failure and is given by the probability of failure (𝑃𝑓). The Reliability Index (𝛽) is one of the most common indicators to measure the reliability of a system and relates directly to 𝑃𝑓 through equation (1).
𝑃𝑓 = 𝛷 (−𝛽) (1)
where Φ represents the standard normal cumulative distribution. The relation in equation (1) can be represented also as 𝑃𝑓 = 1 − 𝛷 (−𝛽) that gives the probability of exceedance the threshold for which quantity 𝛽 is representative.
Several studies summarized and discussed the way probabilistic methods are applied to wind turbines [4], [5]. Nevertheless, even considering the extensive work existing in the field, a similar reference discussion is still needed for the specific case of OWT support structures. Additionally, the mentioned ambiguity in the design guidelines motivates a comparative study between the techniques currently applied in the sector.
To address the proposed challenge an additional four sections were defined. Section 2 briefly explains the concept of reliability analysis, Section 3 presents some of the most relevant works on reliability when applied to OWT support structures and Section 4 identifies some of the relevant challenges in this field. Finally, the most relevant conclusions are presented in Section 5.
Comparative Analysis of the Probabilistic Methods to Estimate the Probability of
Failure of Offshore Wind Turbine Towers
Rui Teixeira1, Alan O’Connor1, and Maria Nogal1
2 RELIABILITY ASSESSMENT
Two dimensions of analysis are set when approaching the reliability of a system. One is related to the fluctuation of the external conditions that excite the system and usually are called the load model (𝐿); the other is related to the response of the system and how it varies, being frequently called the response model (𝑅). When analysing a physical system the complexity considered in each of the two dimensions will dictate the complexity of the global problem.
To assess a system failure the designer needs to identify the modes on how it may fail. For this, a physical representation of the system is needed and for each failure mode one main equation, usually called limit-state function (𝑔(𝑥), where 𝑥 represents a set of random variables), is defined to evaluate the occurrence of failure. This equation compares the load model considered 𝐿 with the respective resistance model 𝑅 and failure may occur when the 𝐿 surpasses 𝑅. This relation is usually expressed as 𝑔(𝑥) = 𝑅(𝑥) − 𝐿(𝑥), and failure occurs when 𝑔(𝑥) < 0.
Through the previous overview of the reliability analysis process is possible to understand that the complexity of the overall approach will depend on the level of complexity implemented on each of the models selected to evaluate 𝑅 and 𝐿. If the models are simple, no major limitations are found when applying a reliability methodology. But, in reality, this does not often occur. If we look to the specific case of OWT, it is straightforward to comprehend that, as a coupled system, the physics of it are quite complex. Therefore, fully addressing the probabilistic analysis of a system faces a significant challenge: if the analysis becomes too complex, the limit-state is highly non-linear and the methodologies applied to estimate its corresponding 𝑃𝑓 are either very time consuming or inaccurate.
These two aspects are quite significant when the whole context of analysis goes through optimization problems and extensive analysis where the time and accuracy are the main rulers of the process.
Two major types of assessment regarding system's limit state analysis and failure can be identified: Serviceability Limit State (SLS) or Ultimate Limit State (ULS). The current paper focuses on the application of reliability methodologies for OWT towers and support structures considering ULS and extreme events.
3 RELIABILITY ANALYSIS OF OWT TOWERS
Working with ULS and extreme events means working with events that have a low probability of occurrence and are usually located in the tails of the statistical distribution where the probability density function is low. Eventually, statistical extrapolation is almost inevitable for practical purposes. Regarding the structural analysis and with particular emphasis on the support structures, several studies can be highlighted dealing with ULS and their inherent necessity to consider extrapolation methodologies.
In [6] the comparison between applying probabilistic analysis and deterministic analysis when dealing with extreme values theory is addressed. In this comparison three methods to determine the distribution of extreme response, global maximum, peak over threshold and the process model, are used to establish the response with a return level of 100 years. The flap moment at the blade root and the overturning
moment at the sea bottom were analysed. The second is of particular interest when analysing OWT towers and support structures.
The response based approach is then compared to the external conditions approach. The differentiating factor between these two approaches is related to the way that long term occurrences are evaluated. The first approach uses the short-term response of the system to extrapolate the long-term response, whereas with the second approach, the external conditions are extrapolated and then, the response of the system is calculated for the respective previously extrapolated conditions.
To set the long term distributions of loads, the practice recommended in [1] for power production and commonly considered as the standard for the extrapolation of long-term loads, is integrating the short-term maximum conditional response with the joint probability of external random variables. This is done through the integral in equation (2).
𝑃(𝐿 > 𝑙𝑇) = ∫ 𝑃[𝐿 > 𝑙𝑇 𝑋
| 𝑋 = 𝑥] 𝑓𝑋(𝑥) 𝑑𝑥 (2) where 𝑃(𝐿 > 𝑙𝑇) is the probability of exceedance associated with a load 𝑙𝑇. To evaluate the integral, the conditional short-term exceedance distribution of the extreme response when certain external conditions 𝑥 are met 𝑃[𝐿 > 𝑙𝑇|𝑋 = 𝑥] is multiplied by the joint probability density function 𝑓𝑋(𝑥) and integrated over its parameters.
This method requires to set the short term distribution over the domain of the environmental random variables 𝑋 so that 𝑃[𝐿 > 𝑙𝑇|𝑋 = 𝑥] can be defined. This is usually done by analysing a number of 𝑛 extreme loads. The empirical load distribution function obtained is used to fit a parametric probability model.
Further, according to the standards it is usually assumed that the largest loads occur at widely separated times being thus statistically independent. The probability of the largest load 𝐿 exceeding a given load 𝑙 in the observation time 𝑇 is given by Equation (3) [7].
𝑃𝑟𝑜𝑏(𝐿 > 𝑙𝑇|𝑋) = 1 − (𝐹(𝑙|𝑋))𝑁 (3) where 𝑁 is the number of occurrences in the observation period 𝑇. Therefore, if an observation period of 1 year is considered 𝑇 = 1 and 𝐹(𝑙|𝑥) is the 10 minutes short term cumulative distribution of loads, N is the number of 10 minutes sea states that occur in a time interval of 1 year. With this assumption of independence, estimating the values for long return periods 𝑇𝑟 becomes straightforward and the application of Equation (3) simpler. For instance, if an observation period of 1 year is considered, the load 𝐿 associated with the cumulative value of 0.01 will have a 𝑇𝑟of 100 years.
With the 𝑅 and 𝐿 models defined, this methodology allows the analysis of 𝑔(𝑥) and its respective probability of being negative.
To tackle some of the limitations identified [8] introduces a methodology to extrapolate loads based on limited field data measured on an OWT installed in Blyth, United Kingdom. To estimate the long term load exceedance probabilities, bootstrap techniques are applied and the uncertainty generated by extrapolating long term loads based on limited field data is addressed. The parameter used as reference for analysis is the Mudline Bending Moment, which is the moment generated in the tower at seabed level.
Apart from the methodologies to settle distributions of maxima referred before [8] addresses also the application of the Block Maxima method to set the extreme values distributions.
Additionally, [9] evaluates the application of inverse First Order Reliability Methods (FORM). These methods have the particularity of being, when compared with the extrapolation of loads based on the integration of the conditional distribution of loads and the joint probability function, of more efficient implementation but fluctuating accuracy. Implementing a FORM in fact is the same as, instead of dealing with the real limit-state function, assuming that a linear equation will be a reasonable approximation to describe it. The analysis procedure involves the search for the point in the failure surface closest to the origin, approximation of the failure surface by a linear surface and consequent definition of a region away from the origin constrained by the linearized surface. The method can be applied also to search for all the points associated with a certain occurrence probability. It is then straightforward to understand that in some complex cases this methodology, despite its efficiency of application, can introduce significant errors in the analysis.
[image:3.595.306.554.312.402.2]The inverse variation of the FORM is related to the transformation that is applied to the variables to and from the normalized space, also known as Rosenblatt transformation [10]. In the inverse methodology, a transformation to the normalized space takes place to find the isoprobability lines, and then an inverse transformation is applied to the normal space where a more intuitive analysis is possible. One of the most well-known methods, which is also recommended in the IEC guidelines, is the Environmental Contour Method (EC) [11]. The EC method is applied to find sea states with similar probability of occurrence, e.g. 20 or 50 year return period, and search along the defined contour for the maximum load. All the occurrences in the contour will have the same long term probability of occurrence, Figure 1.
Figure 1 - Example of EC method applied to extrapolation of 50 years met-ocean conditions [2].
On the left side the normalized space is represented, where the contour of interest can be picked by using the value of the radius 𝛽. 𝑈1 and 𝑈2 are the variables of interest (significant wave height - 𝐻𝑠 and wind velocity - 𝑉) in the normalized space. On the right side the EC is shown after the inverse
transformation. The method disregards the fluctuations of response of the OWT for given met-ocean parameters.
In [12] the results of the EC method for a OWT are compared with the full integration presented in Equation (3).
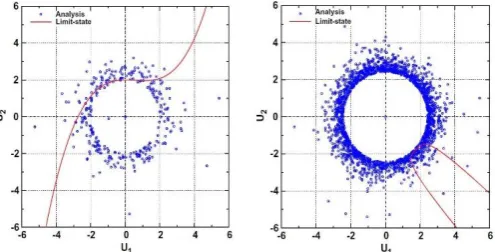
One of the alternatives to bypass the limitation of not considering the variability in the response is applied in [13] by using a three-dimensional inverse FORM analysis. By introducing the variability of the response a new variable is added and the analysis occurs in a three-dimensional space, Figure 2. This implies the added work of defining the full probability distribution of the turbine extreme loads through simulations. The problem, is then very similar to the one to be solved by the direct integration method, but, here estimating the probability of failure is achieved by searching in a 3-D space for the most likely point associated with the failure function and target 𝑃𝑓. On the left side is possible to see the normalized three-dimensional space of variables and on the right side the real space of variables after the inverse transformation. Instead of a single contour that averages the response, the result is a three-dimensional contour that accounts for its uncertainty.
Figure 2 - 3D Inverse FORM methodology example [9]. Using a three-dimensional approach comes with obvious increased effort and complexity.
As an alternative for very complex 𝑔(𝑥) functions, a higher order function to approximate 𝑔(𝑥) can be applied. This is the case when the FORM approximation is increased by one order generating then a Second Order Reliability Method (SORM). Again, when applying the SORM methodology, a trade-off between the gains in accuracy and increase in the analysis and complexity needs to be carefully addressed.
Standing in between these two methodologies one can find EC methods with corrections to account for the variability of the loads. These seek to balance the efficiency and accuracy offered by the two methods. The limitation of the EC method was firstly discussed in [11], and, in the same paper the method is introduced, a suggestion for the implementation of an inflated contour that mitigates the influence of using a median load value is given. Later, in [14], this problem is further discussed and some quantities are derived to account for the response variability.
[image:3.595.43.290.583.666.2]Recently, in [16] a work on reducing the number of simulations needed for analysing OWT supports structures under extreme ocean environmental loads is presented. To achieve this the analysis of the reliability was developed with basis on the formulation of a peak response factor (PRF). This PRF in addition with the static response of the system is used to normalize the peak response (𝑅𝑝). The 𝑅𝑝 is the variable used to evaluate 𝑔(𝑥) and is set as a function of the design variables 𝑋. This normalization intends to make the peak response independent of the design parameters, simplifying the application of reliability methodologies like the FORM.
Sampling methods are an efficient alternative to the analytical methods presented. Monte Carlo Simulation (MCS) is perhaps the most well-known sampling method. While sampling methods are exact as they estimate the real probability of failure, they can be, when searching for an occurrence that has very low probability, prohibitive in the time needed to achieve results.
Strategies to reduce the computational time used in MCS when applied to OWT are evaluated in [17]. In this case a Tension-Leg-Platform is examined and FORM is used to reduce the simulation time of the MCS.
It was highlighted before that the standards for the design of OWT present two major kinds of analysis: the ULS and SLS. This major division originated a standard definition of different design load cases (DLC) that cover the different expected circumstances experienced by OWT. A table resuming OWTs expected DLC can be found in [2].
When following the design standards and guidelines, applying probabilistic analysis to OWT and extrapolating long term loads, the response of the system is addressed and the process generally involves, due to the fact that one is addressing a complex system, the evaluation of different response variables (𝐹_𝑥, 𝑀_𝑥, 𝐹_𝑦, 𝑀𝑦, . .., where 𝐹 stands for load and 𝑀 for moment with the respective Cartesian index 𝑥, 𝑦, 𝑧) for the different DLC. Analysis of the different OWT loads in an univariate way is a frequent practice and tends to overestimate the design of the OWT. But, in reality, it is very likely for the extreme responses of the cited variables to not occur simultaneously. According to [18] during the design process considering simultaneous extremes is still a practice that leads to over design of OWT for the specific case of ULS analysis. Based on it, a methodology based on Pareto-optimal loads is proposed there to tackle the conservative design resulting from the univariate maxima consideration.
4 NEW CHALLENGES ON RELIABILITY OF OWT SUPPORT STRUCTURES
The previous sections were focused on the extrapolation of short-term and long-term environmental averaged occurrences or short-term and long-term time responses based on random external conditions. Although, the codes to design OWT also stipulate the evaluation of individual extreme occurrences (e.g. wave heights in DLC1.6 or DLC6.1c). Defining the long term individual occurrences brings an additional order of complexity to the problem. It is recommended the usage of appropriate site measurements to set the long term individual occurrences. As result an extreme individual occurrence conditional on a known averaged occurrence is defined. The data needed to specifically address this issue is generally limited since it is not common for the monitoring equipment to record full time series when assessing long term
measurements. Again, this limitation is one of the causes of difficulty in inferring about the probability of simultaneous occurrence of individual events (e.g. extreme gust and extreme individual wave height combined). Evaluating the referred conditional probability can be difficult and time consuming, impelling the designer to use the deterministic design conditions given in the code for estimating the individual wave height or wind gust velocity. This results eventually in a potential contribution for the over-design of an OWT tower.
Most of the works in the probabilistic assessment of OWT towers were derived under the assumption that for a pitch controlled OWT the maximum loads occur in operating conditions. Application of alternative probabilistic techniques as the ones described still needs to be addressed for parked, start-up and shut-down states.
Moreover, when physical simulation is used to estimate long term loads in the offshore environment the theories used for the effect can be quite limiting in some aspects. One of these, that is of particular interest, is when the steepness of the waves gets so high that the common theory used to model waves becomes invalid to describe them. The effect of this higher order physical phenomena on the estimation of extreme response was evaluated before for the case of an OWT mono-pile foundation [9]. Considerations for breaking waves that may cause high loads in the support structure are given in the standards [2] [3]. Their effect in OWT towers was addressed before, an overview is given on [19].
Although some work was identified, the effect of wave theories up to 5𝑡ℎ order and breaking waves on long term statistics and respective calculation of system failures for ULS needs to be further addressed in the future.
It is important to highlight that dissociating the analysis OWT towers from the support structure is not a correct approach. When looking at the towers, these need to be seen as a joint structure with the mono-pile, the jacket, the gravity base or in case of floating structures, the Spar, the Tension-Leg-Platform or the semi-submersible foundation.
Techniques applied in the past to address the probabilistic design of OWT towers were presented. Yet, alternative methodologies, whose applicability for OWT towers was not analysed, are available and are of interest to consider during future developments in this field of structural reliability analysis.
It is very difficult for alternative methodologies to compete with FORM and SORM when it comes to the accuracy-effort ratio. With the current trends of progress in the computational field it is expected for the gap in time requirements to complete a reliability analysis existing between methodologies that are highly accurate, sampling methodologies or directional simulation, and that calculate the results fast, like FORM, to decrease. It is very likely then for their application to widen, which may unlock new practices in the reliability analysis of OWT towers.
Despite showing high potential and taking into account the response variability, it is expected for the first order approximation to introduce some errors in the results that grow progressively as the complexity of the analysis increases.
Figure 3 - Limit State 𝑔(𝑥) and its approximation with the Directional Integration Method [20].
A potential methodology that was not evaluated for OWT towers is the directional simulation. The directional simulation has the particularity of very accurately approximating the probability of surpassing a defined limit state by its real probability. This methodology identifies a series of directions for integration, which are integrated either by approximation or closed-form and evaluated to estimate 𝑃𝑓 by a weighted average of the directional integrals, (see Figure 3). An example of directional integration for structural reliability analysis and estimation of the 𝑃𝑓 can be identified in [20].
The directional simulation mitigates the recurrent limitation of dealing with very highly non-linear limit states, but its accuracy and efficiency are highly dependent on the procedure and directions used for integration [20].
When it comes to sampling techniques, MCS is probably the most widely applied sampling methodology, but, as mentioned, when 𝑃𝑓 is very small its application can be prohibitive. The sampling analysis time can be cut off with hybrid techniques like the radial-based importance sampling (RBIS). As the name indicates, radial-based importance sampling consists in eliminating parts of the domain that are known, and focusing the analysis on the region of interest. This methodology, introduced in [21], is adapted and combined with directional methods to analyse structural reliability in [22]. A graphical example illustrating the method can be seen in Figure 4.
Figure 4 - Example of adaptive RBIS presented in [22].
The methodology is implemented by excluding the safe part of the domain from the sampling process. The sampling domain is reduced and therefore the computational time needed to calculate the probability of occurrence of a certain event, which in our case is the 𝑃𝑓.
The control actions applied to OWT are very likely to have a significant impact on the estimation of ULS and extreme loading. In particular, reliability based approach that accounts for variations of the extreme distribution tails as function of control actions are a field of particular growing interest.
Another field of growing interest is the optimization of OWT. In [23] an overview of the optimization processes for OWT is presented. Here, it is highlighted how the probabilistic optimization is an order of magnitude more complex than more common optimization methods which are extensively exploited in the article. In the recommendations, a strong emphasis is given to the optimization processes through reliability-based designs. Even considering that these are more difficult and time-consuming, they allow a clearer, better defined optimization problem and exploit eventual uncertainties that translate to the safety margins and block some of the potential for optimization.
An interesting question underlined is on how new computational methods (e.g. probability evolution algorithms or computational methods inspired by biological systems such as; genetic algorithms and evolutionary programming) may relate to the reliability based design.
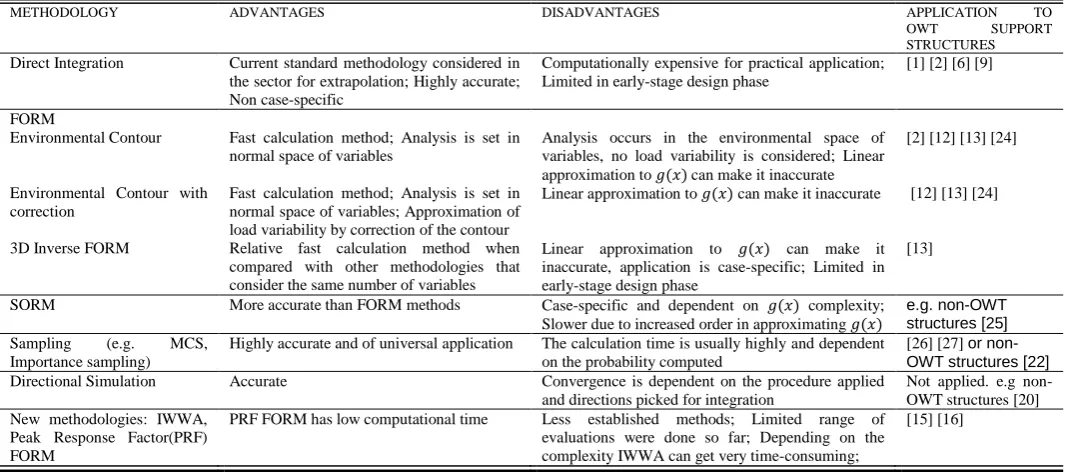
Table 1 presents a comparative summary of the reliability analysis of OWT support structures. The main advantages and disadvantages of each methodology are summarized.
5 CONCLUSION
A detailed literature review has been carried out and some of the previous works developed to evaluate OWT support structures and their risk of failure were discussed in the present paper. Additionally, some methodologies to assess the structural reliability of OWT support structures analysed and discussed. It was inferred that the problem of designing OWTs is commonly divided into two big spheres of extreme values theory analysis: the loading and the response dimensions.
It was seen that until now direct integration and FORM were the methodologies more frequently applied to develop a reliable analysis of OWT under extreme occurrences. In the context of establishing a basis of work for further steps in the probabilistic assessment of OWT and support structures, alternative methodologies and challenges demanded by the sector were identified.
The present paper intends therefore to set a reference point for further assessment of the subject. Despite, as shown before, being a sector for which several recommendations and guidelines were developed there is still a shortage of an accepted well around best practice that takes the designer or researcher step-by-step in the process of probabilistically assessing OWT towers and support structures. The main strategic challenge for the probabilistic assessment of OWT support structures will be to converge and balance further research developments under the lack of a global accepted procedure so that an unified field of reliability based design is established and accepted.
[image:5.595.42.290.624.750.2]Table 1 - Reliability Methods for OWT support structure analysis
METHODOLOGY ADVANTAGES DISADVANTAGES APPLICATION TO
OWT SUPPORT STRUCTURES Direct Integration Current standard methodology considered in
the sector for extrapolation; Highly accurate; Non case-specific
Computationally expensive for practical application; Limited in early-stage design phase
[1] [2] [6] [9]
FORM
Environmental Contour Fast calculation method; Analysis is set in normal space of variables
Analysis occurs in the environmental space of variables, no load variability is considered; Linear approximation to 𝑔(𝑥) can make it inaccurate
[2] [12] [13] [24]
Environmental Contour with correction
Fast calculation method; Analysis is set in normal space of variables; Approximation of load variability by correction of the contour
Linear approximation to 𝑔(𝑥) can make it inaccurate [12] [13] [24]
3D Inverse FORM Relative fast calculation method when compared with other methodologies that consider the same number of variables
Linear approximation to 𝑔(𝑥) can make it inaccurate, application is case-specific; Limited in early-stage design phase
[13]
SORM More accurate than FORM methods Case-specific and dependent on 𝑔(𝑥) complexity; Slower due to increased order in approximating 𝑔(𝑥)
e.g. non-OWT structures [25] Sampling (e.g. MCS,
Importance sampling)
Highly accurate and of universal application The calculation time is usually highly and dependent on the probability computed
[26] [27] or non- OWT structures [22] Directional Simulation Accurate Convergence is dependent on the procedure applied
and directions picked for integration
Not applied. e.g non-OWT structures [20] New methodologies: IWWA,
Peak Response Factor(PRF) FORM
PRF FORM has low computational time Less established methods; Limited range of evaluations were done so far; Depending on the complexity IWWA can get very time-consuming;
[15] [16]
ACKNOWLEDGMENTS
This project has received funding from the European Union Horizon 2020 research and innovation programme under the Marie Sklodowska-Curie grant agreement No. 642453
.
REFERENCES
[1] IEC, "Wind turbines part 1: Design requirements," 2005.
[2] IEC, "Wind turbines part 3: Design requirements for offshore wind turbines," 2009.
[3] DNV, "Design of offshore wind turbine structures. Offshore Standard DNV-OS-J101," DNV GL AS, 2014.
[4] J. Wen, Y. Zheng, and F. Donghan, "A review on reliability assessment for wind power," Renewable and Sustainable Energy Reviews, no. 13(9):2485–2494, 2009.
[5] N. B. Negra, O. Holmstrøm, B. Bak-Jensen, and P. Sorensen, "Aspects of relevance in offshore wind farm reliability assessment," Energy Conversion, IEEE Transactions on, no. 22(1):159–166, 2007.
[6] P. Cheng, G. J. W. van Bussel, G. A. M. van Kuik, and J. H. Vugts, "Reliability-based design methods to determine the extreme response distribution of offshore wind turbines," Wind Energy, no. 6(1):1–22, 2003.
[7] E. Gumbel, Statistics Extremes, Columbia Univ. Press, 1958.
[8] P. Agarwal and L. Manuel, "Extreme loads for an offshore wind turbine using statistical extrapolation from limited field data," Wind Energy, no. 11(1):673–684, 2008.
[9] P. Agarwal, Structural reliability of offshore wind turbines, PhD thesis, The University of Texas at Austin, 2008.
[10] Rosenblatt M., "Remarks on a multivariate transformation," Annals of Mathematical Statistics, no. 23(2):470–472, 1952.
[11] S. R. Winterstein, T. C. Ude, C. A. Cornell, P. Bjerager, and S. Haver, "Environmental parameters for extreme response: Inverse FORM with omission factors," in In Proc. 6th Int. Conf. on Structural Safety and Reliability, Innsbruck, Austria, 1993.
[12] K. Saranyasoontorn and M. Lance, "On assessing the accuracy of offshore wind turbine reliability-based design loads from the environmental contour," International Journal of Offshore and Polar Engineering, no. 15(02), 2005.
[13] P. Agarwal and L. Manuel, "Simulation of offshore wind turbine response for long-term extreme load prediction," Engineering structures,
no. 31(10):2236–2246, 2009.
[14] S. R. Winterstein and K. Engebretsen, "Reliability-based prediction of
design loads and responses for floating ocean structures," in In 27th International Conference on Offshore Mechanics and Arctic Engineering, Lisbon, Portugal, 1998.
[15] K. Wei, S. R. Arwade, and A. T. Myers, "Incremental wind-wave analysis of the structural capacity of offshore wind turbine support structures under extreme loading," Engineering Structures, no. 79:58– 69, 2014.
[16] D. H. Kim and S. G. Lee, "Reliability analysis of offshore wind turbine support structures under extreme ocean environmental loads,"
Renewable Energy, no. 79:161–166, 2015.
[17] J. J. Jensen, A. S. Olsen, and A. E. Mansour, "Extreme wave and wind response predictions," Ocean engineering, no. 38(17):2244–2253, 2011. [18] M. Muskulus, "Pareto-optimal evaluation of ultimate limit states in offshore wind turbine structural analysis," Energies, no. 8(12):14026– 14039, 2015.
[19] M. A. Chella, A. Tørum, and D. Myrhaug, "An overview of wave impact forces on offshore wind turbine substructures," Energy Procedia, no. 20:217–226, 2012.
[20] J. Nie and B. R. Ellingwood, "Directional methods for structural reliability analysis," Structural Safety, no. 22(3):233–249, 2000. [21] A. Harbitz, "An efficient sampling method for probability of failure
calculation," Structural safety, no. 3(2):109–115, 1986.
[22] F. Grooteman, "Adaptive radial-based importance sampling method for structural reliability," Structural Safety, no. 30(6):533–542, 2008. [23] M. Muskulus and S. Schafhirt, "Design optimization of wind turbine
support structures - -a review," Journal of Ocean and Wind Energy, no. 1(1):12–22, 2014.
[24] K. Saranyasoontorn and M. Lance, "Design loads for wind turbines using the environmental contour method," Journal of Solar Energy Engineering, no. 128(4):554–561, 2006.
[25] A. Der Kiureghian, H.Z. Lin, and S. J. Hwang., "Second-order reliability approximations," Journal of Engineering Mechanics, no. 113(8):1208– 1225, 1987.
[26] A. Naess, O. Gaidai, and S. Haver, "Efficient estimation of extreme response of drag-dominated offshore structures by Monte Carlo simulation," Ocean Engineering, no. 34(16):2188–2197, 2007. [27] N. Saha, Z. Gao, T. Moan, and A. Naess, "Short-term extreme response
analysis of a jacket supporting an offshore wind turbine," Wind Energy,
![Figure 2 - 3D Inverse FORM methodology example [9].](https://thumb-us.123doks.com/thumbv2/123dok_us/964008.609614/3.595.306.554.312.402/figure-d-inverse-form-methodology-example.webp)