Gupta MN, Kaul D, Guoqiang D, Dissing U and Mattias-son B (1996) AfRnity precipitation of proteins.Journal of Molecular Recognition9: 356}359.
Hogan Jr, JC (1996) Directed combinatorial chemistry. Nature384: 17}19.
Kaster JA, de Oliveira W, Glasser W and Velander WH (1993) Optimization of pressure-Sow limits, strength, intraparticle transport and dynamic capacity by hydro-gel solids content and bead size in cellulose immunosor-bents.Journal of Chromatography A648: 79}90. Lowe CR, Burton SJ, Burton NP, Alderton WK, Pitts JM
and Thomas JA (1992) Designer dyes: ‘biomimetic’ ligands for the puriRcation of pharmaceutical proteins by afRnity chromatography.Tibtech10: 442}448. McCreath GE and Chase HA (1996) Applications of
per-Suorocarbon afRnity emulsions for the rapid isolation of Staphylococcus aureus. Biotechnology Progress 12: 77}83.
Markland W, Ley AC and Ladner RC (1996) Iterative optimization of high-afRnity protease inhibitors using
phage-display. 2. Plasma kallikrein, and thrombin. Bio-chemistry35: 8045}8057.
Orthner CL, Highsmith FA, Tharakan J, Madurawe RD, Morcol T and Velander WH (1991) Comparison of the performance of immunosorbents prepared by site-di-rected or random coupling of monoclonal antibodies. Journal of Chromatography558: 55}70.
Pingali A, McGuinness B, Keshishian H, Fei-Wu J, Varady L and Regnier F (1996) Peptides as afRnity surfaces for protein puriRcation.Journal of Molecular Recognition 9: 426}432.
Roberts BL, Markland W, Ley AC, Kent RB, White DW, Guterman SK and Ladner RC (1992) Directed evolution of a protein: Selection of potent neutrophil elastase in-hibitors displayed on M13 fusion phage.Proceedings of the National Academy of Sciences USA89: 2429}2433. Velander WH, Subramanian A, Madurawe RD and Or-thner CL (1991) The use of Fab-masking antigens to enhance the activity of immobilized antibodies. Biotech-nology Bioengineering39: 1013}1023.
ESSENTIAL GUIDES TO METHOD
DEVELOPMENT IN CAPILLARY
ELECTROPHORESIS
S. K. Poole, Parke-Davis Pharmaceutical
Research, Division of Warner-Lambert Company, Ann Arbor, MI, USA
C. F. Poole, Wayne State University,
Detroit, MI, USA
Copyright^ 2000 Academic Press
Introduction
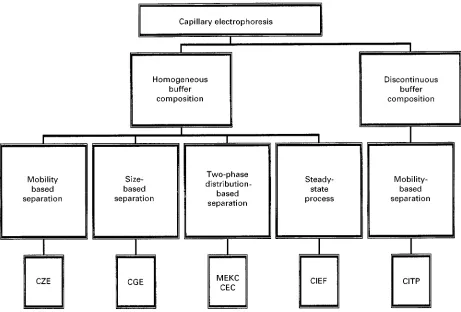
Capillary electrophoresis encompasses a number of related separation approaches, some of which are adapted to the requirements of speciRc applications (Figure 1). They share in common the use of electro-lyte solutions as mobile phase, the use of capillary tubes as the separation column, and the use of an electricReld to induce sample and mobile phase trans-port. This allows a similar instrument platform to service all capillary electrophoretic separation tech-niques with only minor modiRcations for speciRc applications. Detection is usually by UV-visible ab-sorption through the fused silica capillary wall, or occasionally bySuorescence, electrochemical or mass spectrometric detection. Contemporary instruments are also highly automated for ease of use and im-proved control of critical experimental variables.
ClassiRcation of capillary electrophoretic tech-niques according to their usual applications is given in Table 1. These techniques can be considered as
Figure 1 Classification of capillary electrophoretic separation methods based on buffer type and mechanism. CZE"capillary zone electrophoresis; CGE"capillary gel electrophoresis; MEKC"micellar electrokinetic chromatography; CEC"capillary electro-chromatography; CIEF"capillary isoelectric focusing; and CITP"capillary isotachophoresis.
largely proteins, requiring special buffers to generate a continuous pH gradient. Capillary isotachophoresis (CITP) is not widely used for separations, it can be rather difRcult and tedious to optimize, and yields an integral signal that is different to other separation techniques. Many samples that can be separated by capillary isotachophoresis can also be separated by other electrophoretic techniques more familiar to separation chemists. It isRnding increas-ing use to preconcentrate ions for separation by capil-lary zone electrophoresis. With this framework in mind we propose to provide general guidelines for method development in capillary zone electrophor-esis, micellar electrokinetic chromatography, and gel electrophoresis with only comments and brief instruc-tions applicable to the other capillary electrophoretic techniques.
Sample Suitability
Table 1 provides a general guide to method selection by analogy to established applications. For bio-polymers capillary electrophoretic techniques often select themselves, for other compounds the capillary
electrophoretic techniques have to be considered in terms of suitability drawn against other existing chromatographic methods. Reasonable solubility in aqueous solution is required for most separation modes. Non-aqueous capillary electrophoresis is little developed (although promising) and techniques such as micellar electrokinetic chromatography can separ-ate hydrophobic compounds but provide little selec-tivity. Gas chromatography is usually a better choice for the separation of volatile hydrophobic com-pounds. High pressure liquid chromatography is often a better choice when low level detection, struc-tural elucidation by mass spectrometry or prepara-tive-scale separations are required. The concentration sensitivity of the capillary electrophoretic techniques using UV-visible absorption detection is limited by the small cross column pathlength and small injection volumes to solutions containing at least 1}10g mL\1and for ease of operation 0.1 mg mL\1
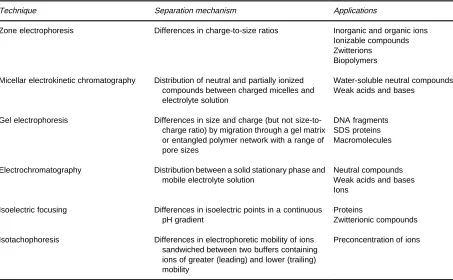
Table 1 Common separation methods using capillary electrophoretic techniques
Technique Separation mechanism Applications
Zone electrophoresis Differences in charge-to-size ratios Inorganic and organic ions
Ionizable compounds Zwitterions
Biopolymers
Micellar electrokinetic chromatography Distribution of neutral and partially ionized compounds between charged micelles and electrolyte solution
Water-soluble neutral compounds Weak acids and bases
Gel electrophoresis Differences in size and charge (but not
size-to-charge ratio) by migration through a gel matrix or entangled polymer network with a range of pore sizes
DNA fragments SDS proteins Macromolecules
Electrochromatography Distribution between a solid stationary phase and
mobile electrolyte solution
Neutral compounds Weak acids and bases Ions
Isoelectric focusing Differences in isoelectric points in a continuous
pH gradient
Proteins
Zwitterionic compounds
Isotachophoresis Differences in electrophoretic mobility of ions
sandwiched between two buffers containing ions of greater (leading) and lower (trailing) mobility
Preconcentration of ions
restrictions it is obvious that many sample types and problems can be handled by capillary electrophoretic techniques accounting for its expanding use in ana-lytical chemistry.
Selecting System Variables
Virtually all separations are carried out in fused silica capillary columns 50}100m internal diameter and up to 1-m long. Large-bore capillaries provide greater loading capacity and a higher detector response be-cause of the longer pathlength (on-column detection) but generate larger currents and are less efRcient at heat dissipation. Small-diameter columns show increased adsorption character due to their larger inner surface area-to-volume ratio but provide more efRcient heat dissipation. If detection limits are not a problem, then a small inner diameter column should be used. The choice of capillary length is a compromise between speed (short columns) and separation capacity (long columns). Unless the separ-ation is unusually complicated capillaries should be short (25}50 cm). When a new capillary is put into use or is suspected of being contaminated, a conditioning procedure is required. Washing with a solution of sodium hydroxide, water, and buf-fer as indicated in Table 2 is normally sufRcient. Capillaries with an interior coating are used to alter electroosmotic Sow or to minimize analyte
ad-sorption by the capillary wall, particularly for macromolecules. Electroosmotic Sow is optimized to obtain useful separations in MEKC and CEC, is often used to improve separations and total sample detection for ions of opposite charge in CZE, but is usually undesirable in CGE, CIEF and CITP. So it is in the later techniques that capillaries with chemically bonded or physically adsorbed coatings are used.
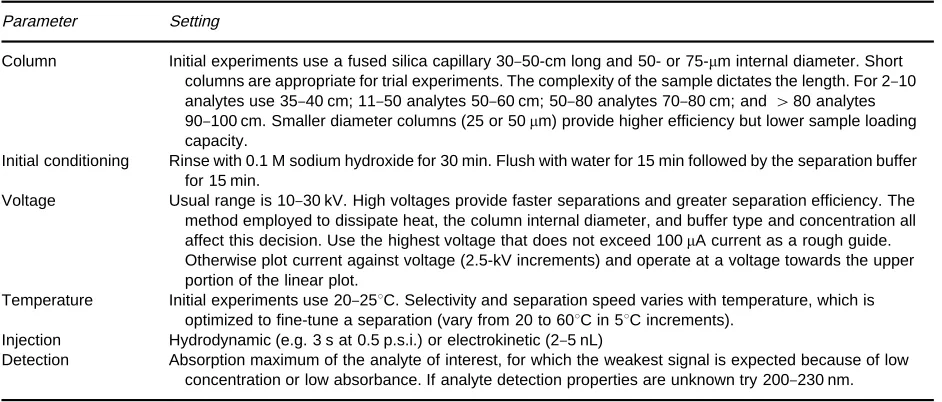
Table 2 A guide for selecting initial conditions in capillary electrophoretic separations
Parameter Setting
Column Initial experiments use a fused silica capillary 30}50-cm long and 50- or 75-m internal diameter. Short columns are appropriate for trial experiments. The complexity of the sample dictates the length. For 2}10 analytes use 35}40 cm; 11}50 analytes 50}60 cm; 50}80 analytes 70}80 cm; and'80 analytes 90}100 cm. Smaller diameter columns (25 or 50m) provide higher efficiency but lower sample loading capacity.
Initial conditioning Rinse with 0.1 M sodium hydroxide for 30 min. Flush with water for 15 min followed by the separation buffer for 15 min.
Voltage Usual range is 10}30 kV. High voltages provide faster separations and greater separation efficiency. The method employed to dissipate heat, the column internal diameter, and buffer type and concentration all affect this decision. Use the highest voltage that does not exceed 100A current as a rough guide. Otherwise plot current against voltage (2.5-kV increments) and operate at a voltage towards the upper portion of the linear plot.
Temperature Initial experiments use 20}253C. Selectivity and separation speed varies with temperature, which is optimized to fine-tune a separation (vary from 20 to 603C in 53C increments).
Injection Hydrodynamic (e.g. 3 s at 0.5 p.s.i.) or electrokinetic (2}5 nL)
Detection Absorption maximum of the analyte of interest, for which the weakest signal is expected because of low concentration or low absorbance. If analyte detection properties are unknown try 200}230 nm.
nearly acceptable separations. Subambient temper-atures are not commonly used, as they are less convenient and result in poorer kinetic separation properties.
In general, the sample should be prepared such that the analytes of interest are present in a suitable solu-tion, free from interferences, and at an appropriate concentration for detection. The ionic strength of the sample should be no greater than that of the buf-fer, with a more or less similar pH to the bufbuf-fer, and free of matrix problems associated with column wall adsorbing materials and particle matter. For the best peak shapes and resolution the concentration of the injected sample should be about 100 times lower than the concentration of the buffer. Syringe
Rlters for particle removal and ion exchange mem-braneRltration devices to reduce excessive concentra-tions of common matrix ions are available. Proteins and similar macromolecules, if not of interest to the analysis, should be precipitated prior to separation to minimize column fouling. Analytes of low water solu-bility may have to be dissolved in a water-miscible organic solvent or mixture of organic solvent and separation buffer. For other samples it is com-mon practice to dissolve the sample in the run buf-fer, a diluted solution of the run bufbuf-fer, or water. Samples are introduced into the separation capillary by hydrodynamic or electrokinetic injection. Both methods provide reproducible injection volumes but sampling bias is associated with electrokinetic injec-tion, which injects increasing amounts of sample components in proportion to their mobility. Hy-drodynamic injection is not suitable for CEC and CGE because of the high Sow resistance of packed columns.
Capillary Zone Electrophoresis
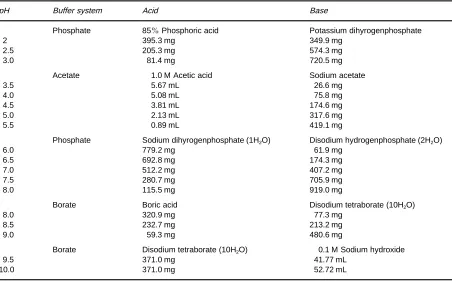
Once the system variables are set within reasonable ranges the parameters that have most effect on migration times and selectivity are the composition, concentration and pH of the run buffer and the presence of additives, if used, to provide additional selectivity optimization. For a good separation by CZE four features are important: (i) the individual mobilities of the analytes must be different; (ii) the background electrolyte must be homogeneous and theReld strength uniform along the column; (iii) neither analytes nor matrix components must interact with the column wall; and (iv) the conductivity of the buffer must substantially exceed the total con-ductivity of the sample components. Suitable com-mon buffer recipes for a wide pH range are given in Table 3. Additional buffers with their pKa and
anion mobility values are given inTable 4.
Ionic strength and pH greatly affect selectivity and separation time and should be course tuned in initial screening experiments. Low pH is favourable for separating anions (all anions are less mobile) and a high pH is preferred for cation separations. The practical pH range is limited roughly to between 2 and 12. If the pKa of the sample components is
known or can be reasonably estimated, pH optimiza-tion should start with a pH+pKa. Weak acids and
Table 3 Recipes for preparing some common electrophoretic buffers (100 mL of 60 mM buffer)
pH Buffer system Acid Base
Phosphate 85%Phosphoric acid Potassium dihyrogenphosphate
2 395.3 mg 349.9 mg
2.5 205.3 mg 574.3 mg
3.0 81.4 mg 720.5 mg
Acetate 1.0 M Acetic acid Sodium acetate
3.5 5.67 mL 26.6 mg
4.0 5.08 mL 75.8 mg
4.5 3.81 mL 174.6 mg
5.0 2.13 mL 317.6 mg
5.5 0.89 mL 419.1 mg
Phosphate Sodium dihyrogenphosphate (1H2O) Disodium hydrogenphosphate (2H2O)
6.0 779.2 mg 61.9 mg
6.5 692.8 mg 174.3 mg
7.0 512.2 mg 407.2 mg
7.5 280.7 mg 705.9 mg
8.0 115.5 mg 919.0 mg
Borate Boric acid Disodium tetraborate (10H2O)
8.0 320.9 mg 77.3 mg
8.5 232.7 mg 213.2 mg
9.0 59.3 mg 480.6 mg
Borate Disodium tetraborate (10H2O) 0.1 M Sodium hydroxide
9.5 371.0 mg 41.77 mL
10.0 371.0 mg 52.72 mL
ions based on differences in their charge-to-size ratio. When partially ionized the ions migrate with an effective mobility that changes between the two extreme values in a sigmoid fashion as the pH is varied (Figure 2). Ions may be separated in their fully ionized form or partial ionized form as a matter of circumstance; that is, at those conditions that maxi-mizes the difference in charge-to-size ratios. Be-cause changes in mobility tend to be large for par-tially ionized solutes small pH changes (0.1}0.5 pH units, or smaller for complex mixtures) are used to optimize the separation.
If the pKavalues for a sample are unknown,
con-duct initial separations in a series of buffers at or near pH 2.5, 4.0, 5.5, 7.0, 8.5 and 10 (see Table 3 for appropriate buffers). To obtain reproducible re-sults over the pH range 4 to 7, careful column condi-tioning is important. From the plot of the effec-tive mobility against pH identify the most promising pH range for the separation. Optimization then pro-ceeds in smaller changes in pH units as before.
To optimize the buffer concentration initial experiments are performed with a concentration of 30}100 mM for 50-m internal diameter columns and 20}50 mM with 75-m internal diameter col-umns. Lower ionic strength buffers are used to obtain faster separations, when selectively is high, and to separate simple mixtures containing a few
analytes. Higher ionic strength buffers are used for the separation of complex mixtures or to separate analytes with small differences in their elec-trophoretic mobility. If stacking is used to enhance analyte detectability then the difference in ionic strength between the buffer (high ionic strength) and the sample should be maximized. From Table 4 inorganic buffers are likely to provide better peak shapes for high mobility ions and Good-type (zwitterionic) buffers for low mobility ions. Zwitterionic buffers are useful for many applica-tions where a high concentration and buffering capacity is desirable because of their low speciRc conductivity, which allows more favourable kinetic separation conditions to be employed.
For difRcult separations the selectivity can be further modiRed by employing secondary chemical equilibria and solvation effects by adding appro-priate reagents or solvents to the electrolyte system (Table 5). Increasing the ionic strength of the electro-lyte by adding salts such as potassium sulfate modiRes the charge and/or conformation of proteins and re-duces wall interactions. Metal cations such as Cu2#,
Zn2#, Ca2# coordinate to proteins and peptides
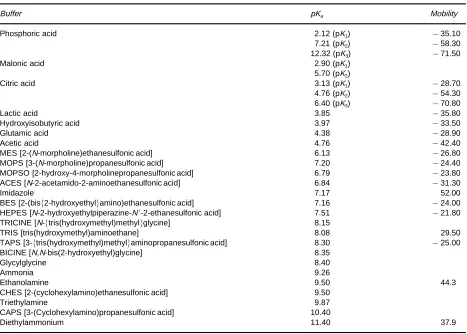
Table 4 Suitable buffers for capillary electrophoresis. Mobility values are at zero ionic strength and 253C (in 10\9m2V\1s\1)
Buffer pKa Mobility
Phosphoric acid 2.12 (pK1) !35.10
7.21 (pK2) !58.30
12.32 (pK3) !71.50
Malonic acid 2.90 (pK1)
5.70 (pK2)
Citric acid 3.13 (pK1) !28.70
4.76 (pK2) !54.30
6.40 (pK3) !70.80
Lactic acid 3.85 !35.80
Hydroxyisobutyric acid 3.97 !33.50
Glutamic acid 4.38 !28.90
Acetic acid 4.76 !42.40
MES [2-(N-morpholine)ethanesulfonic acid] 6.13 !26.80
MOPS [3-(N-morpholine)propanesulfonic acid] 7.20 !24.40
MOPSO [2-hydroxy-4-morpholinepropanesulfonic acid] 6.79 !23.80
ACES [N-2-acetamido-2-aminoethanesulfonic acid] 6.84 !31.30
Imidazole 7.17 52.00
BES [2-(bis2-hydroxyethylamino)ethanesulfonic acid] 7.16 !24.00
HEPES [N-2-hydroxyethylpiperazine-N-2-ethanesulfonic acid] 7.51 !21.80
TRICINE [N-tris(hydroxymethyl)methylglycine] 8.15
TRIS [tris(hydroxymethyl)aminoethane] 8.08 29.50
TAPS [3-tris(hydroxymethyl)methylaminopropanesulfonic acid] 8.30 !25.00
BICINE [N,N-bis(2-hydroxyethyl)glycine] 8.35
Glycylglycine 8.40
Ammonia 9.26
Ethanolamine 9.50 44.3
CHES [2-(cyclohexylamino)ethanesulfonic acid] 9.50
Triethylamine 9.87
CAPS [3-(Cyclohexylamino)propanesulfonic acid] 10.40
Diethylammonium 11.40 37.9
Figure 2 Separation of two hypothetical weak acids as a func-tion of pH by capillary zone electrophoresis.
adsorption/desorption interactions with the column wall cause peak broadening and tailing and irrevers-ible adsorption leads to modiRcation of the capillary wall. These problems are caused by electrostatic or hydrophobic interactions between macromolecules
(usually) and the column wall. Solutions to this prob-lem include using extreme pH buffers, high ionic strength electrolytes, and by using dynamic or chem-ically bonded wall-coated capillaries. There are no universal solutions and effective methods have to be tailored to the properties of the analyte. Buf-fer additives are usually used at concentrations of 5}60 mM except for modiRcation of the ionic strength of the electrolyte where much higher concen-trations are often required (e.g. 50}250 mM). Urea, which forms hydrogen-bond complexes with pro-teins and peptides, but is nonionic, is often used at concentrations of 7 M. The separation of metal cations (alkaline earths, transition metals and lan-thanides) is difRcult because of their similar ionic conductance. In this case complexing agents, such as
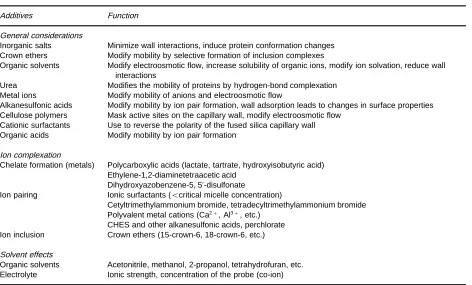
[image:6.568.57.274.494.681.2]Table 5 Secondary equilibria used to optimize selectivity in capillary electrophoresis
Additives Function
General considerations
Inorganic salts Minimize wall interactions, induce protein conformation changes
Crown ethers Modify mobility by selective formation of inclusion complexes
Organic solvents Modify electroosmotic flow, increase solubility of organic ions, modify ion solvation, reduce wall interactions
Urea Modifies the mobility of proteins by hydrogen-bond complexation
Metal ions Modify mobility of anions and electroosmotic flow
Alkanesulfonic acids Modify mobility by ion pair formation, wall adsorption leads to changes in surface properties Cellulose polymers Mask active sites on the capillary wall, modify electroosmotic flow
Cationic surfactants Use to reverse the polarity of the fused silica capillary wall
Organic acids Modify mobility by ion pair formation
Ion complexation
Chelate formation (metals) Polycarboxylic acids (lactate, tartrate, hydroxyisobutyric acid) Ethylene-1,2-diaminetetraacetic acid
Dihydroxyazobenzene-5, 5-disulfonate
Ion pairing Ionic surfactants ((critical micelle concentration)
Cetyltrimethylammonium bromide, tetradecyltrimethylammonium bromide Polyvalent metal cations (Ca2#, Al3#, etc.)
CHES and other alkanesulfonic acids, perchlorate
Ion inclusion Crown ethers (15-crown-6, 18-crown-6, etc.)
Solvent effects
Organic solvents Acetonitrile, methanol, 2-propanol, tetrahydrofuran, etc.
Electrolyte Ionic strength, concentration of the probe (co-ion)
system. The electroosmoticSow and electrophoretic migration now occur in the same direction. For difRcult to separate anions normal (counterSow) operation may be the better option at the expense of longer separation times. To reduce peak broadening the mobility of the sample anions should be matched to those of the background electrolyte. For UV-visible detection indirect detection is frequently employed. This requires the addition of a probe (co-ion) of high molar absorption, in low concentration, with the same charge as the analytes. Examples include chro-mate (most popular), benzoate, salicylate, phthalate, etc.
Micellar Electrokinetic
Chromatography
The addition of an ionic surfactant above its critical micelle concentration to the buffer provides an additional separation mechanism based on distribu-tion of the analytes between the micelles and electro-lyte. The velocity with which the micelles migrate to the detector is usually different to the velocity of the bulk electrolyte allowing separations based purely on differences in the analyte distribution constants for neutral compounds. For ions differences in both distribution constants and electrophoretic mobility are important. An acceptable separation also requires
favourable kinetic properties (efRciency), provis-ion of an adequate migratprovis-ion window (peak capacity) and a reasonable total separation time. Normally, the experimental conditions are set to establish an accept-able separation time and migration window under conditions where the efRciency is not compro-mised and the outcome of the experiment controlled by selectivity optimization. Selectivity is inSuenced largely by the identity of the surfactant and the addi-tion of complexing agents and/or organic solvents to the buffer.
Table 6 Characteristic properties of common surfactants for micellar electrokinetic chromatography
Surfactant Critical
micelle concentration (mM)
Aggregation number
Solvation parameter model system constantsH
m r s a b
Sodium dodecyl sulfate 8.2 62 2.99 0.46 !0.44 !0.30 !1.88
Tris(hydroxymethyl)aminoethane dodecyl sulfate 2.56 0.57 !0.66 !0.33 !1.56
Sodium dodecyl sulfonate 9.8 54 2.51 0.51 !0.70 !0.14 !1.51
Sodium cholate 13}15 2}4 2.45 0.63 !0.47 0 !2.29
Sodium taurocholate 2.8 4 2.43 0.60 !0.34 0 !2.06
Sodium deoxycholate 4}6 4 2.67 0.66 !0.47 0 !2.47
Sodium taurodeoxycholate 2}4 8 2.62 0.67 !0.45 0 !2.17
SodiumN-dodecanoyl-N-methyltaurine 8.7 3.07 0.72 !0.50 0.22 !2.58
Lithium perfluorooctanesulfonate 2.30 !0.52 0.34 !0.82 !0.53
Tetradecyltrimethylammonium bromide 4.4 64 2.82 0.36 !0.29 0.90 !2.67
Hexadecyltrimethylammonium bromide 0.026 169 3.40 0.61 !0.55 0.58 !3.08
MicroemulsionHH 3.05 0.28 !0.69 !0.06 !2.81
HThem system constant is a measure of the difference in cohesive energy and dispersion interactions for the micelles and electrolyte; ther system constant the difference in interactions with lone pair electrons; the s system constant the difference in interactions of a dipole type; thea and b system constants the difference in hydrogen-bond base and hydrogen-bond acid interactions, respectively. The sign of the constant indicates whether the interaction favours distribution to the micelles (positive) or electrolyte system (negative).HHMicroemulsion consisting of 1.4%wt. sodium dodecyl sulfate, 6.49%wt. butan-1-ol and 0.82%wt. heptane.
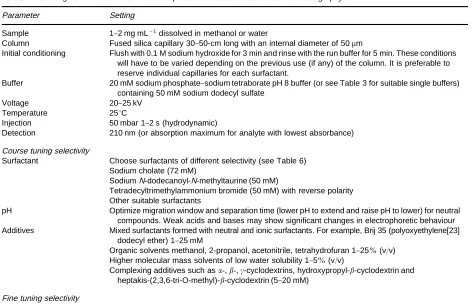
Table 7 Starting conditions for method development in micellar electrokinetic chromatography
Parameter Setting
Sample 1}2 mg mL\1dissolved in methanol or water
Column Fused silica capillary 30}50-cm long with an internal diameter of 50m
Initial conditioning Flush with 0.1 M sodium hydroxide for 3 min and rinse with the run buffer for 5 min. These conditions will have to be varied depending on the previous use (if any) of the column. It is preferable to reserve individual capillaries for each surfactant.
Buffer 20 mM sodium phosphate}sodium tetraborate pH 8 buffer (or see Table 3 for suitable single buffers)
containing 50 mM sodium dodecyl sulfate
Voltage 20}25 kV
Temperature 253C
Injection 50 mbar 1}2 s (hydrodynamic)
Detection 210 nm (or absorption maximum for analyte with lowest absorbance)
Course tuning selectivity
Surfactant Choose surfactants of different selectivity (see Table 6)
Sodium cholate (72 mM)
SodiumN-dodecanoyl-N-methyltaurine (50 mM)
Tetradecyltrimethylammonium bromide (50 mM) with reverse polarity Other suitable surfactants
pH Optimize migration window and separation time (lower pH to extend and raise pH to lower) for neutral
compounds. Weak acids and bases may show significant changes in electrophoretic behaviour Additives Mixed surfactants formed with neutral and ionic surfactants. For example, Brij 35 (polyoxyethylene[23]
dodecyl ether) 1}25 mM
Organic solvents methanol, 2-propanol, acetonitrile, tetrahydrofuran 1}25%(v/v) Higher molecular mass solvents of low water solubility 1}5%(v/v)
Complexing additives such as-,-,-cyclodextrins, hydroxypropyl--cyclodextrin and heptakis-(2,3,6-tri-O-methyl)--cyclodextrin (5}20 mM)
Fine tuning selectivity
Modify system properties such as column length, temperature, voltage, buffer type and ionic strength. Surfactant concentration changes the phase ratio but has little effect on selectivity
with complementary properties to those available at present and to avoid unnecessary experiments with surfactants with different structures but nearly identical selectivity properties.
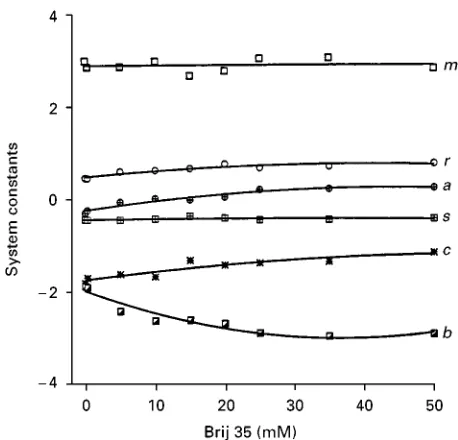
[image:8.568.49.524.383.688.2]Figure 3 Change in the system constants obtained from the solvation parameter model as a function of the composition of the mixed micelles formed with the neutral surfactant Brij 35 (1}50 mM) and 50 mM sodium dodecyl sulfate. See Table 6. (Reproduced with permission from Poole SK and Poole CF (1997) Variation of selectivity with composition for a mixed-micellar buffer in micellar electrokinetic chromatography.Journal of High Resolution Chromatography 20: 174}178.)
Figure 4 Separation of estrogens by MEKC using a 20 mM sodium phosphate-borate pH 8 buffer containing 50 mM sodium dodecyl sulfate (A) and the same buffer containing 20 mM-cyclodextrin (B). Separation conditions: capillary 48.5 cm (effective length 40 cm), internal diameter 50m, temperature 253C, and field strength 20 kV. Compounds: 1"estriol; 2"17-estradiol; 3"17-estradiol; 4"17-dihydroequilenin; 5"17-dihydroequilenin; 6"17-dihydroequilenin; 7"17-dihydroequilin; 8"estrone; 9"equilenin; and 10"equilin. (Modified from Poole SK and Poole CF (1996) Separation of pharmaceutically important estrogens by micellar electrokinetic chromatography.Journal of Chromatography A 749: 247}225, with permission from Elsevier Science.)
surfactant micelles, organic solvents and inclusion complexing agents. A large number of mixed micelles can be employed without any certain prospects of
[image:9.568.55.519.445.644.2]is due to changes in the relative solubility of the analytes in the electrolyte.
Capillary Gel Electrophoresis
Capillary gel electrophoresis is used for the separ-ation of macromolecules such as proteins and nucleic acids, whose mass-to-charge ratios do not vary much with size. Separation requires a sieving medium made up of a crosslinked gel or an entangled polymer net-work. The capillaries are often wall-coated or chem-ically bonded to minimize electroosmotic Sow that tends to destabilize the columns. ColumnsRlled with rigid crosslinked gels, usually polyacrylamide, are characterized by the total amount of monomer and crosslinking agent (%T) and the ratio of crosslinking agent to total amount of monomer and crosslinking agent (%C) used to prepare the column. Larger pore size gels (lower %T) are used for separating DNA sequencing reaction products whereas the narrow-pore media are best for proteins and small oligonuc-leotides. Entangled polymer networks of linear polyacrylamide, methylcellulose or dextran have the advantage that they can be forced into the capillary as a solution and replaced when needed. Unlike gels, columns are easily prepared in the laboratory and tend to the be more robust. Electrokinetic injection is used for sample introduction. The buffer pH is selected such that the analytes of interest are ionized. TRIS/borate and TRIS/phosphate buffers in the pH range 7.5 to 8.5 (50}200 mM) are fairly general conditions. Sometimes urea (7}8 M) or ethylene glycol (1.5}3.0 M) is added to the buffer as a nonionic denaturing or solubilizing agent and EDTA (about 2 mM) to protect against cation inter-ferences. When SDS-proteins are separated sodium dodecyl sulfate (0.1% w/v) is added to the run buf-fer. For many practical applications of capillary gel electrophoresis the column materials and reagents required can be purchased in kit form.
Capillary Isoelectric Focusing and
Isotachophoresis
Capillary isoelectric focusing is used to separate poly-peptides based on differences in their isoelectric points (pI) in wall-coated fused silica capillaries to eliminate electroosmotic Sow and nonspeciRc ad-sorption of the sample with the capillary wall. The capillary is Rlled with the sample and a mixture of ampholytes capable of producing a pH gradient that covers the pIvalues of the proteins. Ampholytes are a mixture of hundreds to thousands of amphoteric compounds, generated by the random addition of acrylic acid to a mixture of linear and branched
oligoamines, providing pIvalues are fairly well dis-tributed along the pH scale from 3 to 10. In practice about 94% of proteins can be separated in the pH range 3}8.5. This allows a single capillary to be used for hundreds of separations by minimizing alteration to the capillary wall coating. When a volt-age is applied (e.g. 15 kV for 4 min) the sample components focus into narrow zones according to their pI values. The zones are then mobilized by hydraulic, electroosmotic or ion addition (by adding 80 mM sodium chloride to either the source or destination vial and applying an electric Reld) to move them past the detector. The destination vial contains a buffer (catholyte) at a pH higher than the pI of the most basic ampholyte (40 mM sodium hydroxide) and the source vial contains a buf-fer (anolyte) at a pH lower than the pI of the most acidic ampholyte (20 mM phosphoric acid). To avoid protein precipitation in the focused zones a surfactant or urea can be added to the buffer, the sample diluted, or gel-Rlled capillaries can be used.
In capillary isotachophoresis sample ions are separ-ated by differences in their mobility in a hetero-geneous buffer system created by sandwiching the sample between a leading and terminating buffer with different and speciRed compositions. It is general practice to separate mixtures in the constant current mode using chemically bonded or dynamically coated capillaries to eliminate electroos-moticSow. As well as fused silica capillaries of stan-dard dimensions wide-bore TeSon (0.5}0.8 mm) tubes have been used in purpose-built apparatus for isotachophoresis. Before commencing the separation both the capillary and destination buffer vial is
Table 8 Composition of some common capillary isotachophoresis buffersH
Property pH
2.0 3.3 4.5 6.0 8.8
Separation Cations Anions Cations Anions Anions
Leading ion 10 mM HCl 10 mM HCl 10 mM KOAc 10 mM HCl 10 mM HCl
Leading counterion -Alanine HOAc Histidine Ammediol
Leading additive 0.2%HPMC 0.2%HPMC 0.2%HPMC
Terminating ion 10 mM TRIS 10 mM caproic acid 10 mM HOAc 10 mM MES 10 mM-Alanine
Terminating counterion HCl TRIS Ba(OH)2
Terminating pH 8.5 6.0 9.0
Recommendations
Cations Anions
Leading ion (20}30 mM)
K#, NH#4 , Na# Cl\
Terminating ion H#, or weak base
(mobility'H#)
OH\, or weak acid (mobility'OH\)
Terminating counterion Weak acid,
pK"pHL$0.5
Weak base, pK"pHL$0.5
Typical counterions pHL pHL
Formate 3.2}4.2 -Alanine 3.1}4.1
Acetate 4.2}5.2 Histidine 5.5}6.5
MES 5.7}6.7 Imidazole 6.6}7.6
Glycine 9.1}10.1 TRIS 7.6}8.6
Ethanolamine 9.0}10.0
See Table 4 for buffer abbreviations; Ammediol"2-amino-2-methyl-1,3-propanediol; HPMC"hydroxypropylmethylcellulose; and OAc"acetate.
the separated zones is usually by conductivity or UV-visible absorption. The method has high peak capacity since separated zone boundaries are sharp and close to each other to maintain continuity of the current. When the experimental conditions are cor-rect a steady state is reached in which all zones are migrating at the same speed and the detector output is a series of steps, the length of which corresponds to the concentration of the ion. At Rrst sight the data presentation may be confusing and this combined with the complex method development has sup-pressed interest in capillary isotachophoresis in favour of other chromatographic methods. The com-pelling advantage of isotachophoresis is its ability to trace enriched dilute samples, by 100-fold or more, and as a preconcentration or preseparation technique for capillary zone electrophoresis it is enjoying some-thing of a renaissance.
Conclusions
The capillary electrophoretic methods are sufR -ciently established to ensure their continued laborat-ory use but not so mature that signiRcant develop-ments are unexpected in the near future. These devel-opments are likely to be application driven and will impact on the method development process. New systems for separation of biopolymers using gels and
entangled polymers, a wider range of surfactants for selectivity optimization in micellar electrokinetic chromatography, and tailor-made sorbents for selec-tivity optimization and control of electroosmoticSow in electrochromatography are just some expected improvements. Better models for predicting sample migration should aid computer-aided method devel-opment strategies and experimental design ap-proaches for multiparameter optimization of com-plex mixtures should grow in popularity.
Further Reading
Baker DR (1995) Capillary Electrophoresis. New York: Wiley-Interscience.
Bossi A, Olivieri E, Castelletti L, GelR C et al. (1999) General experimental aspects of the use of isoelectric buffers in capillary electrophoresis. Journal of Chrom-atography A853: 71}82.
Doble P and Haddad PR (1999) Indirect photometric detec-tion of anions in capillary electrophoresis.Journal of Chromatography A834: 189}212.
Jimidar M, Yang Q, Smeyers-Verbeke J and Massart DL (1996) Method development and optimization for small ion capillary electrophoresis. Trends in Analytical Chemistry15: 91}102.
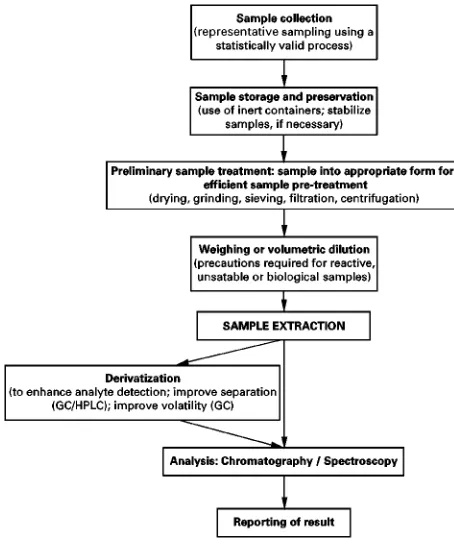
Figure 1 Sample preparation protocol. Figure 2 Extraction of analytes from solid matrices.
Krivankova L and Bocek P (1997) Synergism of capillary isotachophoresis and capillary zone electrophoresis. Journal of Chromatography B689: 13}34.
McLaughlin GM, Weston A and Hauffe KD (1996) Capillary electrophoresis methods development and sen-sitivity enhancement strategies for the separation of in-dustrial and environmental chemicals. Journal of Chromatography A744: 123}134.
Muijselaar PG, Otusuka K and Terabe S (1997) Micelles as pseudo-stationary phases in micellar electrokinetic chro-matography.Journal of Chromatography A780: 41}61. Poole CF and Poole SK (1997) Interphase model for retention and selectivity in micellar electrokinetic
chromatography.Journal of Chromatography A 792: 89}104.
Reijenga JC, Verheggen TPEM, Martens JHPA and Everaerts FM (1996) Buffer capacity, ionic strength and heat dissipation in capillary electrophoresis.Journal of Chromatography A744: 147}153.
Rodriguez-Diaz R, Zhu M and Wehr T (1997) Strategies to improve performance of capillary isoelectric focusing. Journal of Chromatography A772: 145}160.
Watzig H, Matthias D and Kunkel A (1998) Strategies for capillary electrophoresis: method development and vali-dation for pharmaceutical and biological applications. Electrophoresis19: 2695}2752.
ESSENTIAL GUIDES TO METHOD
DEVELOPMENT IN EXTRACTION
J. R. Dean, University of Northumbria at Newcastle,
Newcastle upon Tyne, UK
Copyright^ 2000 Academic Press
Introduction
Samples for extraction can be broadly categorized as solid, liquid or gaseous matrices. It is obvious that the different methods of extraction of analytes from
these matrices will also vary. This guide provides an overview of the different approaches for extrac-tion of analytes from these different matrices.
It is important to consider that extraction is only one part of the sample preparation protocol. Other steps are highlighted in Figure 1. A typical solid sample is most likely to be heterogeneous. This is a problem in the analysis, if appropriate steps have not been taken to remove a representative sample using a statistical approach. Failure to do so can make any subsequent extraction and analysis results mean-ingless.
[image:12.568.295.516.514.695.2]