Contact Formation Dynamics: Mapping
Chemical Bond Formation between a
Molecule and a Metallic Probe
Borislav Naydenov, Lucile C. Teague,
†Peter Ryan, and John J. Boland*
School of Chemistry and the Centre for Research on AdaptiVe Nanostructures and NanodeVices (CRANN), Trinity College, Dublin 2, Ireland
Received June 6, 2006; Revised Manuscript Received July 7, 2006
ABSTRACT
We present a study that maps out chemical bond formation between a Pt-inked probe and a single 1,3-cyclohexadiene (1,3-CHD) molecule on Si(100). By separating the mechanical and electronic contributions to the current during the approach to contact, we show that there are significant forces between the probe and the CdC of the molecule and we track the relaxation of the molecule, the emergence of a chemical bond feature in the LDOS, and the quenching of specific molecular vibrations during bond formation.
Understanding the detailed dynamics of chemical bond formation at surfaces is essential to a wide range of technologies. For example, the prospects for future molecular electronic devices1-13hinge on the ability to form
reproduc-ible electrical contacts with single molecules.2,3,14 Little is
known about how individual molecules relax or how potentially important device properties such as the HOMO -LUMO gap are modified by the contacting process. Similarly, the operation of catalysts and enzymes depends on under-standing how particular molecules react with surface catalytic sites.15-17The manner in which molecules engage with and
ultimately dock at these surface sites is critically important. In these and related systems, numerous studies have reported on the final state properties, that is, after the contact has been assembled or the reaction completed. The actual dynamics of chemical bond formation is poorly understood and represents a serious impediment to the rational design of the materials and devices that underpin these technologies.
Here we present a study that maps out chemical bond formation as a Pt-inked probe approaches and makes contact with a single 1,3-cyclohexadiene (1,3-CHD) molecule on Si-(100). By explicitly separating the mechanical and electronic contributions to the current during the approach, we show that there are significant forces18between the probe and C
d C region of the molecule and we track both the relaxation and rehybridization of the molecule, the emergence of a chemical bonding feature in the LDOS, and the quenching of specific molecular vibrations, all in excellent agreement with density functional theory (DFT) calculations. We
envision that these methods will be useful for identifying candidate metal-molecule systems for device applications and for addressing the operation and selectivity of certain catalysts.
Contact and bond formation was studied using a cryogenic STM (Createc) in which a single-crystal Pt(111) metal sample and a Si(100) substrate [n+-type As,<5 mΩ‚cm] were placed in a sample holder that allows each to be heated and prepared separately. Following characterization by LEED, both samples were simultaneously exposed at room temperature to less than 0.1% of a monolayer of 1,3-CHD, transferred into the STM, and cooled to 5 K. Tungsten STM probes were cleaned by electron bombardment and then “inked” with atoms from the Pt substrate using a method described previously18and which provided control over the
composition of the probe. The Pt-inked probe was then carefully brought into tunneling contact with the Si(100) surface, and topographic images and spectroscopic measure-ments were recorded.
The close-up STM image in Figure 1a reveals buckled dimers in weakly ordered c(4×2) and p(2×2) domains (dashed boxes in Figure 1a) together with a single 1,3-CHD molecule (bright feature) bound to the surface in the [2 + 2] intradimer configuration.19 The STM probe tip was
positioned over the molecule’s maximum (black cross in Figure 1a) known to be associated with the single remaining CdC bond in the adsorbed molecule,20and the local density of states (LDOS)21at different probe-molecule separations
was recorded using a 15 mV modulation at 534 Hz during the bias sweep. Figure 1b is a map of the empty LDOS in the energy range from 100 to 700 meV recorded as a function of the probe height above the molecule. The filled LDOS in * Corresponding author. E-mail: [email protected].
†Present address: Surface and Microanalysis Sciences Division, National
Institute of Standards and Technology, 100 Bureau Drive Mailstop 8372, Gaithersburg, MD 20899.
NANO
LETTERS
2006
Vol. 6, No. 8
1752
-
1756
this energy range is not shown but is essentially featureless, reflecting the combination of a wide HOMO-LUMO gap, the Si band gap, and degenerately n-doped substrate (see Supporting Information no. 1). (The absolute separation in Figure 1b is unknown, and the zero was chosen with the aid of computation, see below). In the energy range up to 200 meV, the LDOS is essentially independent of probe -molecule separation. However, at large separations there is a weak doublet feature centered about 280 meV that is due to inelastic losses associated with the molecule on the surface (see below). Upon closer approach these features are quenched and an intense broad peak emerges in the LDOS at 350 meV (Figure 1b). Within this range of probe -molecule separations, the emergence and disappearance of this 350 meV peak is completely reversible and the amplitude of the peak falls off sharply with distance from the CdC
topographical maximum (see Supporting Information no. 2). Moreover, measurements recorded at separations below that in Figure 1b or at biases above (0.8 V tended to perturb the molecule and surrounding dimers, resulting in a measur-able hysteresis.18
Figure 1c shows the second derivative spectrum (d2I/dV2)
as a function of probe-molecule separation. At large separation, there are two clearly defined vibrational features22
at 1610 and 2830 cm-1assigned to the stretching modes of
the CdC double bond and C-H bonds, respectively. These features are quenched upon closer approach and accompanied by the emergence of the 350 meV LDOS feature. This anticorrelation between the LDOS and vibration peaks is reversible, with the former being recovered at large separa-tions. On the basis of these data, we conclude that the probe forms a chemical bond with the CdC of the molecule at small separations, quenching the CdC vibration and generat-ing a new electronic feature associated with this bond.
To demonstrate that bond formation occurs at the CdC region of the molecule, current-distance (I-Z) spectroscopic studies18,23were performed to directly measure the interaction
force, F, between the probe and the CdC. Using a 0.01 nm dither at 534 Hz applied to the Z piezo under open-loop conditions, the current and the first (FH) and second harmonics (SH) (dI/dZ and d2I/dZ2) were measured
simul-taneously using a lock-in as the probe was approached to and retracted from the surface. To eliminate LDOS contribu-tions at different probe-molecule separations, we recorded all measurements at 200 meV sample bias because the LDOS within the tunneling energy window defined by this bias is constant and independent of separation (see Figure 1b). This interaction force, F, induces a vertical displacement in the CdC (∆ZCdC) that is detectable in the current. The simplest
approach is to assume that the force is zero at large separations, so the current is described by
and
whereφis the tunneling barrier height, A )2π(8me)1/2/h,
Zp)Z+∆ZCdCis the piezo-driven probe-surface separation,
and kSis the spring constant associated with the attachment
of the CdC to the surface. Combining eqs 1 and 2, we obtained the force spectrum
where IF)0(Zp) was obtained by fitting the experimental
spectrum at large separations and extrapolating it to smaller values, whereas for IF*0(Zp) the actual experimental data were
used. Figure 2 shows a map of F(Zp) as the probe approaches
[image:2.612.54.292.39.353.2]the surface, recorded from different lateral positions along the cross section in Figure 1a. Figure 2 shows that the force spectrum has near topographic spatial resolution and is Figure 1. Density of states map of the probe-molecule contact
formation. (a) Topographic image of the 1,3-cyclohexadiene molecule adsorbed on the Si(100) surface recorded with 0.1 pA tunneling current and sample bias of 700 mV at 5 K. Area size 130×100 Å. The dashed boxes comprise domains with c4×2 and p2 × 2 Si-surface reconstructions. The position where the LDOS spectra were taken is marked with a black cross. The gray solid line indicates the cross section across the molecule along which the relaxation spectroscopy in Figure 2 was recorded. (b) The electron local density of states (LDOS)(dI/dV)/(I/V)) dependence on the probe-molecule separation is presented as a color map. The black horizontal bar on the bottom left shows a region of LDOS that is essentially independent of separation. The emergence of the electronic state at 350 mV associated with bond formation is clearly visible. (c) Inelastic electron tunneling spectroscopy (IETS, d2I/ dV2) at different probe-molecule separations shows the presence of two molecule vibrational bands that are quenched during the approach.
IF)0≈exp(-Aφ
1/2Z) large Z; F)0; Z)Z
p (1)
IF*0≈exp[-Aφ 1/2(Z
p+kS
-1F)]; F) -k
S∆ZCdC (2)
F(Zp))[ln(IF)0)-ln(IF*0)](Aφ 1/2k
S
sensitive to the presence of the adsorbed 1,3-CHD molecule. In particular, there is significant attraction (red feature in
Figure 2) at the location of the molecules’ CdC bond, consistent with a local chemical bonding interaction.
A more detailed force analysis is possible using the FH and SH signals, which are sensitive to subtle variations in the current, and for which it was previously shown that changes in the FH and SH signals during the approach reflect local changes in the force gradients that act between the probe and the corresponding surface location.18By analyzing
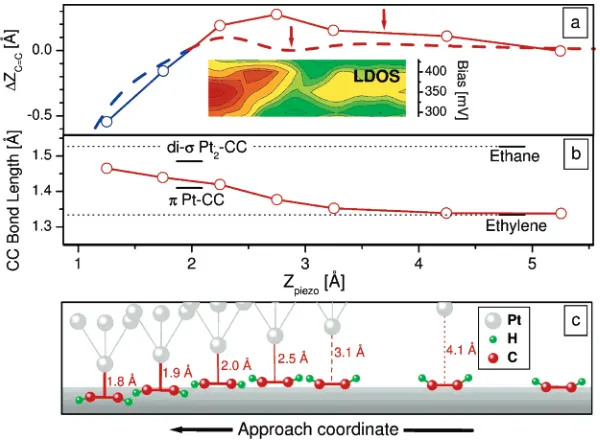
the current signal and its harmonics with the probe initially positioned above the CdC bond, the subsequent relaxation of the molecule during the approach to bond formation was measured18and plotted in Figure 3a (dashed line). At large
separations, the CdC moiety is weakly attracted toward the probe. When the probe advances further, the CdC pulls away, but then as the 350 meV state emerges (see inset Figure 3a), the CdC moiety is firmly drawn toward the probe. Beyond this point, the continued motion of the probe toward the surface is tracked by the CdC moiety, which is ultimately compressed (blue dashed line section, Figure 3a) beyond its neutral position (∆ZCdC)0). No other region of
the molecule exhibited this behavior, demonstrating that the spectroscopic map in Figure 2 is sensitive to details of the probe-molecule interaction.
[image:3.612.61.289.39.223.2]These data clearly show that the emergence of the 350 meV state during the approach to contact is associated with a specific bonding interaction between the probe and the Cd C bond of the molecule. This was confirmed by DFT calculations that involved a 1,3-CHD molecule attached to a Si(100) dimer with a Pt probe (modeled as a five atom (100) cluster constrained to the bulk structure) positioned Figure 2. Spatial map of the tip-sample interaction force. The
insert on the top shows a F(Zp) map along the gray solid line in Figure 1a obtained by applying eq 3 with 200 mV sample bias and parameters obtained in ref 18. The map was constructed by averaging spectra recorded at individual positions (arrows) along the dotted lines and assuming fixed ks)100 N/m.18The solid black line presents the surface corrugation (0.1 pA, 700 mV) along the cross section taken as in Figure 1a. The topographic maximum is exactly above the CdC double bond as evidenced from the model
of the molecule and the surface shown on the bottom of the figure. This maximum coincides with the well-defined attraction feature (red) in the F(Zp) map and is the position where the LDOS and IETS maps (see Figure 1b and c) were recorded.
Figure 3. CdC double-bond relaxation and rehybridization during the probe-molecule contact formation. (a) The DFT calculated
displacement (∆ZCdC) of the CdC bond relative to the equilibrium position (zero net force) is shown with an open circle and solid line. The attraction and repulsion between the probe and the CdC bond are presented as red and blue, respectively. The experimentally derived
∆ZCdCis plotted as a dashed line and is a good match to the theoretical curve. The inset is an aligned strip of the LDOS map showing the appearance of the new electronic state after the local minimum (arrow on dashed curve). (b) The DFT calculated CdC bond length (open
[image:3.612.157.457.420.641.2]over the CdC. The Si(100) surface was modeled using a three-dimer-long 3×2 slab, six-layers deep and terminated by H atoms on the lower surface. Plane wave (cutoff energy 240 eV) and the PW-91 GGA methods24were used with 1
×3×2 Monkhorst-Pack grid25, for which the energy and
maximum force convergences were set to 2×10⁻⁵eV/atom
and 0.05 eV/Å, respectively.26With the probe located 2 nm
away and the bottom two Si layers constrained to the bulk, the molecule-surface system was relaxed to determine the total energy of the isolated systems. All Si atoms were then fixed at their optimized positions, and the molecule was allowed to relax as the probe approached the CdC bond.
On the basis of these DFT results, the change in the Z position and bond length of the CdC during the approach were calculated and shown in Figure 3a and b (solid lines connecting open circles) while Figure 3c schematically describes the relaxation of the CdC moiety and its constitu-ent atoms. Initially, the trigonal plane of the H-CdC-H moiety is tilted up from the surface plane and the CdC bond length is similar to that in ethylene. As the probe approaches, the entire moiety is attracted toward it and the length of the CdC bond begins to increase from 1.337 to 1.345 Å. This is followed by a pause during which the CdC does not respond to the approaching probe but after which there is attraction that results in further bond elongation and local rehybridization as thedC-H bonds flip down toward the surface (see Figure 3a and c). The formation of a stable chemically bonded contact between the probe and the CdC occurs when there is no net force and for which the CdC returns to its original position above the surface (∆ZCdC)
0 in Figure 3b and the gray boundary in Figure 3c). At this equilibrium position, the length of the CdC closely matches that found in pπ f dπ complexes between ethylene and single Pt surface atoms.27As the probe approaches further,
the contact bond is compressed and there is a commensurate elongation of the CdC bond.
The relaxation of the CdC moiety predicted by computa-tion closely matches that seen in the experiment (solid vs dashed curve in Figure 3a). The Z scale in this and all figures has been set by aligning the zero force points (the energy minima) of the calculated and experimental approach curves. One notable difference is that the experimental curve shows that the CdC bond relaxes back toward its neutral position prior to bond formation (accompanied by quenching of the CdC vibration and the emergence of the 350 meV peak in the LDOS), whereas theory shows only a reduced attraction with the probe (see arrows in Figure 3a) but at larger separations. Although this difference may in part reflect our inability to perform fully relaxed calculations, an analysis of the molecule’s coordinates clearly shows that this behavior is associated with the rehybridization of the CdC bond (Figure 3c). In the experimental model, this relaxation is attributed to either a small barrier to bond formation18or a
local increase in the spring constant that tethers the molecule to the surface. It is not possible at present to distinguish between these possibilities, but both are consistent with a reorganization of the molecule prior to actual bond formation. On the basis of these data, the emergence of the 350 meV
chemical bonding signature in the LDOS in Figure 1b is associated with the rehydridization of the CdC bond. The unoccupied 350 meV peak should then correspond to the antibonding level associated with the pπ f dπ bonding interaction, in which π electron density of the CdC is transferred to an empty d orbital on the Pt probe.27 This
assignment is consistent with quenching of the CdC vibra-tion (Figure 1c) and is reminiscent of the pπfdπcomplex observed in the case of ethylene on Pt(111) and for which NEXAFS studies show an emptyπ* level located about 300 meV above Ef.28 On the Pt(111) surface this complex is
known to be unstable above 50 K and to convert to di-sigma bonded structure involving two Pt atoms.29However, it is
likely that the latter structure is precluded here because it requires two Pt atoms almost equidistant from the CdC, which would be immediately evident in the present case because of the grossly distorted STM images that would result.
The demonstrated ability to track the relaxation of a single molecule and the evolution of its electronic and vibrational properties over a range of separations, up to and including the point of chemical bond formation, has important implica-tions. This method has important advantages over the conventional AFM technique, which does not have these same spectroscopic capabilities. It results from an ability to explicitly separate the mechanical and electronic contribu-tions to the current, which will always be possible for molecules with large HOMO-LUMO gaps and semiconduc-tors where the location of the Fermi energy can be controlled by doping.13When combined with the subpicometer control
of cryogenic STM, this approach provides snapshots of the dynamics along the reaction coordinate. For molecular electronics, this facilitates a systematic approach to evaluate, in combination with different contacting metals, the perfor-mance of candidate molecules in different environments and bonding configurations, and represent an important first step toward the rational design of molecular devices and their operation. In the case of catalysis, it provides a methodology to examine the dynamics of chemical bond formation at different active sites, and in combination with molecular manipulation and attachment using STM probes,30the ability
to measure the local affinity of a substrate toward different molecules.
Acknowledgment. This work was supported by Science Foundation Ireland under grant 00/PI.1/C077A.
Supporting Information Available: Supporting Informa-tion no. 1: LDOS spectra of the 1,3-CHD molecule and the bare region of the Si(100) surface recorded at a large probe -molecule separation. Supporting Information no. 2: lateral confinement of the LDOS state associated with bond formation. This material is available free of charge via the Internet at http://pubs.acs.org.
References
(1) Muller, C. J.; Vleeming, B. J.; Reed, M. A.; Lamba, J. J. S.; Hara, R.; Jones, L.; Tour, J. M. Nanotechnology 1996, 7, 409-411. (2) Cui, X. D.; Primak, A.; Zarate, X.; Tomfohr, J.; Sankey, O. F.; Moore,
(3) Nitzan, A.; Ratner, M. A. Science 2003, 300, 1384-1389. (4) Xu, B.; Tao, N. Science 2003, 301, 1221-1223.
(5) Haiss, W.; Van Zalinge, H.; Higgins, S. J.; Bethell, D.; Ho¨benreich, H.; Schiffrin, D. J.; Nichols, R. J. J. Am. Chem. Soc. 2003, 125, 15294-15295.
(6) Reed, M. A.; Zhou, C.; Muller, C. J.; Burgin, T. P.; Tour, J. M. Science 1997, 278, 252-254.
(7) Blum, A. S.; Kushmerick, J. K.; Long, D. P.; Patterson, C. H.; Yang, J. C.; Henderson, J. C.; Yao, Y. X.; Tour, J. M.; Shashidhar, R.; Ratna, B. R. Nat. Mater. 2005, 4, 167-172.
(8) Gimzewski, J. K.; Joachim, C. Science 1999, 283, 1683-1688. (9) Gittins, G. I.; Bethell, D.; Schiffrin, D. J.; Nichols, R. J. Nature 2000,
408, 67-69.
(10) Maruccio, G.; Cingolani, R.; Rinaldi, R. J. Mater. Chem. 2004, 14, 542-554.
(11) Guisinger, N. P.; Yoder, N. L.; Hersam, M. C. PNAS 2005, 102, 8838-8843.
(12) Xue, Y. Q.; Ratner, M. A. Int. J. Quantum Chem. 2005, 102, 911 -924.
(13) Rakshit, T.; Liang, G.-C.; Ghosh, A. W.; Datta, S. Nano Lett. 2004, 4, 1803-1807.
(14) Hipps, K. W. Science 2001, 294, 536-537.
(15) Topsøe, H.; Hinnemann, B.; Nørskov, J. K.; Lauritsen, J. V.; Besenbacher, F.; Hansen, P. L.; Hytoft, G.; Egeberg, R. G.; Knudsen, K. G. Catal. Today 2005, 107-08, 12-22.
(16) Lauritsen, J. V.; Vang, R. T.; Besenbacher, F. Catal. Today 2005, 111, 34-43.
(17) Weigelt, S.; Busse, C.; Petersen, L.; Rauls, E.; Hammer, B.; Gothelf, K. V.; Besenbacher, F.; Linderoth, T. R. Nat. Mater. 2006, 5, 112 -117.
(18) Naydenov, B.; Ryan, P.; Teague, L. C.; Boland, J. J., to be submitted for publication (submitted to Phys. ReV. Lett and provided as RelatedWork.pdf).
(19) Teague, L. C.; Boland, J. J. J. Phys. Chem. B 2003, 107, 3820 -3823.
(20) Teague, L. C.; Boland, J. J. Thin Solid Films 2004, 464-465, 1-4. (21) Scanning Tunneling Microscopy and Spectroscopy: Theory, Tech-niques, and Applications; Bonnell, D. A., Ed.; VCH: New York, 1993.
(22) Stipe, B. C.; Rezaei, M. A.; Ho, W. Science 1998, 280, 1732-1736. (23) Chen, C. J.; Hamers, R. J. J. Vac. Sci. Technol., B 1991, 9, 503
-505.
(24) Perdew, J. P.; Zunger, A. Phys. ReV. B 1981, 23, 5048-5079. (25) MacDonald, A. H. Phys. ReV. B 1978, 18, 5897-5899.
(26) Segall, M. D.; Lindan, P. J. D.; Probert, M. J.; Pickard, C. J.; Hasnip, P. J.; Clark, S. J.; Payne, M. C. J. Phys.: Condens. Matter 2002, 14, 2717-2744.
(27) Watson, G. W.; Wells, R. P. K.; Willock, D. J.; Hutchings, J. J. Phys. Chem. B 2000, 104, 6439-6446.
(28) Cassuto, A.; Mane, M.; Jupille, J. J. Phys. Chem. 1992, 96, 5987 -5993. The π* energy value above the Fermi level used in the manuscript is estimated by subtracting the C1s binding energy from the energy of the 1s-π* resonance; the later values are taken from ref 28. This estimate is valid because of the self-screened final state of the 1s-π* resonance.28
(29) Cassuto, A.; Mane, M.; Jupille, J. Surf. Sci. 1991, 249, 8-14. (30) Dudko, O.; Filippov, A. E.; Klafter, J.; Urbakh, M. Nano Lett. 2003,
3, 795-798.