Journal of the Statistical and Social Inquiry Society of Ireland. Vol XXVI, Part IV
CROSS CHANNEL PASSENGER TRAFFIC 19604990
MfCHEAL O RIAIN1 Formerly of Aer Lingus
(Read before the Society, 14 November 1991)
1. INTRODUCTION
Over the period of thirty years (1960-1990) passenger movements between Britain and the Republic of Ireland have grown from just over 1 million to just over 3.5 million per annum. The average annual rate of increase has been 4 . 1 % .
The purpose of this paper is to examine this annual growth period by period over the thirty years. However, I will not try to present an econometric model of passenger movements and other factors over the period. This has been done by others in relation to some of the data, particularly in relation to tourism - interesting, complex, sophisticated, e.g. by Kevin Barry and John O'Hagan published in the Economic it Social Review (January 1972). I believe that a number cf students have visited this topic when writing Masters theses. From the British end some interesting work has been done - for example by Edwards (1976) in Economist Intelligence Unit Report No. 62,
I admire such work but I believe that there are just so many variables and subvariabies - economic, pricing, political, competitive and product - that the data is not amenable to econometric model building that is genuinely useful at least in relation to individual markets as distinct from global forecasts for total foreign travel, say by British residents. Maybe the researcher for an individual market can achieve a reasonable fit for his model over a limited period of time but, extend it back or forward, and the neatness of the fit seems to disappear. I hope I am not being unfair to some research of which I am not aware. My approach is different but if it helps some future econometric exercises, that will be fine.
I have said that the average annual rate of increase has been 4 . 1 % . The growth however has not been smooth. In six years the number of movements fell below those of the previous years but the falls in 1962, 1970 and 1974 were less than 1 % . More significant falls occurred in 1972 (-11%), 1976 (-3%) and 1981 (-4.5%). I will attempt to interpret these major departures from the longterm trend in terms of specific circumstances and events.
Several years also showed variations that were well above the trend:- 1964 (+12%), 1968 ( + 1 0 % ) , 1973 ( + 1 2 % ) , 1977 ( + 1 2 % ) and 1978 ( + 1 6 % ) , the biggest increase experienced in any single year over the period. In particular, recent years have shown growth which is well above average - 1987, 1988 and 1989 all showed increases of 13% and while 1990 itself showed a reduced growth of 7%, that too was above the longterm trend.
To speak of percentage increases in total Cross Channel passenger movements might be regarded as simplistic. The total volume of movements is made up of many segments. There are the Irish originating and British originating segments. Indeed, the segment I describe as "British originating" could more accurately be described as "originating abroad" because it includes visitors from the US and Continental Europe who use local transport services to cross the Irish sea. Then within each of these two major segments - ex Ireland and ex Britain - there are tourist, visiting friends and relatives (VFR), and business traffics. There are also the very interesting modal segments, i.e. air and surface, which of course can be sub-segmented into all the previous origin and purpose of travel traffics that I have just mentioned.
One has got to start somewhere and the simple overall growth factor can be used as a useful trigger for looking somewhat more closely at what has been happening to the various sub-segments of traffic.
when studying this paper. The comparisons, analyses and interpretations that f wilt now attempt are based on this data.
I have mentioned individual years in which there was a significantly below average or significantly above average growth in movements. Leaving these individual years aside for the moment, some sub-periods emerge where average growth was above or below the longterm overall trend. The selection of these sub-periods of course must be arbitrary to an extent. The ones that I offer for consideration are as follows.
Annual Percentage Change in Passenger Movements, 1960-1990
1960-1969 1969-1976 1976-1979 1979-1986 1986-1990
+ 05.10% - 00.05% + 10.00% + 00.90% + 11.30%
The paper will now attempt to explore these individual periods. When I have completed the period by period survey I will return to an overview of some major changes in the annual pattern of movements between 1960 and 1990 - for example, Irish originating passengers compared to British originating passengers. There has been a significant difference in their respective growth over the thirty years.
Similarly the performance of the air and surface modes differed greatly through the period. It was not simply a case of total air movements growing faster than or gaining continually at the expense of surface movements. Fluctuations in the respective performance of the modes merit attention in the period by period survey.
2. THE PERIOD 1960-1969
The period of the Sixties was the most stable of the thirty years in terms of growth of passenger movements Cross-Channel. When we look to economic indicators we find that growth in GHP was positive in the UK during this entire period in the sense of the performance of GHP in one year compared to another. Similarly the Irish C3NP shows positive year on year variances. It will be recalled that the early sixties were the era of Lemass/Macmillan - a feeling in Ireland that sustained economic improvement was now possible after the disappointments of the Fifties and a situation in Britain that allowed political party boasts that "you've never had it so good".
However, when we look more closely we see that in fact 1962 and 1966 showed no growth in total movements compared to the previous year and are worth looking into further. Interestingly, both years show a dip in the rate of economic growth. In the case of the UK, from which the bulk (73%) of the traffic was originating, GHP grew by 1.5% in 1962, down from 2.6% in the previous year. In the following year the British GHP growth rate recovered to 3.7%.
On the question of the relevance of GHP growth to this exercise, I would just mention that a small increase in the real volume of GHP can represent a significant increase at the consumers' discretionary margin. GHP growth is more easily available than other series and serves as a useful indicator of overall economic activity.
Similarly in the case of Ireland, there was a dip from 4.8% growth in GHP in 1961 to 3% growth in 1962, rising again to 4.6% in 1963. In fact while traffic as a whole showed virtually no change in 1962 compared to 1961, British origin traffic fell by 2%, compensated for by an increase in Irish originating traffic of 3%. Again that 3% growth in Irish originating traffic was lower than the 6% achieved in the previous year and than the 8% achieved in the succeeding year. If the total traffic in 1962 showed a fall of 1 % , air continued to gain and grew by 5% while sea fell by 5%.
we might also find some explanation for a decline of 8% in the category of VFRs visiting Ireland in that year.
The second year that showed off-trend performance in the 1960s was 1966 when there was zero growth. Again the economic indicators show a slowing down in UK growth to a 1.9% increase in GNP lower than the 2.6% achieved in the previous year and the 2.4% achieved in the succeeding year. Similarly in the case of Ireland, GNP growth fell to 1 % in 1966 compared to 2.2% in the previous year and 5% in the succeeding year. Again in a curious parallel with 1962, emigration in 1966 was down to 13,000 compared to 21,000 in the previous year and 16,000 in the succeeding year.
However, the contest between air and sea is quite interesting in 1966. Growth in movements by air actually accelerated in 1966 to 15% (compared to 7% in 1965) while movements by sea declined by 12%. In addition to the economic factors and reduced emigration levels, a factor to be mentioned in relation to the carryings of the surface carriers was a British seamen's strike which lasted from 16 May 1966 to 1 July. The six-week seamen's strike affected surface carryings but it must also have had some depressing effect on total movements in that year. Air carriers would not have picked up all the lost surface journeys. 1966 was the year in which Aer Lingus began introduction of jet aircraft to replace the Viscount turbo-props, but the BAC One-Elevens were used on services to the Continent and while they operated through Manchester, the stimulus that this advance in air transport would have had on Cross Channel air passenger movements would not have been significant in the context of the other circumstances of that year.
As a footnote to 1966, the Tourist category of visitors shows a fall of 2%, VFRs a fall of 5% and Business an increase of 16%, Examination of Irish and British origin traffic does not explain this odd result. An increase of 16% in Business traffic in one year is highly unlikely. Clearly there must have been some change in sampling procedures or category definitions in that year.
This was the first interruption in the growth of air at the expense of sea. We will look at this contest again a number of times as we move through the Seventies and Eighties to the present day.
3. THE PERIOD 19694976
During this period 1969-1976 cross channell passenger movements showed an average decline of 0.05% per annum followed by the 1976-1979 period when there was rapid growth averaging 10% per annum.
Over the period 1969-1976 there was one severe drop in 1972. As it happens, 1969 itself had shown a 5% increase in movements on 1968, a year in which the UK GNP growth rate dipped to 1.9% from 3.9% in the previous year. Still there was positive GNP growth year on year right up to 1973 at a level comparable to the GNP performance in the period 1964 to 1968.
Annual Percentage Change in GNP, 1969-1975 Britain Ireland
+ 5.0 + 3.0 + 4.3 + 4.3 + 4.2 + 3.4 + 0.7
In the case of the Irish economy, GUP grew strongly up to 1974: 1969 5%, and 3% to 4% per annum thereafter. Then in 1975 a serious slowdown in economic activity is revealed by a decline to an 0.7% improvement in the Irish GNP. In the case of the UK the economic downturn was both earlier and more severe with an actual fall of 1.5% in GNP in 1974 and 0.07% in 1975.
These figures of GNP growth (positive in both countries up to 1973) provide no explanation for the very poor growth performance of Cross Channel passen-ger movements. The explanation of course was in political events. 1969 had seen the first major confrontation between loyalists and nationalists at Burn-toilet during the famous Peoples' Democracy march from Belfast to Derry. That occurred on January 4. On July 14 of 1969 the first death involved
1969 1970 1971 1972 1973 1974 1975
in the Northern Troubles resulted from a melee at Dungiven. On August 14 there were six fatalities with the arrival of the British soldiers to quell rioting in Derry. But still, as I said, 1969 showed a 5% growth in movements over 1968. The impact of such events was to be more obvious in following years. On 28 June 1970 five people were shot in Belfast and on 3 July another four shooting fatalities occurred. That year saw no increase in Cross Channel passenger movements.
1971 was to open with four consecutive nights of rioting in Ballymurphy on January 11, and the first death of a British soldier on February 6. In April of that year the IRA blew up a British naval launch in Cork Harbour. 1971 showed Cross Channel passenger movements growing by only 1 % .
Let me divert for a moment to what was happening between the surface and air modes during 1970 and 1971 when total movements were stagnant. Aer Lingus introduced the B737 on the Dublin-London route in 1969, cutting travel times in half. British Airways also moved towards jet aircraft at that time. Despite this change sea and air traffic both grew by 5% and 4% respectively in 1969. However, in 1970 sea traffic fell by 9% and air traffic gained by 9% and this may have been influenced by the introduction of jets. Sea traffic was to fall again by 2% in 1971. However, apart from the longterm movement towards air and the introduction of jets on Dublin-London, the destruction by fire of the Menai Bridge between Anglesea and the Welsh mainland must have had an adverse effect on the surface mode. The Dublin-Holyhead route had to be diverted to Heysham for much of 1970 and 1971.
Returning to issues affecting the total volume of travel, on 30 January 1972 Bloody Sunday occurred in Derry during which thirteen civilians were shot. On February 2 the British Embassy was burnt in Merrion Square. 21 July 1972 was Bloody Friday with twenty-one IRA bombs exploding in Belfast and eleven people being killed. Ten days later six people were killed when three bombs exploded in Claudy, Co. Derry, The most serious fall ever in Cross Channel passenger movements occurred in 1972 with an 1 1 % decline on 1971 levels.
In view of this series of bomb explosions in Dublin, London and the events in Northern Ireland itself, one might expect 1973 to be a bad year for Cross Channel traffic. In fact, 1973 saw a 12% increase in Cross Channel passenger movements. While this was exceptionally good, it can hardly be taken to mean that violence was not impacting growth. The 1973 improvement on 1972 merely restored total movements to the 1971 level before the burning of the British Embassy in early 1972.
The events of 1974 must now be mentioned. In February an IRA bomb killed twelve British Army soldiers in Yorkshire. On 17 May four bombs exploded in Dublin and Monaghan killing a total of thirty-one people. On 17 June IRA bombs exploded at Westminster and at the Tower of London. Movements in 1974 were frozen at the 1973 level. The Birmingham bombing which killed 21 people took place in November, too late in the year to affect traffic.
In contrast, the events of early 1975 were less headline making, at least abroad, and the most outstanding Northern outrage, killing a record 11 people in one day, did not occur until October. A 2% growth in total movements was achieved. This improvement took place against the background of a slowing of economic activity which I've already mentioned.
The 2% growth in 1975 was not the low point. That small recovery was wiped out in 1976, a year which began with further explosions in Dublin and in Monaghan and on 21 July the British Ambassador, Christopher Ewart Biggs was killed in Dublin. Total movements fell by 3% in that year.
A few other points deserve comment. In 1972, the year of Bloody Sunday and the burning of the British Embassy, British originating tourists declined by 39%. In 1976, the year of the assassination of the British Ambassador, British tourists declined by 25%. If we go back to the year 1969 in which the troubles began, British tourists numbered 653,000. The first year of decline was 1970 (-14%). They fell to their lowest point - 362,000 - in 1976, a drop of 45% from the high point of 1969. Whatever weaknesses there may be in the categorisation of passenger by purpose of journey, the significance of this fail cannot be argued with. British originating tourists were not to recover to the 1969 level for over twenty years, i.e. 1989.
The relative performance of the Irish and British originating sectors just tells
us that British travellers were more affected by the violent events of the early
been in 1969. Looking year on year, Irish traffic behaved almost in sympathy, if that's the word, with the British traffic in the period 1970 to 1976 and in the years such as 1972 and 1976 in which British tourism traffic declined most severely, the Irish originating tourism movement to Britain also had its sharpest falls.
As is clear, I have been assuming that violence related to Northern Ireland exercised a key negative influence on Cross Channel passenger movements during the 1969-1976 period. Another factor however was also operating, i.e. the greatly increased availability and social acceptability of "sun holidays" - heavily promoted and heavily discounted. During the 1970s as a whole passenger traffic from Britain to Mediterranean area sun destinations increased by 106%. The abandonment of traditional Irish resorts like Bray and Bundoran by the British working class holidaymaker during the Seventies would have occurred even if the constantly reported violence had not been taking place. Comparable British resorts also declined during this period but in a steady way, without the sharp falls experienced by Ireland in 1972 and 1976.
When discussing the 1960s I mentioned emigration figures. The emigration situation had changed entirely during the Seventies when there was a net inbound migration from 1971 to 1978, averaging 13,600 per annum with the lowest inbound migration figure occurring in 1977.
Finally, there is one other important relevant event during this period to which I have not yet adverted, i.e. the oil crisis of 1973. There are two observations to make. The oil crisis caused an international recession but Britain did quite well in the short-term. The official British figures show a record 7% growth in GUP in the year 1973. That may be attributed largely to the exceptional growth in earnings from the North Sea oil fields and consumer expenditure grew in sympathy by 5% in that year. I suppose that the expansion of the British economy in 1973 contributed somewhat to the "out of phase" 20% growth in British tourists and 1 1 % growth in total British visitor traffic in 1973 relative to the low point of 1972, I would believe however that most of the 1973 growth must be explained by some recovery to "normal" levels from the disastrous 14% decline experienced in 1972.
total and the sea increased its share back to the 1970 level. The surface mode did not hold the advantage for long and in 1976 the air share recovered to 53% - the level which was first achieved in 1966 before the drive-on/drive-off car ferries were introduced, and achieved again in 1972 before the first oil crisis. In the wake of the oil crisis travel between Britain and all European destinations showed similar characteristics between 1972 and 1975 with a 6% drop in air share.
4. THE PERIOD 19764979
After 1976 the situation changed dramatically. The years 1977 and 1978 saw the largest increases to that date in Cross Channel passenger movements -an increase of 12% in 1977 -and 16% in 1978.
This is a brief but very interesting period on which to dwell. With regard to the economic background, the Irish economy grew by 5.8% in 1977 which compared to 1.5% in the previous year. In the following year a similarly strong growth in the Irish GNP of 5.7% was recorded.
In the case of the UK, nothing particularly spectacular emerges from its record of economic activity. In 1977 GUP growth was 2.6%, virtually the same as in the previous year, and in 1978 there was a stronger 3.4% increase. Accordingly, 1978 was the third successive year of fairly reasonable growth but not spectacularly different from what happened in 1970 to 1972.
The idea that people had just got tired of violence and that both economies were growing comfortably is hardly acceptable as an explanation for the sudden surge. When we look at the performance of the different modes we find some of the explanation. In 1977 sea traffic grew by 24% (191,000) and air traffic by only 1 % . Additional ferry capacity and improved vessel standards, supported by strong marketing and pricing initiatives by the surface carriers, explain the size of the recovery in 1977 and 1978. Indeed, a price war took place between the two main surface carriers, i.e. B&l and British Rail. In the following year, 1978, sea traffic again had a major increase and grew by 2 1 % (201,000) but air traffic was to pick up and grow by 1 1 % .
Looking at whether the traffic surge originated in Britain or Ireland, we dis-cover that both grew equally strongly. Over the two years British originating traffic increased by 27% and Irish originating increased by 29%. As for reasons for travel, British originating tourists showed a 5 1 % increase over the 2-year period - the same percentage increase as was achieved by the surface mode. The mobile British visitor was growing and compensating somewhat for the resort based visitor. Oddly, I think, there was a 42% increase in business traf-fic while VFRs showed virtually no increase over these two exceptional years for total growth.
These figures for business and VFR growth are surprising, to such an extent that one may be somewhat sceptical about how people interpret questions with regard to purpose of journey. Nonetheless, the fact is that between 1976 and 1978 total passenger movements Cross Channel increased by 29%, a larger increase than occurred over any two-year period before or since.
The increase in the car ferry fleets was obviously important but the massive increases in 1977 and 1978 must also represent a release of demand which was suppressed in 1975 and 1976 by the violence of those years, particularly the Birmingham bombing and the killing of the British Ambassador.
1979 saw an entirely different growth performance. From the all time growth record of 16% in 1978, passenger movements in 1979 were only 2% above the level of the previous year. The air mode increased by 5% compared to zero growth for sea. The two countries contributed equally to the low growth. Traffic ex Britain increased by 2%, exactly the same increase as for the Irish originating traffic.
1979 was also the year of the killing of Lord Mountbatten and the beginning of a trough in movements ex Britain that was to bottom out in 1981. In terms of the economic background, 1979 was the beginning of a slowdown. The UKGNP growth declined from 3.4% to 2.8% in 1979, a growth rate that would not be again achieved until 1983.
Economic activity in Ireland was also slowing down from 5.7% in 1978 to 3% in 1979.
1979 1980 1981 1982 1983 1984 1985
+ 2.8 - 1.7 - 1.0 + 1.5 + 3.5 + 2.1 4- 3.6
Of course, there were other economic factors at work - anti-inflationary mon-etarist policies in the UK and the contrasting reluctance in Ireland seriously to address financial problems.
5. THE PERIOD 1980-1985
The relative performance of the UK and Irish economies over this period is worth observation:
Annual Change in GNP, 1979-1985 Britain Ireland
+ 3.0 + 1.7 + 2.1 - 1.7 - 1.2 + 1.6 + 0.3
Britain's recession was earlier but relatively brief. Ireland's recession was later and more prolonged.
These figures give an opportunity to examine an assumed relationship between traffic growth and GNP as a measure of economic activity. Did movements ex Britain improve as UK GNP improved? The answer is definitely yes. Did Irish originating traffic do likewise? The answer is more complex.
Movements Variation per annum
Ex Britain Ex Ireland Total
+ 4% + 1% - 7% - 4% + 2% + 3% - 1% + 2% 0 + 3% 1980
1981 1982 1983 1984
- 1 % - 3 %
Certainly the Irish traffic ceased to decline again after the economic indicators of annual change in GHP bottomed out in 1983. However, there was a serious drop (-7%) in 1981 which was the biggest single setback in the Irish originating sector over the entire period we are examining. Traffic ex Britain also declined (-3%) in that year.
There was another factor at work - the effect of increasing oil prices on the cost of travel. In 1978 the average price per gallon quoted by OPEC Review was $13.3 per barrel. That rose to $18 per barrel in 1979, $30 per barrel in 1980, $36 in 1981, after which oil prices remained fairly stable until they fell abruptly in 1986.
Increased oil prices required widespread and significant increases in fares charg-ed by commercial airlines. The relative performance of air and sea carriers over the next few years tells an interesting story. The actual levels of air traffic declined steadily between 1980 and 1983 and in each successive year after 1979 the air share declined. It stood at 47% in 1979 and then slid to 44%, 43%, 40%, 38% until in 1985 the air share increased by 1 % to 39%, still well below the level achieved in 1979. In addition to the increase in air fares which gave a relative advantage to the sea mode, the years 1982, 1983 and 1984 saw acute price competition between the two surface carriers, Sealink and B&l. I recall that Aer Lingus saw its market share decline, sought consolation in the strong growth in car accompanying traffic on the ferries for which it was unable to compete effectively, and pointed out that in comparison with the air share across the English Channel, the Irish Sea air share was not unreasonable. Despite the surface growth, the contest that was taking place between the two surface carriers, giving them additional price advantage compared to the airlines resulted as can be verified by B&Ps reports, in emerging financial difficulties for that carrier.
To summarise the period of the early Eighties, initially there was a recession in the UK and then economic improvement took place. In Ireland the recession was later in coming but was more prolonged. Traffic growth was slow from both the British and Irish regions. As a result of rising air fares, the competitive price advantage of the surface carriers was increased. Competition between the surface carriers resulted in further strengthening their price advantage relative to the air mode. Meantime the surface carriers were all the time benefiting from the increased trend towards the mobile tourist. In the general economic circumstances the price competition among the surface carriers does not appear to have boosted traffic but it clearly affected the relative performance of the air mode. On the other hand, the level of air fares not merely contributed to the performance of the surface carriers but it must have operated as a deterrent to the expansion of the total market.
6. THE PERIOD 19864990
The period 1986-1990 concludes our survey but it is remarkable in several ways and justifies considerable comment before making some observations about what is happening in the current year.
Over the four-year period annual total movements Cross Channel increased by 54% compared to a total increase of 120% in the previous twenty-six years. The average annual growth rate between 1986 and 1990 was 11.3% compared to an average for the previous twenty-six years of 3 . 1 % and the 4 . 1 % average for the entire thirty-year period. The period ends conveniently with the last year for which we have complete results. However, a survey in ten years time would also identify 1990 as a year in which the fast growth tapered off and a new phase of (at best) slow growth commenced.
Eight-ies had already ended. A few very limited fare reductions were introduced by the incumbent carriers in November 1985 and in February 1986 some further changes were introduced. Pressure was mounting on the air carriers to reduce air fares further and substantially in view of the fact that world oil prices were falling steeply. The US dollar price of oil had stayed fairly stable between 1982 and late 1985 when it roller-coasted downward. Simultaneously there was a fall in the value of the dollar, as a result of which the price of oil in Irish punt terms fell by 54% between 1984/85 and 1986/87. As a percentage of airline operating costs Cross Channel fuel fell from 20% to 9.5%. The impact on marginal round trip costs was even more dramatic.
The pricing tactics, the marketing rationale and the market share achieved by the different airline combatants in the ensuing contest is a topic for a fascinating study all of its own. Suffice it to say that the highly structured tariff based on a segmented approach to the market, being charged by the incumbent carriers - with an unrestricted Executive return fare of £200 at one end and the heavily restricted Apex fare of £87 at the other - was seriously undermined by the Ryanair initiative of a £99 return fare offered on a "no restrictions/no frills" basis.
Ryanair commenced Luton services in April 1986 with a limited capacity HS748 operation. The incumbent carriers did not make radical tariff changes or reductions until July of that year. Surface carriers held firm through 1986 with their 1985 tariff levels, but the extent of their loss of traffic was such that they reacted strongly in 1987. As a result, by the Summer of 1987 one can say that the cost of Cross Channel travel had been reduced very significantly. It is not possible in a realistic way to say what the average reduction was. The major carriers (air and surface) still maintained a highly segmented tariff approach. For many people the cost of an air journey across the Irish Sea fell by 50%; for others there was no reduction. The reaction of the sea carriers was such that it reduced the cost of surface travel by 30% for much of its traffic and by still more depending on the number of passengers per car. The intense competition among the air carriers and the impact of their new low fares on the surface mode resulted in the surface carriers abandoning the pricing accord which they had arrived at in 1985.
1986 1987 1988 1989 1990 1991
3.8 4.6 4.2 1.8 2,4 0.2
Annual Percentage Change in GNP, 1986-1991 UK Ireland
- 0.9
+
4.8
+
2.4
+
4.7
+
6.0
+
2.7
If we had already established a simple correlation between economic growth and increasing travel, one would expect on the basis of this data that 1987 and 1988 were both years which would have shown somewhat above average growth out of the UK with a tapering off thereafter. The more irregular data for Ireland would still indicate that reasonable growth might have taken place but no more than that.
Were there any significant product changes? Not really. Certainly the ma-jor increase in frequency of air services that took place over the period did represent a significant improvement in product but this was triggered by vol-umes. The product change of increased frequencies of itself would not have generated the increased volumes.
Levels of emigration are something else that we have looked at rather incon-clusively, I'm afraid, as a factor affecting travel volumes. Throughout the 1970s there had been net inward migration. The 1980s opened with very low net emigration coinciding with a period of depression in the UK. By 1984 as the UK economy strengthened and the economic conditions in Ireland con-tinued to deteriorate, net emigration rose to 20,000, the highest outward movement since 1964. It then continued to rise so that by 1988 net emi-gration at 46,000 was higher than in any year since 1958. The combination of this level of emigration with lower air and surface fares clearly exercised a positive influence on the total numbers of Cross Channel movements as recent emigrants found occasional or even frequent visits home to be an affordable option. The whole question of the frequency of travel is one to which I will return later.
which lost 8% in the volume of passenger movements after having shown no change in 1985. Despite the change in air fares, total traffic in 1986 did not increase at all after four years of low if steady growth. Perhaps one might say that they were introduced too late to have a major effect on travel plans. Also of interest is the fact that UK originating passengers actually declined by 5% in 1986 after falling by 10% in 1985. In contrast, Irish originating traffic grew by 9% in 1986 having already increased by 7% in 1985.
I have mentioned before that the inbound movements include persons whose travel originated outside the UK, e.g. in the United States or Continental Europe. The exceptional decline of 19% (80,000) in US visitors to Ireland in that year, principally due to the collapse of the dollar, must have been an important factor in the reported fall in passenger movements ex Britain. Perhaps 50% of the fall of 70,000 in British originating visitors in 1986 was due to the US factor.
The following year, 1987, was the first of three years of substantial growth in total movements, averaging 13% per annum. 1987 saw a 3 1 % increase in air traffic and, no doubt because of the reduction in surface tariffs, the decline in sea traffic was reduced to 1 % (compared to 8% in 1986). Both UK and Irish originating movements increased by 13%. In absolute numbers, UK originating passengers increased by 177,000 while Irish originating movements increased by 129,000 - slightly higher in both cases than the previous record traffic increases in 1978. The air share once again exceeded 50%, a level which it had held through the early Seventies before falling to 38% in 1984 and 1985.
1988 again saw spectacular growth. Travellers ex Britain grew by 17% but traffic growth out of Ireland slowed down to 8%. Air traffic grew by 29% and sea continued to decline (-3%). As in 1987 the total traffic grew by 13%. There is one important factor I must interject here. The boom in air travel was not merely an Irish Sea phenomenon. Across Europe airlines were recording greatly increased growth rates in 1988 and again in 1989, higher than many of them had experienced for decades. Reduced oil prices aided the reduction of fares which increased competition was forcing on airlines.
lost the individual "foot passenger" to the air mode but was making up for this by astute promotion and exploitation of the car accompanying traffic. Surface passenger numbers were also being helped by coach travel, especially on the southern (Rosslare-Fishguard) route.
However, after three years of almost explosive growth and of disturbance between the air and surface modes, the figures for 1990 Indicate that the boom and the disturbance were running down. Total traffic grew by 6%, only half the rate of the previous year, while the two modes had similar levels of growth: air 7%, sea 6%.
Once again the origins of the passenger movements are of interest in these years. The faster growth of the UK segment which began in 1988 continued through 1989 and 1990. Over the three-year period UK originating move-ments increased by 52% while movemove-ments originating in Ireland increased by 17%. Finally with regard to the air and surface modes, air carriers not merely broke once again through the 50% barrier in 1987, but they passed the 60% mark in 1990.
One must enquire as to why the rate of growth slowed down in 1990 to a level that was only half that achieved in 1989 and 1988. There are at least four points to be noted:
• the economic downturn in the UK was reflected in a reduction in the volume of movements abroad by British residents to all destinations;
• the unsettling effect on the international travel market of the Middle East disturbances which commenced in early August 1990;
• the fact that the 6% increase, achieved in 1990, amounted to 216,000 movements, a very substantial number which would have represented a near record increase before the 1986 "take-ofP' in Cross Channel move-ments;
7. ECONOMICS OF TRANSPORT PROVIDERS
I must dwell for a moment on the economics of the transport operators. The largest operator in terms of Cross Channel passengers carried is Aer Lingus (37% compared to 26% for Sealink). Every year since 1984/85 Aer Lingus has reported sizeable Group profits which tend to deflect attention from the financial outcome of its air transport operations. The results of its air transport operations are as follows:
Aer Lingus Intra-European Air Transport Results £m
1986/7 1987/8 1988/9 1989/90 1990/1
Operating - 2.1 + 3.7 + 1.7 - 17.9 - 27.2
Net (after interest) - 1.1 + 6.1 + 1.8 - 20.3 - 43.2
The divergence between the operating and the net results in the last two years arises from the cost of servicing investment in new aircraft.
The Aer Lingus intra-European air transport results can be taken as a reason-able enough indicator of the operator's profit or loss trends on Cross Channel routes over recent years. Net results on the Atlantic route which is excluded from these figures actually improved over this period. Data on average air fares charged by Aer Lingus on the London routes which comprise 70% of total Cross Channel movements is also available.
Current Prices Constant Prices (base yr.f85)
IR£ IR£
78.20 64.03 55.14 52.61 51.20 53.28
We see from this table that average Aer Lingus fares on the London routes after falling by £ l l . 3 5 or 26% up t o 1988/89 have since increased by £5 or 8.7%. The increase of 8.7% from the low point of 1988 is well behind UK
1985/86 1986/87 1987/88 1988/89 1989/90 1990/91
inflation for the same period if somewhat ahead of Irish inflation. However, it is still of interest that over the entire period 1985 t o 1990 there was a decline in real terms of 32%. Of course, with the exception of the periods immediately following the two oil crises, air fares internationally have shown a longterm downward trend in real terms but at a fraction of the rate that we have seen recently.
The deterioration we have noted in the Aer Lingus bottom line for air transport is not surprising in view of the decline of 32% in real terms in average revenue per passenger at a time when additional capacity was being acquired and existing capacity was being renewed. Cost reductions which can compensate for such a decline in unit revenue while fleet renewal and expansion is required is beyond the realm of reality.
What about other operators? The only one for which profit figures are readily available is B & l . Its problems are well known. B&t's entire shipping fleet operates on the Irish Sea and it is many years since it returned a net profit. As a result of the combination of factors - loss of market share and reduced revenue per unit of business - which took their effect in 1987, a Plan for Viability was launched and major savings were made in operating costs. In addition, between 1985 and 1989 state investment in B&l was increased by £47 million. However, B8i\ whose passenger business has now declined to 40% of the total has not yet returned a bottom line profit.
B&l's unit revenues and average fares are also worth noting. The 1991 peak charge for a car and four adults is £160 compared to £165 in 1985. In the shoulder period fares of £95 and £115 compare to a flat £115 in 1985. Sustained annual cost reductions exceeding annual inflation levels is the only device that can achieve viability with such revenue trends. For a carrier which started the period 1986-1990 incurring losses, the task would be more than formidable.
Of the other surface carrier Sealink/Stenaline we have never known precisely how they have done though they justified their participation in the 1985 price increases in terms of financial results. Nor do we know their recent results before or after change of ownership except that earlier this year a major cost saving programme was deemed to be necessary.
years. Not merely must these airlines not have been profitable, it is reasonable to conclude that they withdrew because despite the difference in size and cost structures that existed between them, they all perceived the continuing losses which the routes incurred as not being capable of being sustained.
Of Ryanair we know that they have never made a profit, Since incorporation they have incurred losses of over £20 million. In another forum one might speculate as to whether given the fares being charged by the incumbent car-riers in 1986, it was either wise or necessary for them to pitch their initial fare as low as £99. A return fare of £120 or £130 might have given them a reasonable margin which would have avoided losses which in view of the relatively small scale of their operation were extraordinarily heavy. It is a view which I happen to know is shared now in retrospect by Ryanair's recently retired Chairman.
Finally we have British Midland who have claimed to be "on target". How-ever, the flavour of the plea they are making to the European Commission concerning "interlining" on the route may suggest that all is not well. Leaving that issue apart, BMA's capacity to operate profitably on their Irish routes must be doubted in the light of the withdrawal of four British airlines because of unsatisfactory results as well as the losses being incurred by the two Irish based airlines and by the Irish ferry operator.
I have dwelt on the returns of the transport operators because I believe that simple observations of levels of growth which were stimulated principally by lowering of travel charges requires consideration as to whether the present historically low level of charges are likely to continue in the tight of the losses being experienced by the transport providers. The Statistical Society is not the forum to debate competitive marketing issues, to analyse tactical and strategic decisions of various transport operators, or to speculate as to whether scope remains for sufficient cost reductions to close the gap between the costs and the revenue of transport operators. Still I think it is appropriate to say that the rapid growth which has taken place has been riding a wave of low fares. All waves must run their course, When it hits land it is as likely to crash violently on the rocks of corporate realities as it is to break gently on smooth ground leaving an undisturbed market in its wake.
Indeed, in the 26 years up to 1986 the Irish origin segment grew by a factor of 3.4 while traffic from abroad grew at little over half that rate (1.75). When the faster growth of traffic ex Britain in most recent years is taken into account, the record of the entire period 1960-1990 shows that traffic out of Ireland increased by a factor of 4.5 while traffic originating abroad increased by a factor of 3. In 1960 the ratio of ex Britain traffic to ex Ireland traffic was 2.8 to 1. In 1990 the ratio was much lower at 1.8 to 1.
The next point is that frequency of travel has increased. We did not have any measures of frequency of travel until recent years and comprehensive comparable data is still not available. However, the indications are clear. The NESC Report No. 90 (The Economic and Social Implications of Emigration) noted that "in 1987 there were 22,500 visitors from overseas by people born in Ireland who had left Ireland within the year. In 1988 this increased to 64,700 due to an extraordinary rise in the number of this type of visitor from Britain. This very high figure includes multiple visits". Bord Failte data show an increase of 55% between 1988 and 1989 in the number of visitors from Britain who said that they had visited Ireland at least once previously within twelve months (up from 637,000 in 1988 to 991,000 in 1989). Again within one year alone the number who claimed to have made three or more visits to Ireland over the previous twelve months increased by 88%. The still more frequent travellers (six or more trips within a year) grew by 200% - up from 33,000 in 1988 to 92,000 in 1989.
Less startling are some results of an Aer Lingus survey of Irish originating travellers on the London route which indicates that in 1988/89 each traveller made an average of 1.49 visits per year. Business travellers averaged 2.46 visits per year. Data on earlier years is not available.
8. THE YEAR 1991
Finally, a word about 1991. The situation has changed radically once again. Not merely is the period of rapid growth over but the level of movements is down for the first time since 1981. The decline for the nine months to September 30 is 4.3% with both movements ex Britain and ex Ireland falling by the same percentage. There was I believe a more severe fall in the early months (affected by the Iranian conflict) than later on. Looking at the two modes: air traffic is down - by 13% for the nine months. In contrast, sea traffic is up by 8.4% and the air share, which reached 60% in 1989 and 1990, is having its most serious slide ever in one year - perhaps to 55%. Factors discussed in this paper are again at work in this ever changing situation -particularly price and economic recession.
9. CONCLUSION
APPENDICES
PASSENGER MOVEMENTS -19604990
Tables
1. Total Cross Channel movements subdivided by origin.
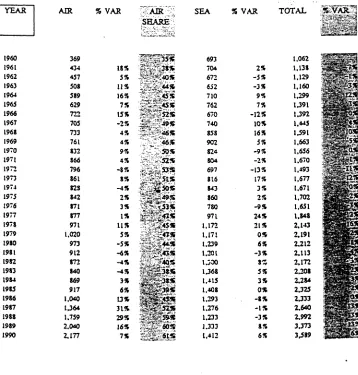
2. Total Cross Channel movements subdivided by mode.
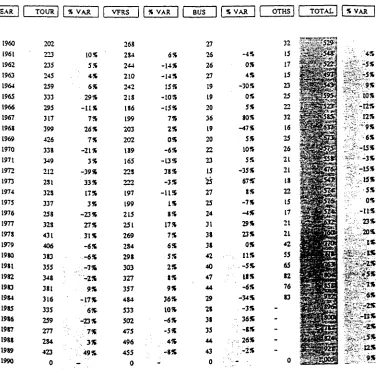
3. Total Cross Channel movements (air and sea) subdivided by purpose of journey.
4. Ireland origin: a) sea movements b) air movements,
each mode subdivided by purpose of journey.
5. Total Ireland origin subdivided by purpose of journey.
6. Britain origin:
a) sea movements b) air movements,
each mode subdivided by purpose of journey.
7. Total Britain origin subdivided by purpose of journey.
8. a) Total sea movements (Ireland and Britain origin) b) Total air movements (Ireland and Britain origin)
Graphs
1. Total movements 1960-1990 (linear)
2. Total movements 1960-1990 (log)
3. Total movements 1960-1969
5. Total movements 1979-1990
6. Total Air and Sea v. Air (1960-1990)
7. Total Tourist Ireland v. Britain (1960-1990)
8. Total VFRs Ireland v. Britain (1960-1990)
9. Total Business Ireland v. Britain (1960-1990)
GROWTH RATES
1960-1990
AVERAGE GROWTH R A T E PER ANNUM: TOTAL GROWTH : 2385
1960-1969
AVEJUCE GROWTH R A T E ?SR ANNUM: TOTAL GROWTH : 57 %
1969-1976
AVERAGE GROWTH RATS PER A N N U M : TOTAL GROWTH : Q%
1976-1979
GROWTH RATS PER ANNUM: TOTAL GROWTH : 19%
10 S
1979-1986
AVERAGE GROWTH R A T S PER .ANNUM: TOTAL GROWTH : 7%
1986-1990
Tabfe /.
TOTAL CROSS CHANNEL PASSENGER MOVEMENTS
YEAR 1960 1961 1962 1963 1964 1965 1966 1967 1963 1969 1970 1971 1972 1973 1974 1975 1976 1977 1978 1979 1980 1981 1982 1983 1984 1985 1986 1987 1938 1989 1990 BRITAIN ORIGIN 784 843 824 832 935 1,010 1,004 1,053 1.129 U 6 3 UG3 1,108 951 1,056 .055 ,073 1.023 1.147 1,317 1347 1,337 1,302 1,341 U 8 8 1,463 1.447 1,378 1.555 1,322 2,128 2,357 % VAR
t %%
-2% 1% 12% 3% - 1 % 5% 7% 3%
-5%
Q% - 1 4 %
1 1 % "
0% 2% -5% 12% 15% 2% - 1 % - 3 % 3% 4% 5% - 1 % - 5 % 13% 17% 17% 11% IRELAND ORIGIN 278 295 305 328 364 331 383 392 462 500 S53 562 542 621 616 624 629 701 326 344 875 311 831 820 821 877 956 1,085 1,170 1.244 1,26? % VAR 6% 3% 3% 11% 5% 2% 1% 18% 3% 11% 2%
- 4 %
15% -t% 1% 1% 11% 13% 2% 4% -7% 2%
- 1 % 0% 7%
9%
1 3 * 3% 6% 2% TOTAL 1,062 1,138 .129 ,160 ,299 ,391 U 9 2 1.445 1,591 1.663 1,656 ,670 ,493 ,677 1,671 ,702 1,657 1.843 2443 2,191 2,212 2,113 2.172 2,208 X2U
2 J 2 4 2*334 2,640 2*992 3,372 :1,624 % VAR 7%
- 1 % 3% 12% 7% 0% 4% 10% 5% 0% 1% -11% 12% 0% 2%
TOTAL CROSS CHANNEL PASSENGER MOVEMENTS Table 2. TEAR 1960 1961 1962 1963 1964 1965 1966 1967 1968 1969 1970 1971 1972 1973 1974 1975 1976 1977 1978 1979 1980 1981 1982 1983 1984 1985 1986 1987 1983 1989 1990 AIR 369 434 457 508 589 629 722 705 733 761 832 866 796 861 828 842 871 877 971 1,020 973 912 872 840 869 917 1,040 U 6 4 1.759 2,040 2,177 % VAR 18% 5% u% 16% 7% 15% -2% 4% 4% 9% 4% - 8 % 8% -4% 2% 3% 1% 11% 5% -5% -6% -4% -4% 3% 6% 13% 3 1 % 29% 16% 7% AIR SHARE . ^ ^ *v-0 ***
i * '--46£ 46%
* \ 50%
:. - s**
* \ *v 5355
"A^V 4*55
""/ \ffjyk%
^%^39t%
" i«** 6t%;
SEA 693 704 672 652 710 762 670 740 858 902 824 804 697 816 843 860 780 971 1,172 1,171 1,239 1,201 UOO 1.368 1,415 1,408 1,293 1.276 1,233 1.333 1,412 % VAR 2% - 5 % - 3 % 9% 7% -12% 10% 16% 5% -9% -2% -13% 17% 3% 2% - 9 % 24% 21% 0% 6% - 3 % 81&
5%
3%
0%
- 8 % - I S - 3 % 8% 6%
TOTAL -%W
!•<** l l p i i !
u38 mam
U29 ; ^ f e |
U91 i ^ ^ *
un
WL
pi
.663 ^ » S
•«« : ^ » P
.«*
;^ W
,677 ^ f e |
U7O2 l ^ ^ f e i.65t ; ^ ^ p |
2443 ^ ^ ^ ^
2491 fillip
2,212 i^M!5 2413 ^ p ^ P ?
2472 ^ ^ ^ 3
2-201 H H H S
W84 n 2.325 • » !
^3 S i
3.373 | | g g
TOTAL PASSENGERS (PURPOSE OF JOURNEY)
Tabtc 3.
AIR AND SEA COMBINED :
YEAR | | TOUR | | % VAR TOTAL 1 1 % VAR 1
1960 1961 1962 1963 196* 1965 1966 1967 1963 1969 1970 1971 1972 1973 1974 1975 1976 1977 1978 1979 1980 1981 1982 1983 1984 1985 1986 1987 1988 1939 1990 387 450 455 469 570 666 656 664 783 S05 706 741 507 623 697 763 613 702 873 836 791 701 680 740 673 744 658 698 762 976 0 1655 1% 3 % 22% 17% -2% 1% 18% 3% -12% 5% -32% 24% U% 9% -20% 15% 25% -5% -5%
• 1 1 *
-3%
9% -9%
Ct%
•"•* - - 1 2 %
• 6%
9%
- -'- 2 8 * •
432 513 475 4S0 513 511 487 497 538 542 590 597 680 684 565 574 635 659 717 737 780 7S9 783 805 964 1163 1226 1420 1594 1704 0 7% -8% 1% 7% 0% -5% 2% 3% 1% 9% 1% 14% 1% -17% 2% 11% 4% 9% 3% 6% 1% -1% 3% 20% 21% 5% 16% 12% ?% -100% 131 123 151 163 153 151 175 202 200 225 261 240 225 269 281 276 231 316 405 432 448 417 442 441 422 427 472 502 636 693 0 -2% 18% 8% -6% - 1 % 16% 15% - 1 % 13% 16% -8% -6% 20% 4% -2% 2% 12% 28% 7% 4% -7% 6% 0%
- 4 %
I S 11% 6% 27% 9% -100% 62 4 2 48 43 63 63 74 82 70 91 99 92 31 96 123 89 128 171 143 136 193 206 267 222 225 220 0 0 0 0 0 7% 3% 12% 7% 0% 4% 10%
* Q%
- 1%
-11% 12* 0% 2% -3% 12% 16% 2% 3% 2*
; L*
13% 13% 7*
IRELAND ORIGIN PASSENGERS Table 4a. 1960 1961 1962 1963 1964 1965 1966 1967 196$ 1969 1970 1971 1972 1971 1974 1975 1976 1977 197$ 1979 1980 1981 19$2 1983 1984 •1986 •1987 •198$ •lf$9 1990 32 42 39 46 51 57 43 48 75 66 74 91 S3 134 143 182 153 166 190 18$ 21$ 130 189 221 210 206
m
164 144 150 0 31% -7% 13% 11% 12% -25% 12% 56% -12% 12% 23% - 9 % 61% 7% 27% -16% 3% 14%- t % 16% -17% 5% 17% -5% -2% -4% -17% - 1 2 % 4% 92 85 85 85 35 87 77 30 U4 120 127 109 100 96 78 71 66 101 137 132 159 157 164 17$ 175 273 261 291 227 -8% 0% 0% 0% 2% -11% 4% 43% 5% 63 -14% .%% -4% -19% -9% -7% 53% 36% -4% 20% - 1 %
4% 9% - 2 % 56% -4%
1 1 %
-22% 0% 27 20 17 15 15 12 13 13 20 22 29 21 19 13 23 13 21 29 39 33 31 41 41 36 27 33 36 34 3$ 35 0 -26% -15% -12% 0% -20% 3% 0% 54% 10% 32% -23% -10% - 5 % 28% -22% 17% 38% 34% -15% -6% 32% 0% -12% -25% 22% 9% -6% 12% -8% -5%
\ - 4 %
4%
8%
• : 0 % - 1 2 %
6% 43% 3% 9% - i % -10% 23% -15S 6% -4% 25%
2 t * ~3* -551
n%
;2* c'"-t% -16* t%- I *
Tabfa 4b.
IRELAND ORIGIN PASSENGERS
A I R :
YEAR I | TOUR 1 I % V ARI I VFRS
1960 1961 1962 1963 1964 1965 1966 1967 1963 1969 1970 1971 1972 1973 1974 1975 1976 1977 1978 1979 1980 1981 1982 1983 1984 •1985 •1986 •1987 •1988 •1989 1990 40 50 4 4 4 2 55 66 31 70 73 36 70 84 78 78 94 97 93 82 113 116 85 85 66 62 59 79 97 124 146 153 0 25% -12% - 5 % 31% 20% 23% -14% 4% 13% -19% 20% -7% 0% 21% 3% 1% -16% 44% -2% -27% 0% -22% -6% -5% 34% 23% 28% 11% 8% -34 4 2 50 66 74 85 85 33 36 90 117 134 142 149 120 131 126 120 134 135 127 131 113 105 111 142 213 294 390 417 0 24% 19% 32% 12% 15% 0% 4% -2% 5% 30% 15% 6% 5% -19% 9%
- 4 %
-1% 12% 1% -6% 3% -10% - U % 6% 23% 50% 38% 33% 7% -. 32 39 51 54 53 51 60 61 63 69 87 76 79 93 93 83 94 103 131 141 153 127 120 114 124 178 213 254 390 417 0 22% 31% 6% 7% -12% 13% 2% 3% 10% 26% -13% 4% 13% 0% - 1 1 % 13% 10% 27% 3% 12% -20% -6% - 5 * 9% 44% 20% 31% 33%
r%
8 „ LT4
IO i-\f£tss* 11 ff*$$l"&'} io ^S?i98T: 12 & ^ l % ^ 15 ^ £ § 3 2 17 /$&£&&
19 3s$S$
26 * j l 30 £38
22 Ifegggg
22 " § ^ P ^ 3i rt|y|2| 40 jj^fSjj
s lip
56 Lv&38E 30 l-S;i^ 51 \*$<g&. 44 r!^$<WP30
isP^
31
tfPS
29 faElfl
i 0 I 23% 11% 12% 14% 13% 2%= - tt% ^12% :*% : 2% . 9% -2% ' 5%.. 1 * 15% 7% - 7 %
-10* -10%
- 7 * 3 *
;26%
r 3 6 * , , , 3 0 * ! , . : > • • * * j - O *
TOTAL IRELAND ORIGIN
Table 5.
AIR AND SEA COMBINED : YEAR 1 I TOUR 1 I % VAR
1960 1961 1962 1963 1964 1965 1966 1967 1968 1969 1970 1971 1972 1973 1974 1975 1976 1977 1978 1979 . 1980 1981 1982 1983 1984 1985 1986 1987 1988 1989 1990 72 92 83 33 106 123 124 U 3 143 152 144 175 161 212 237 279 251 248 308 304 303 265 255 283 269 235 294 238 290 308 0 23% -10% 6% 20% 16% i% -5% 25% 3 % -5% 22%
- 8 % 32% 12% 13% -10% - I S 24 S - 1 %
0% -13% - 4 % I t *
-5% $% 3% -2% I S 6% • 126 127 135 151 159 172 162 163 200 210 244 243 242 245 193 202 192 221 271 267 236 238 232 233 236 291 474 585 617 644 0 1% 6% 12% 5% 8% - 6 % 4% 19% 5% 16%
0 % •
0% 1% -19%
2%
- 5 % 15% 23% - I S 7% I S - 2 % 0% 1% 2% 63% 23S 5% 4 * • « - ' 59 59 63 69 73 63 73 74 83 91 116 97 98 l i t 116 101 115 132 170 174 189 163 161 150 151 177 133 212 263 292 0 0% 15% t% 6% -14% 16% 1% 12% 10% 27% •16% 1% 13% 5% -13% 14% 15% 29% 2% 9%
-n%
- 4 %
•••• i s
rrs
6% 13% 24%
'•'•"• ' - U S
• * • . • •: » • 21 17 19 20 26 23 29 32 31 47 49 47 41 53 65 42 71 100 77 99 97 90 133 104 115 113 0 0 0 0 o 6% 3% 8%
n%
15% IS 12%:I 8 S 4% - 7 *
Z%
BRITAIN ORIGIN PASSENGERS
Table 6a.
S E A ;
YEAR 1 (
1960 1961 1962 1963 1964 1965 1966 1967 1963 1969 1970 1971 1972 1973 1974 1975 1976 1977 197$ 1979 1980 1981 1982 1983 1984 1985 1986 I9f7 1938 1989 1990 TOUR 1 202 223 235 245 259 333 295 317 399 426 338 349 212 231 323 337 258 323 431 406 383 355 348 381 316 335 259 277 234 423 0
| % VAR ] (
10% 5%
• - 4%
6% 29% -U% 7% 26% 7% -21% 3% -39% 33% 17% 3% -23% 27% 31% -6% -6%
; ; :- 2 %
9!% -It%
6%
; ' -23%
'•;': - . 7%
.. X 3% 49%
• • ' »
VFRS |
268 234
2 4 4
210 242 218 136 199 203 202 189 165 223 222 197 199 215 251 269 234 298 303 327 357 434 533 502 475 496 455 0
| % VAR [ (
6% -14% -14% 15% -10% -15% 7% 2% 0% -6% -13% 38% - 3 % -11% t% 3% 17% 7% 6% 5% 2% 3% 9% 36% IQ% -6% -5%. 4% - I S
BUS ] 27 26 26 27 19 19 20 36 19 20 22 23 15 25 27 25 24 31 38 38 42 40 47 44 29 28 33 35 44 43 0
| % VAR j [
-4% 0% 4% -30% 0% 5% 80% -47% 5% 10% S% -35% 67* 3% -7%
- 4 %
29% 23% 0% 11% 18% -6% -14% -3% : 36%
•: r->; 2 6 %
OTHS 32 15 17 15 23 25 22 32 16 25 26 21 21 13 22 15 17 21 2i 42 55 65 82 76 83 -0
1
523* ' • $ %S;:t0%
I '-B^f'tift
;i#;i2%
'0-9%
*:'iJ:-/;'6%
:-:M-is%
Table 6b,
BRITAIN ORIGIN PASSENGERS
AIR: YEAR 1 I960 1961 1962 1963 1964 1965 1966 1967 1968 1969 1970 1971 1972 1973 1974 1975 1976 1977 1978 1979 1980 1981 1982 19S3 1984 •1985 •1986 •1987 •1988 •1989 1990
1 -TOUR 1
U3 135 137 136 205 210 237 229 236 227 224 217 134 135 132 147 104 126 139 126 105 31 77 76 38 124 106 143 138 245 0
| % VAR | [
19% 1% - 1 %
51% 2%
O % - 3 % 3% -4% -1% -3% -38% 1% -2% 11% -29% 21% 10% -9% -17% -23% -5% -1% 16% 41% -15% 35% 31% 30% VFRS | 33 107 96 119 112 121 139 130 135 130 157 139 210 217 170 173 223 137 177 136 196 198 174 165 194 215 25C 36C 481 605 0
1 % VAR | [
22% -10% 24% -6% 8% 15% -6% 4% -4% 21% 20% 11% 3% -22% 2% 32% -18% -5% 5% 5% 1% -12% -5% 18% U S 16% 44% 34% 2 6 S -BUS 1 45 43 57 67 61 69 32 92 93 114 123 120 H 2 133 138 150 142 153 197 220 217 209 234 247 242 211 222 265 329 358 0
| % VAR 1 [
-4% 33% 18% -9% 13% 19% 12% 7% 16% 3% -2% -7% 19% 4% 9% -5% 3% 29% 12% -1% -4% 12% 6% -2% -13% 5% 1»* 24% 9% • OTHS 9 10 12 13 14 15 23 18 23 19 24 24 19 25 41 32 40 50 45 45 41 51 52 42 27 -0 16% ' 2 %
P
8% 4* -14* 7% -6% .4* 2% 0% 8% 3S -3* OS -IS 4* OS • $% .30* , 21%us
TOTAL BRITAIN ORIGIN Table?, 1960 1961 1962 1963 1964 1965 1966 1967 1963 1969 1970 1971 1972 1973 1974 1975 1976 1917 1978 1979 1980 1981 1982 1983 1984 1985 1986 19*7 1988 1989 1990 315 358 372 331 464 543 532 546 635 653 562 566 346 416 460 434 362 454 570 532 433 436 425 457 404 459 364 410 472 668 0 1455 4% 2% 22% 17% -2% 3% 16% 3 % -14% f% - 3 9 % 20%
n%
5% -25% 25% 26% - 7 % - 8 % - 1 1 % - 3 %%% -12% 14% -21% 13% 15% r'4Z% 356 391 340 329 354 339 325 329 338 332 346 354 433 439 367 372 443 438 446 470 494 501 501 522 678 652 752 835 977 1,060 0 10% -13% - 3 % 3% - 4 % - 4 % 1% 3% -2% 4% 2% 24% 0% -16% 1% 19% - 1 %
2% 5% 5% 1% 0% 4% 30% - 4 % 15% 11%
n%
8% « . ' • 72 69 S3 94 SO 38 102 123 W 134 145 143 127 158 165 175 166 134 235 253 259 249 231 291 271 239 260 300 373 401 0 -4f5 20% 13% •15% 10% 16% 25% -9% 1515 %% ~t%- 1 1 % 24% 411 6 * - 5 % 11% 23% 10% OS -4% 13% 4%
• - T * -12% 9% 15% 24% 8 S
41 ; \yv 7 8 4 . 25 ^l\i^43) IB Jv||||824;
28- ~||^fe
37 gfjj|^?
40 jfj^j^gCfc 45 %&$$!& 50 JSKW^i39 5|pc|p§^
44 ^^^^i 50 ^ ^ ^ p S45 s||p?^
40 ^ s p ^ i ^
43 W H J K M 63 jSpgBS
57 rJ||p£9J?; 71 \j^ZJ$££ 66 J||||p|&»j
96 ^ ^ ^ S2' us -^m^2r p4 WB&3}£
ui HHglS!
no ^ ^ ^ ^ ^
^ ^ ^ ^ ^ 0 j|fg|2g5^ -2% 1% 12% 8%
- 1 %
' 7 % 3% - 5 % 0% -14% 11% 0% 2% - 5 % 12% 15%
-t% - 3 % 3% 4% , 5%
TOTAL SEA PASSENGERS
Table St.
mSLAMD AMD BRjTAtN ORtGTH :
YEAR TOUR % VAR VFRS % VAR BUS % VAR OTHS TOTAL % VAR
I960 1961 1962 1963 1964 1965 1966 1967 1968 1969 1970 1971 1972 1973 1974 1975 1976 1977 1978 1979 1980 1981 1982 19S3 1984 1985 1986 1987 * 1988 1989 1990 234 265 274 291 310 390 365 474 492 412 440 295 415 471 519 411 494 621 594 601 535 537 602 526 541 456 441 573 0 13% 6% 7% 26%
- t 3 S 8% 30% 4% -16% 7% -33% 41%
- 2 1 % 20%
26% -4% !% - U S
OS -US ••;--3* -100% 360 369 329 295 327 305 263 279 317 322 316 274 328
3 IS
275 270 281 352 406 416 457 460 491 535 659 806 763 766 723 682 0 3% -11% -10% 11% -7% - M S 6%
14% 2% -2% • 1 3 * 20% - 3 %
-14% - 2 % 4% 25% 15% 2% 10% 1% 7% 9% 23%
n%
-5% OS - * * -10OS 54 46 43 42 34 31 33 49 39 42 51 44 34 43 50 43 45 60 77 71 73 81 88 80 56 61 74 69 82 78 0 -15% -7% -2% -19% '" 6% 48% -20% 21% -14% -23% 26% 1 6 * -14% 5% 33% 28% 3% 11% 9%- 3 0 S
19% -100S 45 24 26 24 39 36 36 47 28 46 45 46 40 40 47 28 49 65 68 90 108 125 184 151 174 0 0 0 0 0 0 2% -5% -3%
- S *
24% ,2t% 0% 6% •r--,,-:. 6%
Tible 8b,
TOTAL AIR PASSENGERS
1960 1961 1962 1963 1964 1965 1966 1967 1968 1969 1970 1971 1972 1973 1974 1975 1976 1977 1978 1979 1980 1981 1982 1983 1984 1985 •1986 •1987 •1988 •1989 1990 153 185 181 178 260 276 318 299 309 313 294 301 212 213 226 244 202 208 257 242 190 166 143 138 147 203 203 267 334 403 0
2 1 %
- 2 % - 2 % 46% 6% 15% -6% 3% 1% - 6 % 2% - 3 0 % 0%
6%
8%
- 1 7 %
3 %
24%
- 6 %
- 2 1 %
- 1 3 %
- 1 4 %
- 3 %
7%
38% 0% 32%
25%
2 1 % -100% 122 149 146 185 186 206 224 218 221 220 274 323 352 366 290 304 354 307 311 321 323 329 292 270 305 357 463 654 871 1022 0 22% - 2 % 27% 1 % 11% 9% - 3 % 1% 0% 25% 18% 9% 4%
- 2 1 %
5% 16%
- 1 3 %
1%
3 %
1 % 2% - 1 1 % - 8 % 13% 17% 30% 4 1 %
33% 17% -100% 77 82 108 121 119 120 142 153 161 183 210 196 191 226 231 233 236 256 328 361 375 336 354 361 366 355 374 443 554 615 0 6% 32% 12% - 2 % 1% 18% 8% 5% 14% 15%
- 7 %
- 3 %
18% 2% 1 % 1% 8% 28% 10% 4% - 1 0 % 5% 2% 1% - 3 % 5% 18%
25%
1 1 % -100% 18% 5% 11% 16% 7% 15% -2% 4% 4% 9% 4% - 8 % 8% - 4 % 2% 3% 1 % 11% 5% -5% -6% -4% •4% 3% 6% 13% 3 1 % 29% 16% 7%
r
:
2
! i m j to ©
2 3
3
>
2
$
n
8
o
I
(thouscnas
)
Ki
K
J
5? 5
^
5 J •3 j - 1
C
O
5
>
, r>
2
, 2
2
:-- <
8
OROWTr
: FO
R
=ȣ?JO0;*
7
(Thouaonss
)
r s
o c
I8
(Tnousancs
)
•o
\
3
X
*
j
! 3
>
o
3?
Z
us
_
"v
-x
I
3
„
.
tw
i —
8
(Thouaoncs
)
d
to
f >
I
I n
s Z
8
(Thousands
)
se
-
j i !! >
a
8 O
o
0
» o o
0
- >
* i
SO
P
1
-ai
l
8
(Thousands
)
p
p
p
p
o
p
p
—
K
>
U
A
Cl
i *ff
»
>
i
S
I
-i
\
S€
-0 3
\
o o
o
o o
©
"1
i 2
; '
!
c/
)
C
O
>
9