Effects of Selenium Supplement Forms
on the Diet–Cow–Calf Transfer of Selenium
in Simmental Cattle
Barbara Niwińska*, Marcin Andrzejewski
Department of Animal Nutrition and Feed Science, National Research Institute of Animal Production, Balice, Poland
*Corresponding author: [email protected]
ABSTRACT
Niwińska B., Andrzejewski M. (2017): Effects of selenium supplement forms on the diet–cow–calf transfer of selenium in Simmental cattle. Czech J. Anim. Sci., 62, 201–210.
The aim of this study was to determine the efficiency of diet–cow–calf transfer of selenium (Se) depending on the forms of Se-supplement given to cows of Simmental breed during the last trimester of pregnancyand the first week of lactation. On day 195 of pregnancy the cows were randomly assigned to one of four experimental groups (n = 6), and the newborn calves belonged to the same group as their mothers (n = 6). The cows in the control group received diet without Se-supplement, while the supplemented groups received Se in equivalent doses in a powder form (Se-unprotected) or in a protected form (Se-protected) of sodium selenite or in organic compounds (Se-yeast), the calves received colostrum and milk from their mothers. The data about feed and Se intake, colostrum and milkdaily production, Se concentration in colostrum, milk, and cows and calves blood serum were recorded. The diet–cow Se transfer efficiency was estimated as the following ratios: the concentration of Se in cows’ serum after parturition/daily Se intake during prepartum; Se secretion in colostrum/daily Se intake during prepartum; and Se secretion in milk at 7 days of lactation/daily Se intake. The ratios were higher (P ≤ 0.02) in the Se-yeast group than in the other supplemented groups, in the Se-unprotected and Se-protected groups the ratios were similar (P > 0.05). The cow–calf Se transfer efficiency estimated as calves’ serum concentration after birth/cows’ serum concentration after parturition was similar (P > 0.05) in all experimental groups. The results showed that the formof Se supplement modulated the Se transfer from the dietto cows; Se was transferred more efficiently from the Se-yeast than from sodium selenite. The form of Se supplement did not affect the cow–calf Se transfer efficiency.
Keywords:Se-supplement; cows; newborn calves; selenium transfer efficiency
In mammals, selenium (Se) has been recognized as an essential trace element which plays a major role as a component of up to 30 selenoproteins with antioxidant, anti-inflammatory, and chemoprotec-tive properties (reviewed by Reeves and Hoffmann 2009). Plant feeds play a fundamental role in the nutrition of cattle; however, the amount of Se sup-plied in plants cultivated in the area of Central Europe is deficient (Brzoska et al. 2003; Pilarczyk et al. 2005). The deficiency of Se was diagnosed in 23% of dairy cows and in 31% of calves in the Czech
the fetus occurs even when dams are deficient in Se (Enjalbert et al. 1999; Hefnawy et al. 2014). An adequate supply of Se for cows during late pregnancy and in newborn calves can be achieved through diet supplementation (Bayril et al. 2015).
Se supplements for ruminants are classified into inorganic salts (such as sodium selenite and selenate) and organic compounds (such as selenomethionine and selenocysteine), which are found in Se-enriched yeast (Se-yeast). Selenium in rumen is metabolized by microorganisms that can integrate the mineral in their own proteins as seleno amino acids or reduce selenium compounds into non-absorbable elemental Se, which is excreted in the feces (Galbraith et al. 2016). Inorganic selenium has a lower rate of ruminal microbial uptake than the organic selenium sources (Panev et al. 2013). In addition, inorganic salts, com-monly used in a powder form, are highly susceptible to dissolution and to form elemental Se in rumen environment. Se absorption from inorganic salts was improved in cattle that received salt granules covered with protective layers, which are partially stable in rumen and reduce the rate of dissolution of the salt in the rumen but effectively release sodium selenite in the subsequent sections of the gastro-intestinal tract (Wlodarczyk and Birkle 2010). The capabilities of various chemical and physical forms of Se compounds to appropriately meet the mineral requirements of pregnant cows and their offspring are evaluated by using indicators such as diet–cow Se transfer efficiency and Se transfer efficiency across the placenta (Stewart et al. 2012). The results of the studies with sheep and goats showed that the values of these indicators are modulated by the chemical forms of Se compounds (Pechova et al. 2012; Stewart et al. 2012). The quoted results suggest that these indicators should be considered while balancing the feed ratio for cattle. However, these relationships have not been characterized for cattle.
The aim of the present study was to assess the ef-fects of various forms of Se in Se supplement given to cows during the last trimester of pregnancy and the first week of lactation in equivalent Se doses as unprotected or protected sodium selenite or selenized yeast on the efficiency of diet–cow–calf Se transfer.
MATERIAL AND METHODS
The study animals were treated according to the Directive 2010/63/EU for animal studies, and the
procedures used in this experiment were approved by the II Local Ethical Committee on Animal Test-ing in Krakow. The study was conducted at the Odrzechowa LLC Experimental Station of the National Research Institute of Animal Produc-tion in Poland.
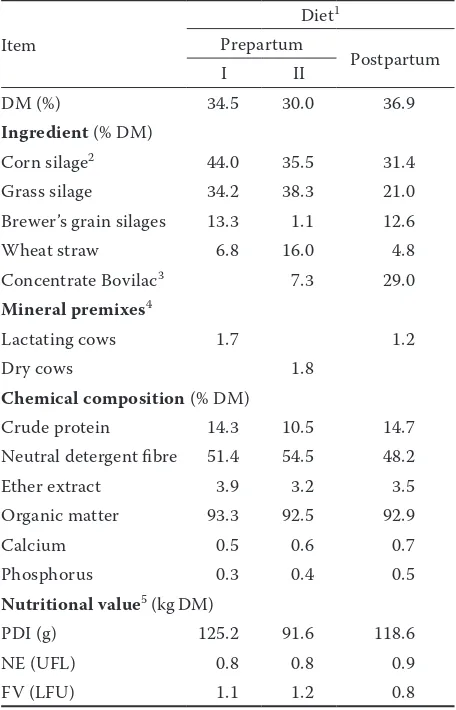
I – days 195–216 of gestation (late lactation, last-ing 21 ± 0.5 days), II – day 217 till parturition (dry and transit phases, lasting 72 ± 0.6 days), and the postpartum period from parturition till day 7 of lactation. The ingredient, chemical composition, and nutritional values of diets given to cows during the prepartum and postpartum periods are pre-sented in Table 1. The roughages and concentrate were offered individually in two meals at 8:00 h and 16:00 h (in equal portions), and the mineral premixes were offered once a day on top of the feeds in addition to the meal. Newborn calves were given 2.0 kg of mother’s first milking colostrum within the first hour of life via a nipple bottle, and colostrum feeding was continued after 6 and 12 hours. After 24 h, mother’s milk was used for calves’ feeding three times a day via teat buckets. Cows were housed in individual tie stalls, had free access to water, and were milked thrice a dayby a single bucket milking machine. Calving took place in individual stalls, and calves were removed from their dams and transported to an individual pen where they remained until the end of study.
Data and sample collection.The data about feed intake and feed refusals of cows were re-corded daily and of calves at each feeding. The colostrum and milk production were monitored at each milking. The samples of cows’ feed were collected every 2 weeks and then combined in a representative sample for study periods (4 samples for each ingredient). The cows’ blood samples were taken on day 195 of pregnancy from randomly chosen 6 study cows and from all cows immediately after parturition. The calves’ blood samples were taken at birth before suckling and on day 8 of age before morning feeding. The blood samples were collected by jugular venipuncture, allowed to clot at room temperature for 1 h before centrifugation at 1500 g for 10 min. The samples of colostrum were taken from cows from the first milking, and a representative sample of AM and PM milk was taken on day 7 of lactation. Feed, serum, colostrum, and milk samples after collection were placed at –20°C until required for the analysis.
[image:3.595.304.532.141.496.2]Chemical analysis. The chemical analyses of feeds were carried out according to the methods of the International Standards Organization for dry matter (Method 6496:1999), crude protein (Method 5983-1:2005), ash (Method 5984:2002), neutral detergent fibre with amylase (Method 16472:2006), and fat (Method 6492:1999). The
Table 1. Ingredients, chemical composition, and nutri-tional values of cows’ diets during the prepartum and postpartum periodsof study
Item
Diet1
Prepartum
Postpartum I II
DM (%) 34.5 30.0 36.9
Ingredient (% DM)
Corn silage2 44.0 35.5 31.4
Grass silage 34.2 38.3 21.0 Brewer’s grain silages 13.3 1.1 12.6 Wheat straw 6.8 16.0 4.8 Concentrate Bovilac3 7.3 29.0
Mineral premixes4
Lactating cows 1.7 1.2
Dry cows 1.8
Chemical composition (% DM)
Crude protein 14.3 10.5 14.7 Neutral detergent fibre 51.4 54.5 48.2 Ether extract 3.9 3.2 3.5 Organic matter 93.3 92.5 92.9
Calcium 0.5 0.6 0.7
Phosphorus 0.3 0.4 0.5
Nutritional value5 (kgDM)
PDI (g) 125.2 91.6 118.6 NE (UFL) 0.8 0.8 0.9 FV (LFU) 1.1 1.2 0.8
DM = dry matter, PDI = protein truly digested in small in-testine, NE = net energy, UFL = NE unit for milk production, FV = fill value, LFU = fill unit
1diets were provided during the periods: prepartum I (days
195–216 of gestation), prepartum II (from day 217 of gesta-tion to parturigesta-tion), and postpartum (from parturigesta-tion to day 7 of lactation)
2average Se concentrations in corn silage, grass silage,
brewer’s grain silages, wheat straw, and concentrate Bovilac were 0.06, 0.1, 0.08, 0.03, and 0.29 mg/kg DM, respectively
3commercial concentrate Bovilac (Dossche Invest. NV-SA,
Belgium) provided per kg of DM: 114 g of protein digested in small intestine, 1.1 NE units for milk production
4premixes provided per kg of DM: Cu 9 mg, Fe 3905 mg,
vitamin A 863 IU, vitamin D 130 IU, vitamin E 5652 mg The Se contents in premixes used in diets for dry cows and lactating cows were (mg/kgDM): 0.0, 0.0 without Se; 14.6, 14.9 with unprotected Na-selenite; 15.9, 15.5 with protected Na-selenite; and 14.8, 14.3 with Se-yeast, respectively
analyzes for Se of feed, blood serum, colostrum, and milk were carried out according to AOAC (1997), Official Method 996.17, using an atomic absorption spectrophotometer (AAS Avanta ∑) with a hydride generator HG3000 (GBC Scien-tific Equipment PTY Ltd., Australia). The basic chemical composition of colostrum and milk was determined using the Fourier Transform Infra-Red spectrophotometer (MilkoScan FT 120 analyzer; Foss Electric A/S, Denmark).
Calculations.The nutritional values of diets such as the protein value (protein digested in the small intestine, PDI), the energy value (energy units for milk production, UFL), and the fill value (fill units for lactating cows, LFU) were calculated according to the recommendations of feeding standards: Ru-minant Nutrition; Recommended Allowances and Feed Tables (Jarrige 1989) by using the computer program INRAtion (Version 4.05, 1988–2004) based on the chemical composition of the feeds. The Se concentration in the daily ration was calculated from the data regarding their content in individual feed plants, considering feed participation in the ration. Se transfer efficiency ratios were calculated by using the methods described by Stewart et al. (2012). The diet–cow Se transfer efficiency was calculated as the ratio of the concentration of Se in cow serum immediately after parturition (μg/ml) to the mean daily Se intake during prepartum (mg), as the ratio of the amount of Se secreted in co-lostrum (mg) to the mean daily Se intake during
prepartum (mg), and as the ratio of the amount of Se secreted in milk on day 7 of lactation (mg) to the mean daily Se intake (mg) during the whole study period. The Se transfer efficiency across the placenta was calculated as the ratio of the concentra-tion of calf serum immediately after birth (μg/ml) to the concentration of cow serum immediately after parturition (μg/ml).
Statistical analysis. Statistical analyses were performed using STATISTICA (StatSoft 2006) software. The results of the study were analyzed as a one-factorial design with the main effect of the Se dietary treatment group using ANOVA and Duncan’s multiple comparison procedure. Data were reported as Least Squares Means ± SEM, and the statistical significance of differences between treatments was declared when P-values were ≤ 0.05.
RESULTS
[image:4.595.68.532.528.701.2]During the prepartum period (92.8 ± 0.5 days) and the postpartum period (7 ± 0 days), the mean daily intakes of dry matter (DM) (10.2 ± 0.05 and 17.6 ± 0.02 kg, respectively), of protein digested in small intestine (1014 ± 4 and 2268 ± 0.8 g, re-spectively), and of energy (14.8 ± 0.03 and 21.0 ± 0.01 units for milk production, respectively) were similar in all study groups of cows (P > 0.05). The Se concentration in daily ration given to cows that reached 0.35 ± 0.03 mg of Se/kg of DM was similar
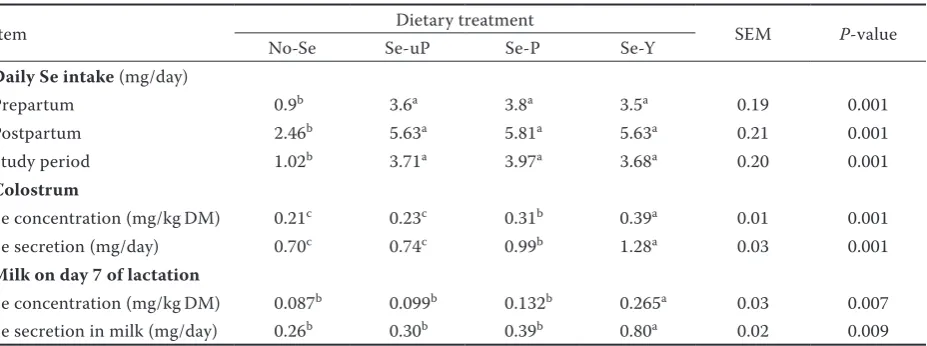
Table 2. Effects of dietary treatment on cows’ daily intake of Se and its secretion in colostrum and milk
Item Dietary treatment SEM P-value
No-Se Se-uP Se-P Se-Y
Daily Se intake (mg/day)
Prepartum 0.9b 3.6a 3.8a 3.5a 0.19 0.001
Postpartum 2.46b 5.63a 5.81a 5.63a 0.21 0.001
Study period 1.02b 3.71a 3.97a 3.68a 0.20 0.001 Colostrum
Se concentration (mg/kgDM) 0.21c 0.23c 0.31b 0.39a 0.01 0.001
Se secretion (mg/day) 0.70c 0.74c 0.99b 1.28a 0.03 0.001 Milk on day 7 of lactation
Se concentration (mg/kgDM) 0.087b 0.099b 0.132b 0.265a 0.03 0.007
Se secretion in milk (mg/day) 0.26b 0.30b 0.39b 0.80a 0.02 0.009
No-Se = group unsupplemented with Se, Se-uP = group supplemented with unprotected sodium-selenite, Se-P = group supplemented with protected sodium selenite, Se-Y = group supplemented with selenized yeast, SEM = standard error of the means, DM = dry matter
(P > 0.05) in all supplemented groups and was higher (P ≤ 0.01) compared with that estimated in daily ration given to cows in No-Se group that was 0.11 ± 0.03 mg of Se/kgof DM. The daily intake of Se in all supplemented groups of cows was similar (P > 0.05) and was higher (P ≤ 0.01) compared with that estimated in No-Se group of cows throughout the prepartum, postpartum, and the whole study period (Table 2). The cows produced similar (P > 0.05) amounts of colostrum (14.2 ± 0.4 kg) not differing in DM content (232 ± 0.5 g/kg DM) and of milk on day 7 of lactation (21.2 ± 0.6 kg; 141 ± 0.3 g/kg DM) in all experi-mental groups.
The mean daily consumption of colostrum (5.81 ± 0.1 kg on the 1st day of life) and of milk (7.1 ±
0.1 kg on the 7th day of life) was similar (P > 0.05)
in calves in all experimental groups.
Selenium diet to cow transfer. Higher (P ≤ 0.01) Se concentrations were observed in colostrum and in milk in Se-Y group of cows compared with those in the other study groups (Table 2). The concen-tration of Se in colostrum produced by cows in
[image:5.595.162.439.98.242.2]Se-P group was higher than the concentration of Se in colostrum produced by cows in Se-uP group (P ≤ 0.01); these groups did not differ in the Se concentration in milk (P > 0.05). The serum Se concentration in cows at the beginning of dietary treatment was found to be 0.047 ± 0.001 µg/ml (Figure 1). The highest (P ≤ 0.03) concentration of Se in blood serum immediately after parturi-tion was found in cows from Y-Se group com-pared with the Se concentration in cows in other supplemented groups, and the Se concentration in cows from Se-uP and Se-P group was similar (P > 0.05). The Se transfer efficiency from diet to cows was found higher (P ≤ 0.02) in Se-Y group of cows in comparison with that found in other supplemented groups (Table 4). The Se transfer efficiency was similar in Se-uP and Se-P groups of cows (P > 0.05).
Selenium cow to calf transfer.The intake of Se in colostrum and in milk was higher (P ≤ 0.01) in calves from Se-Y groups in comparison with that found in calves from the other groups (Table 3). The Se intake in colostrum was higher (P ≤ 0.01)
Table 3. Effects of cows’ dietary treatment on the daily intake of Se in calves
Daily Se intake(mg/day) Dietary treatment SEM P-value No-Se Se-uP Se-P Se-Y
1st Day of life, from colostrum 0.28c 0.30c 0.42b 0.54a 0.04 0.001
7th Day of life, from milk 0.09b 0.10b 0.13b 0.27a 0.02 0.001
No-Se = group unsupplemented with Se, Se-uP = group supplemented with unprotected sodium-selenite, Se-P = group supplemented with protected sodium selenite, Se-Y = group supplemented with selenized yeast, SEM = standard error of the means
[image:5.595.63.533.646.703.2]a–cmeans in the same row with different letters differ significantly at P ≤ 0.001
Figure 1. Effects of the dietary treatment on Se concentrations in the blood serum of cows
No-Se = group unsupplemented with Se, Se-uP = group supplemented with unprotected sodium-selenite, Se-P = group supplemented with protected sodium selenite, Se-Y = group supplemented with selenized yeast
a−cvalues of Least Squares Means (SEM = 0.002) with different letters differ significantly at P ≤ 0.03 0.043c
0.052b
0.060b
0.074a
0.04 0.05 0.06 0.07
Control No-Se Se-uP Se-P Se-Y
Immediately after parturition At the beginning of experiment
Dietary treatment
Bl
oo
d
se
ru
m
c
onc
en
tr
at
io
n
(μ
g/
m
in calves from Se-P group than that found in calves from Se-uP group; the Se intake in calves from Se-uP and No-Se groups did not differ (P > 0.05). Calves from No-Se, Se-uP, and Se-P groups re-ceived similar amounts of Se in milk (P > 0.05). The Se concentrations in blood serum estimated immediately after the birth and on the 8th day of
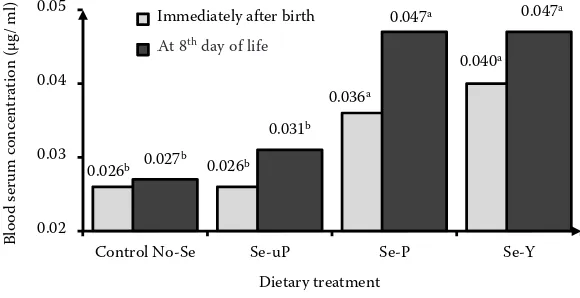
life in calves from No-Se and Se-uP group were similar (P > 0.05) and were lower (P ≤ 0.04) than in calves from Se-P and Se-Y groups (Figure 2). The efficiency of the Se transfer across the placenta was similar (P > 0.05) in all study groups (Table 4).
DISCUSSION
The diet–cow Se transfer efficiency during the last trimester of pregnancy and consequently the amount of Se required for cows and their offspring are affected by the form of the Se supplements. The reference values of Se concentration in blood serum are in the range of 0.07–0.10 µg/ml for adult cattle and in the range of 0.05–0.70 µg/ml for new-born calves (Stowe and Herdt 1992). According to the recommendations for mineral nutrition in moderate-yield cattle of the Simmental breed,
ad-Table 4. Effects of cows’ dietary treatment on Se transfer efficiency from diet to cows and across the placenta
Item Dietary treatment SEM P-value
No-Se Se-uP Se-P Se-Y
Diet–cow Se transfer efficiency
Cows’ serum Se concentration immediately after parturition
(μg/ml)/daily intake of Se during prepartum (mg) 0.05a 0.01c 0.02c 0.03b 0.02 0.011 Se secretion in colostrum (mg)/daily intake of Se during
prepartum (mg) 0.77a 0.21c 0.26c 0.36b 0.04 0.003 Secretion of Se in milk on day 7 of lactation (mg)/daily intake
of Se during study period (mg) 0.26a 0.08b 0.10b 0.22a 0.04 0.015
Transfer of Se across the placenta
Newborn calves’ serum Se concentration (μg/ml)/cows’ serum
Se concentration (μg/ml) 0.59 0.50 0.60 0.56 0.03 0.450 No-Se = group unsupplemented with Se, Se-uP = group supplemented with unprotected sodium-selenite, Se-P = group supplemented with protected sodium selenite, Se-Y = group supplemented with selenized yeast, SEM = standard error of the means
[image:6.595.69.531.111.284.2]a–cmeans in the same row with different letters differ significantly at P ≤ 0.02
Figure 2. Effects of cows’ dietary treatment on Se concentrations in blood serum of calves
No-Se = group unsupplemented with Se, Se-uP = group supplemented with unprotected sodium-selenite, Se-P = group supplemented with protected sodium selenite, Se-Y = group supplemented with selenized yeast
a, bvalues of Least Squares Means (SEM = 0.03) with different letters differ significantly at P ≤ 0.04
0.026b 0.026b
0.036a
0.040a
0.027b
0.031b
0.047a 0.047a
0.02 0.03 0.04 0.05
Control No-Se Se-uP Se-P Se-Y
Immediately after birth At 8th day of life
Bl
oo
d
se
rum
conc
en
tra
tio
n
(μ
g/
m
l)
[image:6.595.153.443.552.701.2]equate concentrations of Se in blood plasma before calving can be achieved if the diet concentration of this mineral is at the level of 0.34–0.35 mg/kg ofdietary DM (Suttle 2010). In the present study, despite the administration of diet with the recom-mended amount of Se (0.32–0.35 mg/kgDM), only the administration of Se supplement in the form of Se-enriched yeast met the requirement in pregnant cows. The concentration of Se in the blood serum of all the study calves immediately after birth was found to be below the reference value, but the concentration of Se attained the reference values on the 8th day of age in calves born from cows fed
organic Se and protected inorganic supplement salts and in those receiving colostrum and milk from their mothers. The results indicate that the selenium requirement being met in pregnant cows and their offspring calf is not only dependent on the concentration of the element in the diet, but also highly dependent on the efficiency of the diet–cow and cow–calf Se transfer.
Selenium transfer from the Se-supplemented diet to cow.In this study, the efficiency of the Se transfer from dietto cows was characterized by the ratios defined as the Se concentration in cow serum immediately after parturition, the amount of Se secreted in colostrum, or the amount of Se secreted in milk on day 7 of lactation, all of them in relation to the mean daily intake during the pe-riod before measurement. All the specified ratios reached a higher value in the supplemented group of cows fed Se in the form of organic compounds in comparison with those estimated in groups that received Se additives in the form of inorganic salts. The results showed that Se is transferred more efficiently from Se yeast than from sodium selenite, and the Se transfer from a protected or unprotected inorganic salts is similar. The cows which received Se-enriched yeast had greater Se concentrations in blood serum (32%), in colostrum DM (44%), and in milk DM (128%) than the cows fed equivalent doses of inorganic Se salts (100% established in the cows that received inorganic salts). The obtained results are consistent with those found in most studies in dairy cattle, showing that the cows receiving organic form of Se were characterized by higher concentrations of the mineral in blood serum (within the limits from 36 to 140%), in colostrum (up to 200%), and in milk (from 90 to 190%) compared with those receiving inorganic salts (Rowntree et al. 2004; Weiss and
Hogan 2005; Salman et al. 2013; Hall et al. 2014). The differences between the chemical forms of Se compounds in the diet–cow Se transmission may be due to the reactions that occur in the rumen environment. The transformation pathways that take place in the rumen are highly dependent on the type of Se chemical compounds, even though the fermentation parameters such as pH, total acidity, as well as the concentrations of lactic acid, ammonia, and volatile fatty acids are inde-pendent of the type of Se supplements (Panev et al. 2013). Under the in vitro condition of ruminal incubation, it was recognized that the integration of Se into the microbial protein was greater and the formulation of non-absorbable elemental Se was lower from Se-methionine compared with Se generated from inorganic salts (Galbraith et al. 2016). The increase of Se incorporation into the microbial protein improves the bioavailability of Se in the small intestine of ruminants, and, on the contrary, elemental Se is poorly absorbed and is mostly retrieved in feces (Hall et al. 2012). Results of the studies cited earlier suggest that the differences in the diet–cow Se transfer ef-ficiency could be explained by the differences in the metabolism of Se compounds in the rumen environment. Results of the present study showed that the Se transfer from Se-supplemented diet to cows is most effective in organic compounds.
blood (r = 0.63; Patterson et al. 2013). It may be assumed that the main reason for the higher value of this relationship presented in the cited studies was the comparison of Se concentration in the liver and in the whole blood. In reference to the correlation between Se concentrations in liver, the liver is considered as a storage organ that can accumulate Se even in deficit (Herdt et al. 2000). The maternal supplementation of Se increased Se reserves in the liver of the newborn to meet the Se needs for the normal growth and health (Abdel-rahman and Kincaid 1995). The whole blood Se concentrations did not significantly decline even when mineral intake began to decline, and this indicator reflects more chronic or “historical” Se status, whereas serum Se concentration reflects more recent changes in Se nutrition (Stowe and Herdt 1992; Patterson et al. 2013). According to the indicators presented in the work cited earlier, the Se concentration in blood serum is more reflective than the concentration in liver or whole blood and may be a more adequate indicator of the nutritional status of Se. The efficiency of Se transfer across the placenta estimated in this research is close to that in sheep which was estimated to be 0.50–0.84 (serum concentration of the mineral) (Stewart et al. 2012). The obtained results indicate that the relationship between the Se concentration in the blood serum of cows and that of calves born to these cows is a constant, irrespective of the form of Se additives used.
Effects of reduction of Se inorganic salts ru-men dissolution.The results of the present study partly confirm the hypothesis that the use of Se from inorganic salts in cattle could be improved by reducing the rate of dissolution in the rumen. In this study, cows in the group that received pro-tected salts produced Se-rich colostrum, and the calves born to those cows were characterized by higher concentration of serum immediately after the birth and on the 8th day of life compared with
those in the group fed unprotected sodium sel-enite. The results indicate that more Se from the protected form has been used for the synthesis of colostrum and also for attaining the mineral needs of the fetus. The greater use of Se from protected forms of inorganic salts compared with the use of Se from unprotected forms may be the result of the higher efficiency of incorporation of the ele-ment into the microbial protein in rumen and also because of the improved delivery of nutrients for
the synthesis of colostrum and to the fetus during pregnancy. The highest intensity of incorporation of Se in the bacterial and the protozoa mass was observed 3 h after a meal in the rumen of a wether (Serra et al. 1994). After this period, the authors noted a rapid decline both in the Se concentra-tion in rumen liquid and in the incorporaconcentra-tion of Se in microbial mass. The concentration of Se seemed to be the basic factor of the uptake of Se by Selemmonas ruminantium, a ruminal bacterium with high affinity to the incorporation of Se into seleno amino acids (Hudman and Glenn 1984). These results suggest that slower dissolution from the protected form of Se supplement prolonged the baseline concentration level in the rumen and consequently resulted in a more efficient incor-poration of Se into the microbial mass; however, there is no analysis in this area. The processes of delivery of nutrients to the fetus and to the co-lostrum were under the control of the endocrine system. The results of the current study showed that Se is essential for optimal endocrine function and that dietary Se nutritional plane influenced the seleno-dependent hormone homeostasis in both pregnant ewes and their offspring (Hefnawy et al. 2014; Lemley et al. 2014). In addition, relatively high concentrations of Se were found in the endocrine tissues as thyroid even when there was a severe dietary deficiency (Bates et al. 2000). By modifying the expression of selenoproteins, Se is responsible for exerting multiple actions of the endocrine systems (Beckett and Arthur 2005). The results of the present study showed that cows receiving pro-tected salts produced Se-rich colostrum and that the serum of calves born to these cows contained more Se. Higher absorption from the protected forms affects the activities of endocrine pathways responsible for incorporating the mineral in the colostrum during the synthesis and in the fetus during pregnancy. Despite the presented positive changes in the concentration of Se in colostrum and in serum of calves, the estimated diet–cow Se transfer efficiency ratios remained unchanged. The insufficient improvement of Se transfer from dietto cows by the protection of inorganic salts is difficult to explain. It seems that the difference in the Se concentration in colostrum and in serum of calves was too small to be reflected in the es-timated transfer efficiency ratios.
trans-fer efficiency of Se from Se-unsupplemented diet into the colostrum and into the milk was found two times more efficient compared with that esti-mated in other study groups, whereas the transfer efficiency of Se across the placenta has been found to be similar in all study groups. The 9% decrease of concentration of Se in blood serum of cows (the concentration of Se on day 195 of pregnancy established as 100%) during the last trimester of pregnancy stated in this experiment indicated that Se-deficient cows provide Se to the detriment of their health to ensure adequate intake of the fetus and the newborns, while at the same time their own Se status has been reduced. These data confirm the results that an efficient Se transfer occurs from the pregnant animal to newborns, even in situations of low concentration of the element in the parent (Hefnawy et al. 2014; Mehdi and Dufrasne 2016). The results of the present study also showed that under the conditions of selenium deficiency in the diet, despite cow–mother effort, the concentration of Se in blood serum of the calf was found to be by 48% lower than the approved reference values for the newborn calf (estimated as 100%).
CONCLUSION
The form of Se supplement modulates the Se saturation of the maternal and their offspring by the efficiency of the element transfer from the diet to cows. The Se transfer from the diet to cows is most effective from Se-enriched yeast compared with the transfer from sodium selenite. The feed-ing Simmental cows durfeed-ing the last trimester of pregnancy with ration supplemented with Se in the form of Se-enriched yeast to the level of 0.03 mg/ kg DM of diet meets the requirement of pregnant cows and on the 8th day of life of their calves fed
with colostrum and milk from the mother. The ra-tion containing an equivalent of Se in supplement in the form of sodium selenite does not prevent Se deficiency in cows and their calves. The efficiency of Se transfer across the placenta (0.56 ± 0.03) is not affected by the supplementation and by the form of Se supplement. In cows that received diet without Se supplementation, the efficiency of Se transfer across the placenta is the same, resulting in deepening of Se deficit in cows at parturition. Presented indicators should be considered while balancing feed rations for cows during pregnancy.
REFERENCES
AOAC (1997): Official Method 996.17. Selenium in feeds and premixes. Continuous hydride generation atomic absorption (HGAA) method. Association of Official Analytical Chemists International, Gaithersburg, USA. Abdelrahman M.M., Kincaid L.R. (1995): Effect of
sele-nium supplementation of cows on maternal transfer of selenium to fetal and newborn calves. Journal of Dairy Science, 78, 625–630.
Bates J.M., Spate V.L., Morris J.S., St. Germain D.L., Galton V.A. (2000): Effects of selenium deficiency on tissue sele-nium content, deiodinase activity, and thyroid hormone economy in the rat during development. Endocrinology, 141, 2490–2500.
Bayril T., Yildiz A.S., Akdemir F., Yalcin C., Kose M., Yilmaz O. (2015): The technical and financial effects of parenteral supplementation with selenium and vitamin E during late pregnancy and the early lactation period on the productivity of dairy cattle. Asian-Australasian Jour-nal of Animal Sciences, 28, 1133–1139.
Beckett G.J., Arthur J.R. (2005): Selenium and endocrine systems. Journal of Endocrinology, 184, 455–465. Brzoska F., Brzezinski W., Brzoska B. (2003): Mineral
nu-trients in Polish feedstuffs. Part 1: Fodder plants. Annals of Animal Science, 3, 115–126.
Enjalbert F., Lebreton P., Salat O., Schelcher F. (1999): Ef-fects of pre- or postpartum selenium supplementation on selenium status in beef cows and their calves. Journal of Animal Science, 77, 223–229.
Galbraith M.L., Vorachek W.R., Estill C.T., Whanger P.D., Bobe G., Davis T.Z., Hall J.A. (2016): Rumen microorgan-isms decrease bioavailability of inorganic selenium supple-ments. Biological Trace Element Research, 171, 338–343. Gooneratne S.R., Christensen D.A. (1989): A survey of
ma-ternal and fetal tissue zinc, iron, manganese and selenium concentrations in bovine. Canadian Journal of Animal Science,69, 151–159.
Hall J.A., Van Saun R.J., Bobe G., Stewart W.C., Vorachek W.R., Mosher W.D., Nichols T., Forsberg N.E., Pirelli G.J. (2012): Organic and inorganic selenium: I. Oral bioavail-ability in ewes. Journal of Animal Science, 90, 568–576. Hall J.A., Bobe G., Vorachek W.R., Kasper K., Traber M.G., Mosher W.D., Pirelli G.J., Gamroth M. (2014): Effect of supranutritional organic selenium supplementation on postpartum blood micronutrients, antioxidants, me-tabolites, and inflammation biomarkers in selenium-replete dairy cows. Biological Trace Element Research, 161, 272–287.
and T3 in selenium supplemented and nonsupplemented ewes and their lambs. Veterinary Medicine International, 2014, Article ID 105236.
Herdt T.H., Rumbeiha W., Braselton W.E. (2000): The use of blood analyses to evaluate mineral status in livestock. Toxicology, 16, 423–444.
Hudman J.F., Glenn A.R. (1984): Selenite uptake and in-corporation by Selenomonas ruminantium. Archives of Microbiology, 140, 252–256.
Jarrige R. (ed.) (1989): Ruminant Nutrition: Recommended Allowances and Feed Tables. INRA, Paris, France/John Libbey, London, UK.
Lemley C.O., Meyer A.M., Neville T.L., Hallford D.M., Ca-macho L.E., Maddock-Carlin K.R., Wilmoth T.A., Wilson M.E., Reynolds L.P., Caton J.S., Vonnahme K.A. (2014): Dietary selenium and nutritional plane alters maternal endocrine profiles during pregnancy and lactation. Do-mestic Animal Endocrinology, 46, 1–11.
Mehdi Y., Dufrasne I. (2016): Selenium in cattle: a review. Molecules, 21, 545.
Muth O.H., Oldfield J.E., Remmert L.F., Schubert J.R. (1958): Effects of selenium and vitamin E on white muscle dis-ease. Science, 128, 1090–1091.
NRC (2001): Nutrient Requirement of Dairy Cattle. 7th Ed.
The National Academies Press, Washington, USA. Panev A., Hauptmanova K., Pavlata L., Pechova A.,
Fili-pek J., Dvorak R. (2013): Effect of supplementation of various selenium forms and doses on selected parameters of ruminal fluid and blood in sheep. Czech Journal of Animal Science, 58, 37–46.
Patterson J.D., Burris W.R., Boling J.A., Matthews J.C. (2013): Individual intake of free-choice mineral mix by grazing beef cows may be less than typical formulation assumptions and form of selenium in mineral mix affects blood Se concentrations of cows and their suckling calves. Biological Trace Element Research, 155, 38–48. Pavlata L., Slosarkova S., Fleischer P., Pechova A. (2005):
Effects of increased diodine supply on the selenium status of kids. Veterinary Medicine–Czech, 50, 186–194. Pechova A., Sevcikova L., Pavlata L., Dvorak R. (2012): The
effect of various forms of selenium supplied to pregnant goats on selected blood parameters and on the concen-tration of Se in urine and blood of kids at the time of weaning. Veterinarni Medicina, 57, 394–403.
Pilarczyk B., Balicka-Ramisz A., Ramisz A., Osipocic S.V., Tomza A., Wieczorek M. (2005): The investigation of serum selenium levels in farm animals from Western Pomerania and Western Ukraine. Folia Universitatis Agriculturae Stetinensis Zootechnica, 243, 137–142. Reeves M.A., Hoffmann P.R. (2009): The human
seleno-proteome: recent insights into functions and regulation. Cellular and Molecular Life Sciences, 66, 2457–2478. Rowntree J.E., Hill G.M., Hawkins D.R., Link J.E., Rincker
M.J., Bednar G.W., Kreft Jr. R.A. (2004): Effect of Se on selenoprotein activity and thyroid hormone metabolism in beef and dairy cows and calves. Journal of Animal Sci-ence, 82, 2995–3005.
Salman S., Dinse D., Khol-Parisini A., Schafft H., Lahrssen-Wiederholt M., Schreiner M., Scharek-Tedin L., Zentek J. (2013): Colostrum and milk selenium, antioxidative ca-pacity and immune status of dairy cows fed sodium sel-enite or selenium yeast. Archives of Animal Nutrition, 67, 48–61.
Serra A.B., Nakamura K., Matsui T., Harumoto H., Fuji-hara T. (1994): Inorganic selenium for sheep I. Selenium balance and selenium levels in the different ruminal fluid fractions. Asian Journal of Animal Science, 7, 83–89. Stewart W.C., Bobe G., Vorachek W.R., Pirelli G.J., Mosher
W.D., Nichols T., Van Saun R.J., Forsberg N.E., Hall J.A. (2012): Organic and inorganic selenium: II. Transfer ef-ficiency from ewes to lambs. Journal of Animal Science, 90, 577–584.
Stowe H.D., Herdt T.H. (1992): Clinical assessment of se-lenium status of livestock. Journal of Animal Science, 70, 3928–3933.
Suttle N.F. (2010): Mineral Nutrition of Livestock. CABI, Wallingford, UK.
Weiss W.P., Hogan J.S. (2005): Effect of selenium source on selenium status, neutrophil function, and response to intramammary endotoxin challenge of dairy cows. Journal of Dairy Science, 88, 4366–4374.
Wlodarczyk R., Birkle B. (2010): Rumen protected selenium – the most effective form of selenium supply in ruminants nutrition. Zycie Weterynaryjne, 85, 238–242. (in Polish)