Partially supported by the Swiss National Science Foundation (Grant 320030_149976). The authors declare no conflicts of interest.
†Carla R. Soliva has passed away.
In Vitro
Bioactivity of Various Pure Flavonoids
in Ruminal Fermentation, with Special Reference
to Methane Formation
Susanne Sinz
1, Carmen Kunz
1, Annette Liesegang
2, Ueli Braun
3,
Svenja Marquardt
1, Carla R. Soliva
1†, Michael Kreuzer
1*
1ETH Zürich, Institute of Agricultural Sciences, Zürich, Switzerland
2Institute of Animal Nutrition, Vetsuisse Faculty, University of Zürich, Zürich, Switzerland
3Department of Farm Animals, Vetsuisse Faculty, University of Zürich, Zürich, Switzerland
*Corresponding author: [email protected]
ABSTRACT
Sinz S., Kunz C., Liesegang A., Braun U., Marquardt S., Soliva C.R., Kreuzer M. (2018): In vitro bioactivity of
various pure flavonoids in ruminal fermentation, with special reference to methane formation. Czech J.
Anim. Sci., 63, 293–304.
Polyphenols, like flavonoids, have been investigated when present in intact plants or in extracts as methane mitigating dietary supplements in ruminants. The aim of the present study was to examine pure compounds in a short-term in vitro experiment using the Hohenheim Gas Test method. We focused on the group of the flavonoids and tested which of them had the potential to mitigate methane without negatively affecting rumi-nal fermentation. Eight flavonoids were tested: epicatechin, luteolin-7-glucoside, quercetin, and isoquercetin in Experiment 1; catechin, gallocatechin, epigallocatechin, and epigallocatechin gallate in Experiment 2. Tannic acid, no flavonoid but a phenolic acid with known methane mitigating properties, served as positive control, and the unsupplemented basal diet as negative control. In both experiments, each of these compounds (including tannic acid) was tested at dosages of 0.5, 5.0, and 50.0 mg/g basal diet dry matter (DM) in four runs each. Gallocatechin, tannic acid, and epigallocatechin gallate (50 mg/g DM) lowered fermentation gas formation and in vitro organic matter digestibility relative to the negative control (Experiment 2). Apart from tannic acid, epicatechin, quercetin, isoquercetin, and luteolin-7-glucoside (5 and 50 mg/g DM) reduced the amount of CH4 produced in relation to total gas produced (Experiment 1). The incubation fluid ammonia concentration was decreased with luteolin-7-glucoside and tannic acid (50 mg/g DM). From the flavonoids tested especially luteolin-7-glucoside seems to have a similar potential as tannic acid to mitigate methane and ammonia formation during ruminal fermentation
in vitro, both favourable in environmental respect. These results need to be confirmed in live animals.
Keywords: rumen; ammonia; Hohenheim Gas Test; epicatechin; isoquercetin; luteolin-7-glucoside; quercetin;
catechin; tannic acid
The interest in mitigating greenhouse gases pro-duced in agriculture strongly increased over the last few years. The focus of research has turned
effects in ruminant nutrition are the representa-tives of the extensive class of the polyphenols. Such possible effects include methane (CH4) suppres-sion (Beauchemin et al. 2008; Cieslak et al. 2013), ruminal by-pass of valuable dietary protein (Cortes et al. 2009) and positive effects on animal health, for instance via antioxidant properties (Bjorklund and Chirumbolo 2017). However, polyphenols may also act in an anti-nutritive manner in ruminants, which can be associated with a reduced ruminal organic matter degradation and, thus, energy sup-ply of the animal (McSweeney et al. 2001).
Polyphenols are plant secondary compounds and can be divided in two large groups: the phenolic acids and the flavonoids. Flavonoids are subdi-vided into six sub-groups: flavanonols, flavonols, flavanons, flavons, anthocyanidins, and isoflavones (Crozier et al. 2006). Oligomeric and polymeric fla-vanols are called proanthocyanidins or condensed tannins (CT), whereas hydrolysable tannins (HT) are built from the phenolic acids gallotannins and ellagitannins (Crozier et al. 2006). Some, but not all extracts containing tannins (CT or HT or both) were shown to exhibit effects on ruminal fermentation and methanogenesis (Jayanegara et al. 2012). Since CT and HT consist of a number of sub-units, these effects cannot be allocated to the respective compounds like for instance sin-gle flavonoids. Therefore, the aim of the present study was to elucidate with pure substances which flavonoid sub-units, some of them being part of polyphenols like CT, are responsible for effects on ruminal fermentation and methane emission.
In the present study, the following hypotheses were tested: (1) There is a number of distinct flavonoids originating from different chemical groups, which are bioactive in rumen fermentation similarly to tannic acid (a phenolic acid with known bioactive properties). (2) At least some of the fla-vonoids significantly reduce either CH4 emission or NH3 formation or both without compromising the general ruminal nutrient fermentation. (3) The effects of the flavonoids are dose dependent. This was tested in two experiments using a common short-term in vitro system.
MATERIAL AND METHODS
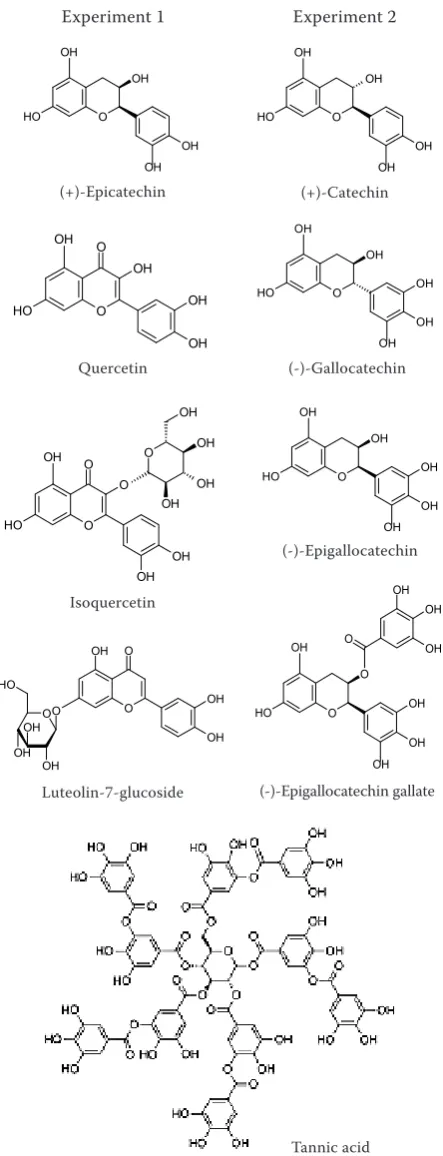
Test compounds.A total of eight pure flavonoids (five flavanols, two flavonols, and one flavon) were
tested, four flavonoids in each of two experiments, in addition to tannic acid (positive control; Fig-ure 1). All compounds were available in pulver-ized form from Sigma-Aldrich Chemie GmbH, Buchs, Switzerland. In Experiment 1, epicatechin (purity ≥ 90%), a flavanol representative of the sub-units of CT, was included. Additionally, two flavonols, quercetin (purity ≥ 98%) and isoquerce-tin (querceisoquerce-tin-3-β-glucopyranoside; purity ≥ 90%) (all Sigma-Aldrich) were tested. Isoquercetin is a naturally occurring glucoside of quercetin. Finally, luteolin-7-glucoside (purity ≥ 98%; Sigma-Aldrich), a flavone being a glucosidic form of luteolin, was included. Apart from epicatechin used only in Ex-periment 1, the four following flavanols (all Sigma-Aldrich) were tested in Experiment 2. Catechin (purity ≥ 96%) is composed of two benzene rings and a dihydropyran heterocycle. Gallocatechin (purity ≥ 97%) and epigallocatechin (purity ≥ 95%) differ only in their configuration. Both have the same chemical structure as catechin except of an additional OH-group on the dihydropyran hetero-cycle. Epigallocatechin gallate (purity ≥ 92%), an ester of epigallocatechin and gallic acid, comprised the last test substance (Crozier et al. 2006).
For both experiments, tannic acid (Sigma-Al-drich) served as positive control. It belongs to the group of phenolic acids, one of the sub-groups of phenolic compounds and is a subunit present in HT (Crozier et al. 2006). There is ample evidence that HT may mitigate methane in ruminants (Jayanegara et al. 2012), and tannic acid has been demonstrated to possess methane mitigations effects in other in vitro studies (Field and Lettinga 1987; Yang et al. 2017). In both experiments, a non-supplemented treatment served as negative control.
et al. 2012). Phenol contents of up to 50 mg/g DM may have positive effects on fertility, absorp-tion of essential amino acids and performance in
sheep, while dosages > 50 mg/g dietary DM may decrease DM intake and performance (e.g. Aerts et al. 1999). Wischer et al. (2013) found a CH4 mitigating effect when testing pure catechin at a dosage of 0.7 mg/g basal diet DM but could not confirm this result in a second study. In the present study, dosages of 0.5, 5.0, and 50 mg/g basal diet DM were chosen in order to determine the range of the lowest concentration that is still effective in CH4 reduction.
The basal diet consisted of ryegrass (Lolium mul-tiflorum) hay prepared from the first cut obtained from a Swiss plant breeder. Within each experi-ment the same batch of ryegrass hay was used, both in the diet of the donor cow and as basal diet for all in vitro incubations. With this procedure, always the hay the microbes were already adapted to was used for the in vitro approach. According to proximate and total phenol analysis made in triplicate (AOAC 1997; Jayanegara et al. 2011), the batch of hay used in Experiment 1 contained (per g DM): organic matter 910 mg, crude protein 166 mg, ether extract 38 mg, neutral detergent fibre 526 mg, total extractable phenols 8.2 mg. In the batch of hay used in Experiment 2, the corre-sponding values were 939, 51, 15, 618, and 1.5 mg. In both experiments, in each of four different runs the negative control (basal diet alone) was in-cluded in two syringes (replicates), while the syringes containing the three levels of each of the four test compounds and the positive control (tannic acid) were included once per each run. This resulted in a total of 68 (4 × 17) incubations per experiment.
In vitro incubations. The Hohenheim Gas Test
method was used for the in vitro incubations. The system is operated with rumen fluid and buffer as described by Menke and Steingass (1988). Differ-ent from that, modified syringes with two outlets were employed (Soliva and Hess 2007) which al-lowed the direct collection of fermentation gas samples. The rumen fluid used for the individual runs of the two experiments was collected before the morning feeding on eight different days from a rumen-cannulated lactating Brown Swiss cow (ap-proval number ZH 38/14 of the Zürich Cantonal Veterinary Office). The cow was multiparous, had an average live weight of 625 kg, an average milk yield of 7000 kg/year and was in the last and first third of its lactation when rumen fluid was collected for Experiments 1 and 2, respectively. On average across all collections, the rumen fluid had a pH of 6.9 ± 0.1 and it contained per ml 12.9 ± 6.9 × 10⁹
[image:3.595.67.289.143.722.2]bacteria and 113 ± 58 × 103 protozoa whereof 98.4%
Figure 1. Chemical structure of the compounds investi-gated in the two experiments
Tannic acid O OH OH O O H OH OH O OH OH O Luteolin-7-glucoside
O H O O OH O OH OH O OH OH OH OH Isoquercetin O H O OH OH O OH OH Quercetin O H O OH OH OH OH (+)-Epicatechin
Experiment 1 Experiment 2
were Entodiniomorphs. Accordingly, the rumen fluid used in the incubations was in a range typical for a normal rumen function.
During the time of Experiment 1, the cow received ryegrass hay at ad libitum access and daily 0.5 kg of dairy concentrate (UFA 149; UFA AG, Switzerland). During Experiment 2, the diet consisted of ryegrass hay and silage (1 : 1) provided at ad libitum access and daily 4 kg of dairy concentrate (UFA Prima F 142; UFA AG). The proximate composition per kg of diet was: organic matter 904 and 879 g, crude protein 188 and 103 g, ether extract 39 and 30 g, neutral detergent fibre 476 and 694 g for Experi-ments 1 and 2, respectively. The differences found between experiments in the negative control data are likely due the different batches of hay used as basal diet. Additionally, variation in the diet of the donor cow might have changed the properties of the rumen fluid. The cow had free access to water.
The syringes were prepared by filling them with 200 mg DM of the basal diet and the respective amount of the pulverised test compounds. The rumen fluid was strained through four layers of gauze. Afterwards, one part of rumen fluid was combined with two parts of preheated Menke buffer (Menke and Steingass 1988). This formed the incubation fluid, whereof 30 ml each were put into the syringes. The syringes were put in a rotor and incubated for 24 h in a drying cabinet at 39°C. Directly afterwards, the gas volume was determined by readings made on the calibrated scale printed onto the syringes. Then the incuba-tion fluid was removed through one outlet. In these samples, pH (to check sufficient buffering) and NH3 concentrations were determined with a potentiometer (Model 632 and Model 713; Metrohm, Switzerland) equipped with different electrodes. Due to a failure of the device, it was not possible to measure NH3 concentrations in Experiment 2. Short-chain fatty acids (SCFA) were analysed in the incubation fluid by high-performance liquid chromatography (HPLC) (LaChrom, L-7000 series, Hitachi Ltd., Japan (Experi-ment 1) and Agilent 6890N, Agilent Technologies, USA (Experiment 2)) following Ehrlich et al. 1981. Bürker counting chambers (Blau Brand, Germany) were used for microbe counting. These had a depth of 0.02 mm for bacteria and 0.1 mm for protozoa. Hayem solution (HgCl2 9 mmol/l, Na2SO4 176 mmol/l, NaCl 86 mmol/l) and diluted formaldehyde (0.04 mmol/1 w/v in water) were used for fixing bacteria and pro-tozoa, respectively, to facilitate counting. Holotrich and entodiniomorphic protozoa were distinguished. From the remaining fermentation gas, samples were obtained using a sampling injector syringe through
an airtight septum covering the second outlet of the pistons (Soliva and Hess 2007). The concentration of CH4 was analysed by a gas chromatograph (model 5890, series II, Hawlett Packard, USA) equipped with a flame ionisation detector (used for CH4) and a thermal conductivity detector (used for H2, CO2). The column used was a Carboxen-1000, 4.5 m × 3.2 mm (2.1 mm inner diameter), and the carrier gas was argon. In vitro organic matter digestibility (IVOMD, %) was calculated according to Menke and Steingass (1988) as 148.8 + 8.893 × gas produc-tion (ml) + 0.448 × crude protein (g/kg DM) + 0.651 × total ash (g/kg DM).
Statistical analysis.Data from both experi-ments (n = 4 per treatment; n = 3 for catechin in Experiment 2) were analysed separately with the Mixed procedure of the SAS software (Statistical Analysis System, Version 9.4). Model 1 considered test compound as fixed effect and incubation run as random effect. For that, the non-supplemented negative control was compared with the respective four different test compounds and tannic acid. This was done separately per dosage of supplementation (either 0.5, 5 or 50 mg/g). For Model 2, dosage was considered as fixed effect and incubation run as random effect. In Model 2, the non-supplemented negative control was considered also as a dosage thus yielding four levels (0, 0.5, 5, and 50 mg/g). Analyses with Model 2 were done separately for each test compound. Multiple comparisons among means were carried out with the Tukey-Kramer method. Normal distribution was examined graphi-cally by plotting the distribution of residuals. Tables display Least Squares Means, standard errors of the mean (SEM) for each level of supplementa-tion, and P-values for the effects of either phe-nolic compound within dosage or dosage within phenolic compound. Chemical structures were drawn with MDL ISISTM/Draw (Version 2.5 SP4).
Values deviating from the average by more than 2 standard deviations were excluded.
RESULTS
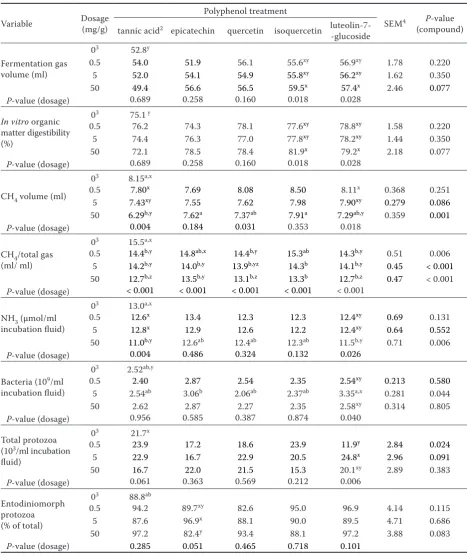
Table 1. Effect of phenolic compounds and their dosage on the production of fermentation gases and on microbial counts during 24 h of fermentation in vitro1 (Experiment 1)
Variable Dosage (mg/g)
Polyphenol treatment
SEM4 P-value
(compound) tannic acid2 epicatechin quercetin isoquercetin luteolin-7-
-glucoside
Fermentation gas volume (ml)
03 52.8y
0.5 54.0 51.9 56.1 55.6xy 56.9xy 1.78 0.220
5 52.0 54.1 54.9 55.8xy 56.2xy 1.62 0.350
50 49.4 56.6 56.5 59.5x 57.4x 2.46 0.077
P-value (dosage) 0.689 0.258 0.160 0.018 0.028
In vitro organic matter digestibility (%)
03 75.1 y
0.5 76.2 74.3 78.1 77.6xy 78.8xy 1.58 0.220
5 74.4 76.3 77.0 77.8xy 78.2xy 1.44 0.350
50 72.1 78.5 78.4 81.9x 79.2x 2.18 0.077 P-value (dosage) 0.689 0.258 0.160 0.018 0.028
CH4 volume (ml)
03 8.15a,x
0.5 7.80x 7.69 8.08 8.50 8.11x 0.368 0.251
5 7.43xy 7.55 7.62 7.98 7.90xy 0.279 0.086
50 6.29b,y 7.62a 7.37ab 7.91a 7.29ab,y 0.359 0.001 P-value (dosage) 0.004 0.184 0.031 0.353 0.018
CH4/total gas
(ml/ ml)
03 15.5a,x
0.5 14.4b,y 14.8ab,x 14.4b,y 15.3ab 14.3b,y 0.51 0.006
5 14.2b,y 14.0b,y 13.9b,yz 14.3b 14.1b,y 0.45 < 0.001
50 12.7b,z 13.5b,y 13.1b,z 13.3b 12.7b,z 0.47 < 0.001 P-value (dosage) < 0.001 < 0.001 < 0.001 < 0.001 < 0.001
NH3 (μmol/ml incubation fluid)
03 13.0a,x
0.5 12.6x 13.4 12.3 12.3 12.4xy 0.69 0.131
5 12.8x 12.9 12.6 12.2 12.4xy 0.64 0.552
50 11.0b,y 12.6ab 12.4ab 12.3ab 11.5b,y 0.71 0.006 P-value (dosage) 0.004 0.486 0.324 0.132 0.026
Bacteria (109/ml
incubation fluid)
03 2.52ab,y
0.5 2.40 2.87 2.54 2.35 2.54xy 0.213 0.580
5 2.54ab 3.06b 2.06ab 2.37ab 3.35a,x 0.281 0.044
50 2.62 2.87 2.27 2.35 2.58xy 0.314 0.805 P-value (dosage) 0.956 0.585 0.387 0.874 0.040
Total protozoa (103/ml incubation
fluid)
03 21.7x
0.5 23.9 17.2 18.6 23.9 11.9y 2.84 0.024
5 22.9 16.7 22.9 20.5 24.8x 2.96 0.091
50 16.7 22.0 21.5 15.3 20.1xy 2.89 0.383 P-value (dosage) 0.061 0.363 0.569 0.212 0.006
Entodiniomorph protozoa (% of total)
03 88.8ab
0.5 94.2 89.7xy 82.6 95.0 96.9 4.14 0.115
5 87.6 96.9x 88.1 90.0 89.5 4.71 0.686
50 97.2 82.4y 93.4 88.1 97.2 3.88 0.083 P-value (dosage) 0.285 0.051 0.465 0.718 0.101
1values are averages of four replicates obtained from independent incubations except of negative control (n = 8) 2tannic acid acted as positive control
30-dosage (negative control without supplementation) that was always included when comparing different means 4standard error of the mean
of isoquercetin and luteolin-7-glucoside when compared to the zero dosage (non-supplemented negative control). The absolute amount of CH4 (ml) was reduced (P < 0.05) by the highest dosage of tannic acid. Additionally to tannic acid, there
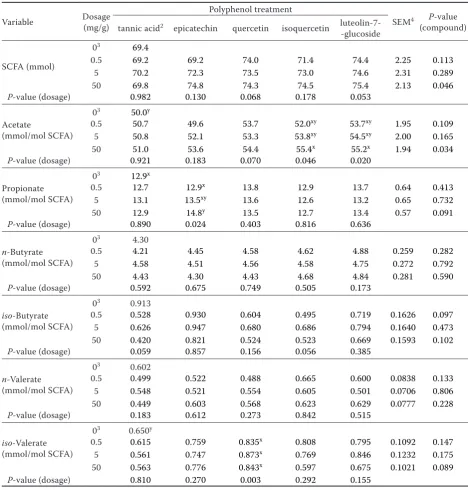
[image:6.595.62.533.123.614.2]was a dosage effect with luteolin-7-glucoside with a decrease in CH4 amounts with increasing dos-age. Relative to the negative control, tannic acid as well as epicatechin, quercetin, isoquercetin, and luteolin-7-glucoside reduced (P < 0.05) the Table 2. Effect of phenolic compounds and their dosage on the production of short-chain fatty acids (SCFA) during 24 h of fermentation in vitro1 (Experiment 1)
Variable Dosage (mg/g)
Polyphenol treatment
SEM4 P-value
(compound) tannic acid2 epicatechin quercetin isoquercetin luteolin-7-
-glucoside
SCFA (mmol)
03 69.4
0.5 69.2 69.2 74.0 71.4 74.4 2.25 0.113
5 70.2 72.3 73.5 73.0 74.6 2.31 0.289
50 69.8 74.8 74.3 74.5 75.4 2.13 0.046
P-value (dosage) 0.982 0.130 0.068 0.178 0.053
Acetate
(mmol/mol SCFA)
03 50.0y
0.5 50.7 49.6 53.7 52.0xy 53.7xy 1.95 0.109
5 50.8 52.1 53.3 53.8xy 54.5xy 2.00 0.165
50 51.0 53.6 54.4 55.4x 55.2x 1.94 0.034
P-value (dosage) 0.921 0.183 0.070 0.046 0.020
Propionate (mmol/mol SCFA)
03 12.9x
0.5 12.7 12.9x 13.8 12.9 13.7 0.64 0.413
5 13.1 13.5xy 13.6 12.6 13.2 0.65 0.732
50 12.9 14.8y 13.5 12.7 13.4 0.57 0.091
P-value (dosage) 0.890 0.024 0.403 0.816 0.636
n-Butyrate (mmol/mol SCFA)
03 4.30
0.5 4.21 4.45 4.58 4.62 4.88 0.259 0.282
5 4.58 4.51 4.56 4.58 4.75 0.272 0.792
50 4.43 4.30 4.43 4.68 4.84 0.281 0.590
P-value (dosage) 0.592 0.675 0.749 0.505 0.173
iso-Butyrate (mmol/mol SCFA)
03 0.913
0.5 0.528 0.930 0.604 0.495 0.719 0.1626 0.097
5 0.626 0.947 0.680 0.686 0.794 0.1640 0.473
50 0.420 0.821 0.524 0.523 0.669 0.1593 0.102
P-value (dosage) 0.059 0.857 0.156 0.056 0.385
n-Valerate (mmol/mol SCFA)
03 0.602
0.5 0.499 0.522 0.488 0.665 0.600 0.0838 0.133
5 0.548 0.521 0.554 0.605 0.501 0.0706 0.806
50 0.449 0.603 0.568 0.623 0.629 0.0777 0.228
P-value (dosage) 0.183 0.612 0.273 0.842 0.515
iso-Valerate (mmol/mol SCFA)
03 0.650y
0.5 0.615 0.759 0.835x 0.808 0.795 0.1092 0.147
5 0.561 0.747 0.873x 0.769 0.846 0.1232 0.175
50 0.563 0.776 0.843x 0.597 0.675 0.1021 0.089
P-value (dosage) 0.810 0.270 0.003 0.292 0.155
1values are averages of four replicates obtained from independent incubations except of negative control (n = 8) 2tannic acid acted as positive control
30-dosage (negative control without supplementation) that was always included when comparing different means 4standard error of the mean
amount of CH4 produced in relation to total gas produced with dosages of 0.5 mg/g (only tannic acid, quercetin, and luteolin-7-glucoside), 5 mg/g, and 50 mg/g DM, and this in a dosage depending way (P < 0.05). In detail, compared with the nega-tive control the maximal declines amounted to 17.9, 17.7, 15.5, 14.1, and 12.8% with the 50 mg/g DM dosage of luteolin-7-glucoside, tannic acid, quercetin, isoquercetin, and epicatechin, respec-tively. The incubation fluid NH3 concentration decreased (P < 0.05) with the 50 mg dosage of luteolin-7-glucoside (–11.5%) and tannic acid (–15.3%) compared to the negative control. The supplementation with different phenolic com-pounds had no effect on variables describing mi-crobial counts. However, there was a dosage effect (P < 0.05) with luteolin-7-glucoside, with reduced numbers of total bacteria (5 mg/g DM dosage) and total protozoa (0.5 mg/g DM dosage) (Table 1). The amount of SCFA produced and the SCFA profile were mostly not influenced by the type and dosage of phenolic compounds (Table 2). However, there were general treatment effects (P < 0.05) with the highest dosage in SCFA amount and acetate proportion of total SCFA concentration, and a trend (P = 0.10) in proportions of propionate,
iso-butyrate, and iso-valerate. In these cases, no differences (P > 0.10) between individual treat-ments were identified by the multiple comparisons among means. There were also occasional dosage effects (P < 0.05): increase of acetate proportion with isoquercetin and luteolin-7-glucoside, of propionate proportion with epicatechin, and of
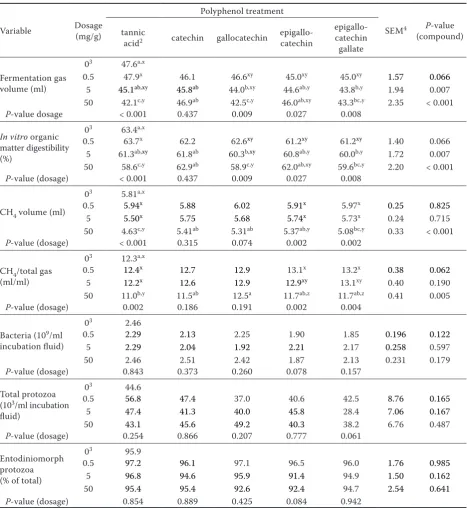
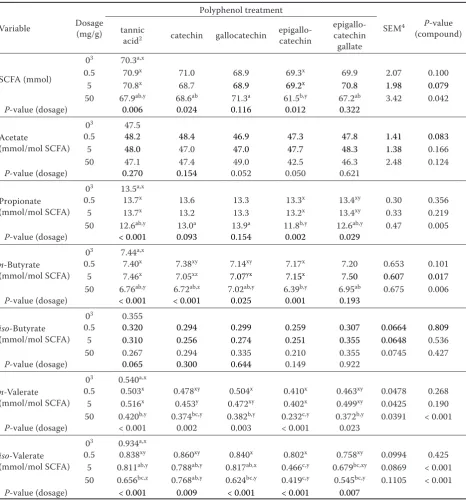
iso-valerate proportion with quercetin (Table 2). In Experiment 2, gallocatechin and epigallocat-echin gallate (provided at 5 and 50 mg/g DM) as well as tannic acid (50 mg/g DM) lowered (P < 0.05) fermentation gas formation and IVOMD compared to the negative control, and this in a dosage de-pendent way (the latter also with epigallocatechin) (Table 3). Compared to the negative control, the absolute amount of CH4 was reduced (P < 0.05) by tannic acid and epigallocatechin gallate when provided at 50 mg/g DM, and there were dosage effects (P < 0.05) with these two compounds and with epigallocatechin. When CH4 was related to total gas, only tannic acid was effective in reduction (P < 0.05) at the highest dosage, and dosage effects were found with the same compounds as those with absolute CH4 amount. The supplementation with different phenolic compounds had no effect
(P > 0.10) on microbial counts (Table 3). When supplementing the compounds at 50 mg/g DM, epigallocatechin lowered (P < 0.05) total SCFA concentration, as well as propionate and n-butyrate proportions of total SCFA compared to the negative control (Table 4). Furthermore, 50 mg of tannic acid and of any flavonoid (for epigallocatechin and epigallocatechin gallate also the 5 mg dosage) reduced (P < 0.05) proportions of n-valerate and
iso-valerate (except catechin). Various compounds exhibited dosage effects (P < 0.05) in either to-tal SCFA concentration or molar proportions of individual SCFA, with always the highest dosage being most effective.
DISCUSSION
on ruminal fermentation, methane and ammonia formation were thus tested for the first time (except catechin) (Becker et al. 2014) in the present study.
Compound effects on ruminal nutrient fer-mentation. The primary aim of the present study
[image:8.595.64.532.122.631.2]was to identify flavonoids with methane and NH3 Table 3. Effect of phenolic compounds and their dosage on the production of fermentation gases and on microbial counts during 24 h of fermentation in vitro1 (Experiment 2)
Variable Dosage (mg/g)
Polyphenol treatment
SEM4 P-value
(compound) tannic
acid2 catechin gallocatechin epigallo- catechin
epigallo- catechin gallate
Fermentation gas volume (ml)
03 47.6a,x
0.5 47.9x 46.1 46.6xy 45.0xy 45.0xy 1.57 0.066
5 45.1ab,xy 45.8ab 44.0b,xy 44.6ab,y 43.8b,y 1.94 0.007
50 42.1c,y 46.9ab 42.5c,y 46.0ab,xy 43.3bc,y 2.35 < 0.001 P-value dosage < 0.001 0.437 0.009 0.027 0.008
In vitro organic matter digestibility (%)
03 63.4a,x
0.5 63.7x 62.2 62.6xy 61.2xy 61.2xy 1.40 0.066
5 61.3ab,xy 61.8ab 60.3b,xy 60.8ab,y 60.0b,y 1.72 0.007
50 58.6c,y 62.9ab 58.9c,y 62.0ab,xy 59.6bc,y 2.20 < 0.001 P-value (dosage) < 0.001 0.437 0.009 0.027 0.008
CH4 volume (ml)
03 5.81a,x
0.5 5.94x 5.88 6.02 5.91x 5.97x 0.25 0.825
5 5.50x 5.75 5.68 5.74x 5.73x 0.24 0.715
50 4.63c,y 5.41ab 5.31ab 5.37ab,y 5.08bc,y 0.33 < 0.001 P-value (dosage) < 0.001 0.315 0.074 0.002 0.002
CH4/total gas
(ml/ml)
03 12.3a,x
0.5 12.4x 12.7 12.9 13.1x 13.2x 0.38 0.062
5 12.2x 12.6 12.9 12.9xy 13.1xy 0.40 0.190
50 11.0b,y 11.5ab 12.5a 11.7ab,z 11.7ab,z 0.41 0.005 P-value (dosage) 0.002 0.186 0.191 0.002 0.004
Bacteria (109/ml
incubation fluid)
03 2.46
0.5 2.29 2.13 2.25 1.90 1.85 0.196 0.122
5 2.29 2.04 1.92 2.21 2.17 0.258 0.597
50 2.46 2.51 2.42 1.87 2.13 0.231 0.179
P-value (dosage) 0.843 0.373 0.260 0.078 0.157
Total protozoa (103/ml incubation
fluid)
03 44.6
0.5 56.8 47.4 37.0 40.6 42.5 8.76 0.165
5 47.4 41.3 40.0 45.8 28.4 7.06 0.167
50 43.1 45.6 49.2 40.3 38.2 6.76 0.487
P-value (dosage) 0.254 0.866 0.207 0.777 0.061
Entodiniomorph protozoa (% of total)
03 95.9
0.5 97.2 96.1 97.1 96.5 96.0 1.76 0.985
5 96.8 94.6 95.9 91.4 94.9 1.50 0.162
50 95.4 95.4 92.6 92.4 94.7 2.54 0.641
P-value (dosage) 0.854 0.889 0.425 0.084 0.942
1values are averages of four replicates obtained from independent incubations except of negative control (n = 8) 2tannic acid acted as positive control
30-dosage (negative control without supplementation) that was always included when comparing different means 4standard error of the mean
mitigating properties. In order to have potential to be considered for sustainable ruminant nutrition, diets should not exert substantial adverse
[image:9.595.65.532.123.626.2]side-effects on ruminal fermentation and thus energy supply to the host. As indicators for the intensity of fermentation, production of fermentation gas Table 4. Effect of phenolic compounds and their dosage on the production of short-chain fatty acids (SCFA) during 24 h of fermentation in vitro1 (Experiment 2)
Variable Dosage (mg/g)
Polyphenol treatment
SEM4 P-value
(compound) tannic
acid2 catechin gallocatechin epigallo- catechin
epigallo-catechin
gallate
SCFA (mmol)
03 70.3a,x
0.5 70.9x 71.0 68.9 69.3x 69.9 2.07 0.100
5 70.8x 68.7 68.9 69.2x 70.8 1.98 0.079
50 67.9ab,y 68.6ab 71.3a 61.5b,y 67.2ab 3.42 0.042 P-value (dosage) 0.006 0.024 0.116 0.012 0.322
Acetate
(mmol/mol SCFA)
03 47.5
0.5 48.2 48.4 46.9 47.3 47.8 1.41 0.083
5 48.0 47.0 47.0 47.7 48.3 1.38 0.166 50 47.1 47.4 49.0 42.5 46.3 2.48 0.124
P-value (dosage) 0.270 0.154 0.052 0.050 0.621
Propionate (mmol/mol SCFA)
03 13.5a,x
0.5 13.7x 13.6 13.3 13.3x 13.4xy 0.30 0.356
5 13.7x 13.2 13.3 13.2x 13.4xy 0.33 0.219
50 12.6ab,y 13.0a 13.9a 11.8b,y 12.6ab,y 0.47 0.005 P-value (dosage) < 0.001 0.093 0.154 0.002 0.029
n-Butyrate (mmol/mol SCFA)
03 7.44a,x
0.5 7.40x 7.38xy 7.14xy 7.17x 7.20 0.653 0.101
5 7.46x 7.05xz 7.07yx 7.15x 7.50 0.607 0.017
50 6.76ab,y 6.72ab,z 7.02ab,y 6.39b,y 6.95ab 0.675 0.006 P-value (dosage) < 0.001 < 0.001 0.025 0.001 0.193
iso-Butyrate (mmol/mol SCFA)
03 0.355
0.5 0.320 0.294 0.299 0.259 0.307 0.0664 0.809
5 0.310 0.256 0.274 0.251 0.355 0.0648 0.536
50 0.267 0.294 0.335 0.210 0.355 0.0745 0.427
P-value (dosage) 0.065 0.300 0.644 0.149 0.922
n-Valerate (mmol/mol SCFA)
03 0.540a,x
0.5 0.503x 0.478xy 0.504x 0.410x 0.463xy 0.0478 0.268
5 0.516x 0.453y 0.472xy 0.402x 0.499xy 0.0425 0.190
50 0.420b,y 0.374bc,y 0.382b,y 0.232c,y 0.372b,y 0.0391 < 0.001 P-value (dosage) < 0.001 0.002 0.003 < 0.001 0.023
iso-Valerate (mmol/mol SCFA)
03 0.934a,x
0.5 0.838xy 0.860xy 0.840x 0.802x 0.758xy 0.0994 0.425
5 0.811ab,y 0.788ab,y 0.817ab,x 0.466c,y 0.679bc,xy 0.0869 < 0.001
50 0.656bc,z 0.768ab,y 0.624bc,y 0.419c,y 0.545bc,y 0.1105 < 0.001 P-value (dosage) < 0.001 0.009 < 0.001 < 0.001 0.007
1values are averages of four replicates obtained from independent incubations except of negative control (n = 8) 2tannic acid acted as positive control
30-dosage (negative control without supplementation) that was always included when comparing different means 4standard error of the mean
and SCFA were measured and IVOMD was calcu-lated. Further information about ruminal nutrient formation was obtained by determining SCFA profile and microbial counts per unit of fermentation fluid. In Experiment 1, two out of the compounds tested, luteolin-7-glucoside and isoquercetin, tended even to increase fermentation gas volume and IVOMD when added to ryegrass, while epicatechin and quercetin did not influence these parameters. Berger et al. (2015) found that quercetin aglycol and rutin (both as sources of quercetin) provided at 50 and 100 µmol of quercetin equivalents per litre (corresponding to 25.4 and 50.7 mg/g DM) did not influence gas pro-duction in Hohenheim Gas Test, either. In a subse-quent in vivo study with 10 and 50 mg of quercetin equivalents per kg of body weight (corresponding to 1.8 and 9.1 mg/g DM) administrated via rumen fistula, quercetin did not influence SCFA concentration or profile. An ethanol extract from portulaca rich in flavonoids, containing luteolin and quercetin, was found to enhance in vitro gas and SCFA production (Wang et al. 2013). Different from these flavonoids, in Experiment 2, tannic acid, gallocatechin, and epigal-locatechin gallate lowered fermentation gas formation and IVOMD while epigallocatechin lowered SCFA production. The decrease in gas and SCFA formation with tannic acid was not significant in Experiment 1. Although the same basal diet type was used, the dif-ferences in the response to the negative control and tannic acid (positive control) in Experiment 1 and 2 could be due to differences in the rumen fluid due to different diets fed to the donor cow but also due to the different chemical composition of the basal diet (ryegrass hay) used for the incubations. There is some evidence that gross nutrients like crude protein and fibre can interact with bioactive compounds and make them physically differently available for the microbes (cf. Cieslak et al. 2014). The influence of the three CT-related flavanols (gallocatechin, epigallocatchin, and epigallocatchin gallate) on fer-mentation is consistent with anti-nutrititional effects found with higher levels of CT, as CT can bind to feed proteins but also enzymes and carbohydrates thus reducing their ruminal degradation (reviewed by McSweeney et al. 2001). Also HT, and thus tannic acid, have this property (McSweeney et al. 2001). Besides the influence on SCFA concentration, also the SCFA profile was affected especially by tan-nic acid, catechin, gallocatechin, epigallocatechin, epigallocatechin gallate, and quercetin which all influenced iso-valerate. As short-chain iso-acids like
iso-valerate are microbial breakdown products of branched-chain amino acids (Gorosito et al. 1985),
a lower proportion of these SCFA coincides with the lower ammonia concentration found.
Compound effects on ruminal methane and ammonia formation. The effects of the com-pounds on CH4 emission from the fermentation of the ryegrass hay have to be distinguished into those affecting the absolute amount (tannic acid and epigallocatechin gallate) and those reducing CH4 in relation to total fermentation gas (tannic acid, epicatechin, quercetin, isoquercetin, luteolin-7-glucoside). The latter variable is an indicator for the amount of CH4 emitted per unit of net energy available to the animal and, in a wider sense, even per unit of milk or meat produced as performance depends on net energy supply.
methane mitigating effects of CT-containing diets (Jayanegara et al. 2012).
Excessive dietary protein degradation to NH3 by rumen microorganisms is an inefficient way to generate metabolisable protein for the host and may be at least partially inhibited by the complexation abilities of phenolic compounds (McSweeney et al. 2001). Apart from tannic acid (reduction by up to 15%), only luteolin-7-glucoside reduced NH3 con-centration in the incubation fluid (by up to 12%). This effect was even larger than the 8% reduction found with the same dosages of rutin (Leiber et al. 2012). Also Wang et al. (2013) described lowering of the NH3 concentration when supplementing lu-teolin via the portulaca extract. Phenols can reduce the accessibility of dietary protein to the microbes by forming complexes but may also directly inhibit proteolytic bacteria or their enzymatic activity (Patra et al. 2011). This results in a reduced protein degra-dation and, consequently, a lower NH3 concentra-tion in rumen fluid. As no data were available from Experiment 2, possible NH3-mitigating properties of four of the five CT-related flavonoids remain to be determined. Especially the polyphenols occurring in tannins (tannic acid and the flavanols catechin, epicatechin, gallocatchin, epigallocatechin, and epigallocatechin gallate) were expected to be able to diminish NH3 release from forage as has been shown in a large number of studies reviewed by McSweeney et al. (2001).
Dosage effects. There were dosage effects by many of the test compounds in a number of vari-ables. Most effects on ruminal CH4 emission and NH3 concentration were found with the highest dosage, 50 mg/g DM, some with 5 mg/g DM. In fermentation intensity (i.e. the level of production of fermentation gas and IVOMD), dosage effects were particularly large with epigallocatechin gallate but were also found with gallocatchin, epigallocatechin, isoquercetin, luteolin-7-glucoside, and tannic acid. Dosage effects on the level of reduction of CH4 emission (measured in respiration chamber) and ruminal NH3 concentration were also reported by Yang et al. (2017), who was offering diets with 0, 6.5, 13.0 or 26.0 g tannic acid/kg DM to beef cattle.
CONCLUSION
Out of the eight flavonoid compounds tested, luteolin-7-glucoside was most promising. Its sup-plementation mitigated CH4 and NH3 formation in rumen fluid in vitro at unchanged fermentation
activity. Different from tannic acid, luteolin-7-glu-coside mediated its effect against CH4 formation without compromising fermentation efficiency. However, further in vitro and in vivo studies with extracts of such plants are needed to find out the most effective sources and dosages.
REFERENCES
Aerts R.J., Barry T.N., McNabb W.C. (1999): Polyphenols and agriculture: beneficial effects of proanthocyanidins in forages. Agriculture, Ecosystems and Environment, 75, 1–12.
AOAC (1997): Official Methods of Analysis. 16th Ed.
As-sociation of Official Analytical Chemists, Arlington, USA. Beauchemin K.A., Kreuzer M., O’Mara F., McAllister T.A.
(2008): Nutritional management for enteric methane abatement: a review. Australian Journal of Experimental Agriculture, 48, 21–27.
Becker P.M., van Wikselaar P.G., Franssen M.C.R., de Vos R.C.H., Hall R.D., Beekwilder J. (2014): Evidence for a hydrogen-sink mechanism of (+)catechin-mediated emis-sion reduction of the ruminant greenhouse gas methane. Metabolomics, 10, 179–189.
Berger L.M., Blank R., Zorn F., Wein S., Metges C.C., Wolf-fram S. (2015): Ruminal degradation of quercetin and its influence on fermentation in ruminants. Journal of Dairy Science, 98, 5688–5698.
Bhagwat S., Haytowitz D.B., Holden J.M. (2014): USDA Database for the Flavonoid Content of Selected Foods, Release 3.1. US Department of Agriculture, Agricultural Research Service, Beltsville, USA. Available from https:// www.ars.usda.gov/ARSUserFiles/80400525/Data/Flav/ Flav_R03-1.pdf (accessed July 17, 2018).
Bjorklund G., Chirumbolo S. (2017): Role of oxidative stress and antioxidants in daily nutrition and human health. Nutrition, 33, 311–321.
Cieslak A., Szumacher-Strabel M., Stochmal A., Oleszek W. (2013): Plant components with specific activities against rumen methanogens. Animal, 7 (Suppl. 2), 253–265. Cieslak A., Zmora P., Stochmal A., Pecio L., Oleszek W.,
Pers-Kamczyc E., Szczechowiak J., Nowak A., Szumacher-Strabel M. (2014): Rumen antimethanogenic effect of Saponaria officinalis L. phytochemicals in vitro. The Journal of Agricultural Science, 152, 981–993.
Cieslak A., Zmora P., Matkowski A., Nawrot-Hadzik I., Pers-Kamczyc E., El-Sherbiny M., Bryszak M., Szumacher-Strabel M. (2016): Tannins from Sanguisorba officinalis affect in vitro rumen methane production and fermenta-tion. Journal of Animal and Plant Sciences, 26, 54–62. Cortes J.E., Moreno B., Pabon M.L., Avila P., Kreuzer M.,
con-densed tannins extracted from Calliandra, Flemingia and Leucaena on ruminal and postruminal degradation of soybean meal as estimated in vitro. Animal Feed Science and Technology, 151, 194–204.
Crozier A., Clifford M.N., Ashihara H. (2006): Phenols, polyphenols and tannins: an overview. In: Crozier A., Clifford M.N., Ashihara H. (eds): Plant Secondary Me-tabolites: Occurrence, Structure and Role in the Human Diet. Blackwell Publishing, 1–24.
Ehrlich G.G., Goerlitz D.F., Bourell J.H., Eisen G.V., Godsy E.M. (1981): Liquid chromatographic procedure for fermentation product analysis in the identification of anaerobic bacteria. Applied and Environmental Micro-biology, 42, 878–885.
Erlund I. (2004): Review of the flavonoids quercetin, hes-peretin, and naringenin. Dietary sources, bioactivities, bioavailability, and epidemiology. Nutrition Research, 24, 851–874.
Fabjan N., Rode J., Kosir I.J., Wang Z., Zhang Z., Kreft I. (2003): Tartary buckwheat (Fagopyrum tataricum Gaertn.) as a source of dietary rutin and quercitrin. Jour-nal of Agricultural and Food Chemistry, 51, 6452–6455. Field J.A., Lettinga G. (1987): The methanogenic toxicity
and anaerobic degradability of a hydrolyzable tannin. Water Research, 21, 367–374.
Gorosito A.R., Russell J.B., Van Soest P.J. (1985): Effect of carbon-4 and carbon-5 volatile fatty acids on digestion of plant cell wall in vitro. Journal of Dairy Science, 68, 840–847.
Hatahet T., Morille M., Hommoss A., Devoisselle J.M., Mul-ler R.H., Begu S. (2016): Quercetin topical application, from conventional dosage forms to nanodosage forms. European Journal of Pharmaceutics and Biopharmaceu-tics, 108, 41–53.
Jayanegara A., Wina E., Soliva C.R., Marquardt S., Kreu-zer M., Leiber F. (2011): Dependence of forage quality and methanogenic potential of tropical plants on their phenolic fractions as determined by principal compo-nent analysis. Animal Feed Science and Technology, 163, 231–243.
Jayanegara A., Leiber F., Kreuzer M. (2012): Meta-analysis of the relationship between dietary tannin level and meth-ane formation in ruminants from in vivo and in vitro experiments. Journal of Animal Physiology and Animal Nutrition, 96, 365–375.
Leiber F., Kunz C., Kreuzer M. (2012): Influence of dif-ferent morphological parts of buckwheat (Fagopyrum esculentum) and its major secondary metabolite rutin on rumen fermentation in vitro. Czech Journal of Animal Science, 57, 10–18.
Makkar H.P.S., Becker K., Abel H., Szegletti C. (1995): Degradation of condensed tannins by rumen microbes exposed to quebracho tannins (QT) in rumen simulation technique (RUSITEC) and effects of QT on fermentative
processes in the RUSITEC. Journal of the Science of Food and Agriculture, 69, 495–500.
Manach C., Scalbert A., Morand C., Remesy C., Jimenez L. (2004): Polyphenols: food sources and bioavailability. American Society for Clinical Nutrition, 79, 727–747. McSweeney C.S., Palmer B., McNeill D.M., Krause D.O.
(2001): Microbial interactions with tannins: nutritional consequences for ruminants. Animal Feed Science and Technology, 91, 83–93.
Menke K.H., Steingass H. (1988): Estimation of the energetic feed value obtained from chemical analysis and in vitro gas production using rumen fluid. Animal Research and Development, 28, 7–55.
Nelson K.E., Pell A.N., Schofield P., Zinder S. (1995): Isola-tion and characterizaIsola-tion of an anaerobic ruminal bacte-rium capable of degrading hydrolyzable tannins. Applied and Environmental Microbiology, 61, 3293–3298. Patra A.K., Min B.R., Saxena J. (2011): Dietary tannins
on microbial ecology of the gastrointestinal tract in ru-minants. In Patra A.K. (ed.): Dietary Phytochemicals and Microbes. Springer, Dordrecht, the Netherlands, 237–262.
Scola G., Conte D., Spada P.W., Dani C., Vanderlinde R., Funchal C., Salvador M. (2010): Flavan-3-ol compounds from wine wastes with in vitro and in vivo antioxidant activity. Nutrients, 2, 1048–1059.
Soliva C.R., Hess H.D. (2007): Measuring methane emis-sion of ruminants by in vitro and in vivo techniques. In: Makkar H.P.S., Vercoe P.E. (eds): Measuring Methane Production from Ruminants. Springer, Dordrecht, the Netherlands, 15–31.
Terrill T.H., Rowan A.M., Douglas G.B., Barry T.N. (1992): Determination of extractable and bound condensed tan-nin concentrations in forage plants, protein concentrate meals and cereal grains. Journal of the Science of Food and Agriculture, 58, 321–329.
Wang D., Huang J., Zhang Z., Tian X., Huang H., Yu Y., Zhang G., Ding J., Huang R. (2013): Influences of Portu-laca oleracea extracts on in vitro methane emissions and rumen fermentation of forage. Journal of Food, Agricul-ture and Environment, 11, 483–488.
Wischer G., Boguhn J., Steingass H., Schollenberger M., Rodehutscord M. (2013): Effects of different tannin-rich extracts and rapeseed tannin monomers on methane for-mation and microbial protein synthesis in vitro. Animal, 7, 1796–1805.
Yang K., Wei C., Zhao G.Y., Xu Z.W., Lin S.X. (2017): Ef-fects of dietary supplementing tannic acid in the ration of beef cattle on rumen fermentation, methane emis-sion, microbial flora and nutrient digestibility. Journal of Animal Physiology and Animal Nutrition, 101, 302–310.