Minimizing the Conditional Value-at-Risk for
a Single Operating Room Scheduling Problem
Mari Ito, Fumiya Kobayashi, and Ryuta Takashima
Abstract—We introduce a stochastic programming model for scheduling a single operating room using the conditional value-at-risk (CVaR) as a criterion. This criterion expresses the risk-averse attitude of the scheduler to the risk event that the expected end time of a surgery presumed by a surgeon can be considerably delayed. One of the important advantages of the CVaR is that the stochastic programming problem can be treated as a linear programming problem. Owing to this characteristic, the CVaR is more practical than traditional expectation based approaches. In this paper, we evaluate the effectiveness of the proposed model using numerical experiments.
Index Terms—Operations research in health services, Oper-ating room scheduling, Conditional value-at-risk.
I. INTRODUCTION
O
PERATING room management is important forim-proving patient treatment quality and reducing hospital costs. Fujiwara [5] suggested that efficient operating room management is an emerging solution for improving medical services in Japanese hospitals, where many patients experi-ence long waiting times before undergoing operations owing to an insufficient number of surgeons, anesthesiologists, and operating rooms. Such problems are also persistent in Europe owing to aging populations; therefore, providing efficient medical services has increasingly become important [2]. Many hospitals operate at a low level of efficiency; however, few analytical studies have reported on efficient medical services.
Similar to the case in most of the other countries, surgeries are the most important source of hospital revenue in Japan and are estimated to generate approximately two-thirds of the total revenues [6]. Thus, improving operating room management and effectiveness makes operating rooms an increasingly important hospital resource. However, Macario et al. [9] showed that operating rooms account for 40 % of the overall hospital costs, thus making them the most significant single cost source. Moreover, delayed operation starting times increase the probability of overtime, which further increases the costs [4].
The quality of operating room schedules is one of the most important factors in operating room management; improved operating room scheduling not only decreases patient waiting times but also reduces both the workload of surgeons and anesthesiologists and the required overtime. In addition, it increases the effectiveness of operating room utilization, which may partially resolve the problem of operating room shortages. Actually, the created schedules are not always
Manuscript received December 8. This work was supported by JSPS KAKENHI Grant Number JP16H07226.
M. Ito is with the Department of Industrial Administration, Tokyo University of Science, 2641 Yamazaki, Noda-shi Chiba 278-8510 Japan e-mail: [email protected].
F. Kobayashi and R. Takashima are with Tokyo University of Science.
suitable for operating room management and are often not closely followed. One reason for this is that required opera-tion times are self-reported by the surgeons; however, these time requirements are sometimes underestimated. This delays surgeries and makes the operating room unavailable for the subsequent scheduled surgeries.
The operating room scheduling problem has been studied by multiple researchers. For example, Lamiri et al. [8] formulated an operating room scheduling method to reduce overtime costs using a stochastic model by proposing a Monte Carlo optimization method comprising Monte Carlo simulations and mixed integer programming. Denton et al. [3] proposed a two-stage stochastic programming model for operating room scheduling. There are also multiple case studies that consider individual hospital characteristics. Blake and Donald [1] solved the operating room scheduling problem at Mount Sinai Hospital using an integer program-ming model. This approach greatly influenced the scheduling process at the hospital; it fairly allocates operation times to surgeons, reduces operating room manager workloads, and avoids conflicts between surgeons and operating room managers. Ito et al. [7] proposed an estimation method to calculate operation durations using regression analysis and a mixed integer programming model for the operating room scheduling problem. Moreover, they developed an operat-ing room scheduloperat-ing system to use their proposed method automatically and applied it to operating room scheduling at the Aichi Medical University Hospital in Japan. It is important to prepare a detailed schedule of the operating room and to operate the operating room efficiently. In par-ticular, stochastic approaches capture uncertainties that are frequently encountered.
The stochastic programming problem for operating room scheduling is generally formulated to minimize the expected value of the total delay of surgery from the expected end time. However, this approach cannot adequately address the risk facing a surgery with a very large delay from the expected end time. In other words, minimizing the expected value does not adequately express the risk-averse attitude of the scheduler to the risk that the expected end time of a surgery presumed by a surgeon can be considerably delayed. In this study, we incorporate the CVaR as a criterion in the operating room scheduling problem. To date, there have been no examples of applying the CVaR in the operating room scheduling problem.
provides the motivation and describes the proposed model of single operating room scheduling. Section 4 shows the results obtained by numerical experiments. Section 5 summarizes the paper and identifies the areas for future work.
II. CONDITIONAL VALUE-AT-RISK
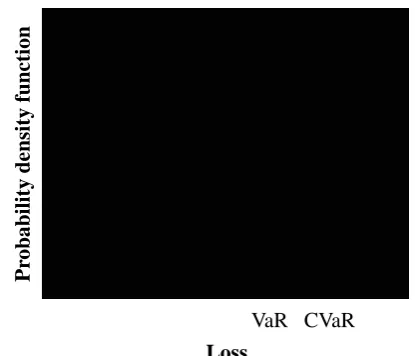
Variance is a well-utilized risk measure. Using variance in a risk measure has several disadvantages. First, the case in which a loss is lower than its expected value is also evaluated as a risk. Second, a stochastic programming model that incorporates variance into its mathematical programming model becomes nonlinear. The value at risk (VaR) is another well-utilized risk measure. The VaR is defined using an α -quantile, which is a value that divides the discrete probability distribution into a certain percentage,αand1−α. Figure 1 shows an image of the VaR. The vertical axis indicates the probability density function, and the horizontal axis indicates the loss. This criterion can adequately address the risk facing a very large loss. However, a stochastic programming model that incorporates the VaR into its mathematical programming model becomes nonlinear because there is no convexity. The CVaR is a coherent risk measure and is also considered as a measure to improve the disadvantages of the VaR. The CVaR is suitable for incorporation into mathematical programming problems because the coherent risk measure is convex.Fη˜(z) defines the cumulative distribution function of a random variable η˜ for the loss. When the cumulative distribution functionFη˜(z)is continuous, we can represent the following: CVaRα(˜η) =Eη˜[˜η|η˜≥VaRα(˜η)], (1)
= 1
1−α ∫ ∞
VaRα( ˜η)
zdF˜η(z), (2)
whereα∈ {0,1}.
The CVaR is defined as the form of the expected loss for the range exceeding the VaR. Figure 1 shows an image of the VaR and CVaR. Particularly, the CVaR can be formulated as an optimum value for the following minimization problem. The optimal solution of the minimization problem is the VaR.
CVaRα(˜η) =minvv+
1
1−αEη˜[(˜η−v)
+]. (3)
When the CVaR is adopted as a risk measure, it can be formulated as follows using the weighting factorβ∈ {0,1}: minx(1−β)Eξ˜[V(x,ξ˜)] +βCVaRα(V(x,ξ˜)), (4)
subject to
Ax=b, (5)
x≥0, (6)
where V(x,ξ˜) is the cost function with a variable xof an
n1 dimensional vector and a random variableξ˜,Eξ˜[V(x,ξ˜)] is the expected value of the cost, A is an m1×n1 matrix, andb is anm1 dimensional vector.
Assume that the distribution of ξ˜ has a finite support Θ = {ξ1, ..., ξK} and the probability pk is given to ξk
(k is the scenario) when the random variable follows the discrete probability distribution. To simplify the expressions, we introduce a new variable u(ξk)>0, k= 1, ..., K. This
problem can be expressed as follows using definition (2) of the CVaR:
minx,y(ξ1),...,y(ξK),v,u(ξ1),...,u(ξK) (7)
(1−β)
( cTx+
K ∑
k=1
pkq(ξk)Ty(ξk)
)
+β (
v+ 1 1−α
K ∑
k=1
pku(ξk)
) ,
subject to
cTx+q(ξk)Ty(ξk)−v≤u(ξk), k= 1, ..., K, (8)
u(ξk)≥0, k= 1, ..., K, (9)
Ax=b, (10)
T(ξk)x+W y(ξk) =h(ξk), k = 1, ..., K, (11)
x≥0, (12)
y(ξk)≥0, k= 1, ..., K, (13)
wherecis a parameter of ann1dimensional vector,q(ξk)is a parameter of ann2dimensional vector,y(ξk)is a variable of ann2 dimensional vector,T(ξk) is anm2×m1 matrix, andW is an m2×n2 matrix.
The above results in a linear programming problem when the CVaR is incorporated as a risk measure in a two-stage programming problem under a discrete probability distribution. Sarin et al. [10] introduced the use of the CVaR as a criterion for stochastic scheduling problems. They demonstrated its application for the single or parallel machine scheduling problem and exhibited the use of the CVaR and the effectiveness of minimizing it in that context.
Loss
P
rob
ab
il
it
y
d
en
si
ty
fu
n
ct
ion
[image:2.595.320.528.584.762.2]VaR CVaR
Duration of surgery
a: Time to prepare hospitals for the surgery b: Time to prepare the surgery
c: Time to administer the anesthesia d: Time to perform the surgery e: Time to awake from anesthesia f: Time to clean up the operating room
[image:3.595.323.551.550.773.2]a b c d e f
Fig. 2. Stages in a single surgery.
Expected end time
Surgery 1 Surgery 2
Delay
Finishing time Finishing time
(Expected end time)
Fig. 3. Example of a schedule in a single operating room.
III. SINGLE OPERATING ROOM SCHEDULING
A. Motivation
For most hospitals in Japan, departments have a limited amount of available time in an operating room according to the day of the week and the time of the day. The surgeon and the patient decide on the desired surgery date and starting time of the surgery within the time available for the operating room. Surgeons propose the durations of their own surgeries and the desired starting times to the scheduler of the operating room. Then, the scheduler creates a schedule using the proposed durations of the surgeries. These operat-ing room schedules are often created manually. In general, the scheduler assigns surgeries from the same department sequentially when several departments use a single operating room. This is because surgeries from the same department are likely to use the same medical equipment. In addition, time adjustments for surgeries within one department are easier to complete than the adjustments between multiple departments. Figure 2 shows the stages in a single surgery in detail. We define the duration of a surgery as a total of the time required for preparing the operating room for the surgery, the time required for performing the surgery, and the time required for cleaning the operating room (i.e., from time a to time f in Fig. 2). The patient receives several treatments during times
b, c, d, ande. Figure 3 shows an example of a schedule for a single operating room. We define the delay in a surgery as the length of time between the expected end time presumed by a surgeon to finishing time determined as requested. In Fig. 3, surgery 1 has the same time as the expected end time and the finishing time determined as requested. For Surgery 2, the expected end time and the finishing time determined as requested are different. Therefore, the surgery delay is the difference between the expected end time and the finishing time.
B. The model
We consider a model of a single operating room scheduling problem that determines the sequences of surgeries in a single operating room. We assume that the durations of the surgeries are the only random variables in this problem. Consider the following notation.
Notation Index sets
J: Set of surgeries
S: Set of scenarios
D: Set of departments
Ed: Set of surgeries belonging to the same
depart-mentd,d∈D
Parameters
wj: Weight of surgeryj, (∀j∈J)
pjs: Duration of surgery j under scenario s, (∀j ∈ J,
∀s∈S)
dj: Expected end time of surgeryjpresumed by a
sur-geon, which is defined asdj=bj+Es[ ∑
j∈Jpjs],
wherebjis defined as the starting time of surgeryj
presumed by a surgeon, (∀j∈J)
πs: Probability of scenarios, (∀s∈S)
α: Probability level,α∈(0,1)
β: Weighting factor,β∈(0,1) Variables
cjs: Finishing time of surgeryjunder scenarios, (∀j∈ J,∀s∈S)
tjs: Delay of surgery j from the expected end time
under scenarios, (∀j ∈J,∀s∈S)
η: A threshold value (equal to the VaR when an
optimal solution is obtained)
µs: Amount of delay of surgery tjs exceeding the
threshold valueη under scenarios, (∀s∈S)
zij: Surgery precedence binary variable, where,zij = 1
if surgeryi is processed before surgeryj, zij = 0
otherwise, (∀i, j∈J, i̸=j) Formulation
minimize (1−β)Es[ ∑
j∈J wjtjs]
+β(η+ 1 1−α
∑
s∈S
πsµs) (14)
subject to
η+µs≥ ∑
j∈J
wjtjs, ∀s∈S, (15) ∑
j∈J\{j}
piszij+pjs≤cjs, ∀s∈S, j∈J, (16)
tjs+dj ≥cjs, ∀s∈S, j∈J, (17)
zij+zji= 1, ∀i̸=j∈J, (18)
|∑
j∈J zij−
∑
j∈J
zi′j|= 1, ∀i̸=i′ ∈Ed,∀d∈D, (20)
cjs≥0, ∀s∈S, j∈J, (21)
tjs≥0, ∀s∈S, j∈J, (22)
µs≥0, ∀s∈S, j∈J, (23)
zij ∈ {0,1}, ∀i̸=j ∈J. (24)
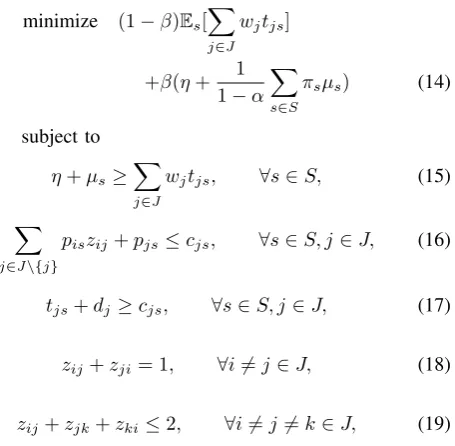
In the formulation above, objective function (14)
com-prises two terms, each having weights 1-β and β. The
first term of the objective function minimizes the expected value of the total weighted delay. The second term of the objective function minimizes the CVaR. For each scenario
s, constraint (15) determines µs to be the amount of
to-tal weighted delay that exceeds the threshold value of η
(if at all). Constraint (16) bounds the surgery finishing times according to the surgery sequencing relationships. Constraint (17) determines the delay of the surgeries. Con-straints (18) and (19) ensure the feasibility of the surgery sequence by eliminating cyclic sequences. Constraint (20) sequentially allocates surgeries i and i′ because surgeries i
andi′are in the same department. Constraints (21), (22), and (23) are non-negative constraints. Constraint (24) is a binary constraint.
These scenarios are derived either from discrete approx-imations of the underlying distributions of the problem parameters or from a scenario generation procedure, with the probability valueπs being associated with a scenarios,
∀s∈S.
IV. NUMERICAL EXPERIMENTS
A. Data
In this section, we present numerical experiments to evalu-ate the performance of our proposed formulation. In general, two to five surgeries are scheduled in a single operating room [7]. As an example, we consider a five-surgery problem with 100 scenarios, i.e., J = 5 andS= 100. The durations of the surgery are assumed to follow left-truncated log-normal distributions that are truncated at zero to ensure non-negativity. Scenario-wise values of pj were generated via
Monte Carlo sampling. Figure 4 shows histograms of the scenario-wise values of the duration of surgery j (pj). The
surgery parameter values are summarized in Table 1. These parameters are generated by means of a simulation based on the parameters of a previous study [7]. wj has a value
of 1. Surgeries 1 and 2 belong to the same department. Surgeries 3, 4, and 5 belong to different departments, i.e.,
D = 4, E1 = 1,2,E2= 3,E3 = 4, andE4= 5. We solve the single operating room scheduling problem by minimizing the CVaR withα= 0.8.
TABLE I
PARAMETERS OF AN EXAMPLE PROBLEM
Surgeryj 1 2 3 4 5
E[pj](min.) 334 215 207 309 107
Var[pj](min.) 7046 4700 2586 4845 1850
bj(min.) 1 50 100 150 1
dj(min.) 335 265 307 459 108
0 0.05 0.1 0.15 0.2 0.25 0.3 0.35 0.4
160 230 300 370 440 510 580 650 720 790
P
ro
b
a
b
il
it
y
Duration of surgery 1
Ϭ Ϭ͘Ϭϱ Ϭ͘ϭ Ϭ͘ϭϱ Ϭ͘Ϯ Ϭ͘Ϯϱ Ϭ͘ϯ Ϭ͘ϯϱ
130 180 230 280 330 380 430 480 530 580
P
ro
b
a
b
il
it
y
Duration of surgery 2
0 0.05 0.1 0.15 0.2 0.25 0.3
130 160 190 220 250 280 310 340 370
P
ro
b
a
b
il
it
y
Duration of surgery 3
0 0.05 0.1 0.15 0.2 0.25 0.3 0.35 0.4
180 230 280 330 380 430 480 530
P
ro
b
a
b
il
it
y
Duration of surgery 4
0 0.05 0.1 0.15 0.2 0.25 0.3 0.35
60 80 100 120 140 160 180 200 220 240
P
ro
b
a
b
il
it
y
[image:4.595.54.292.54.182.2]Duration of surgery 5
Fig. 4. Histograms of the scenario-wise values of the duration of surgery
TABLE II
RESULTS UNDER DIFFERENTβ
β Optimal sequence Objective function Expected value of CVaR
δβ value (min.) total weighted delay (min.)
0 5, 3, 2, 1, 4 181119 1811.19 3018
0.1 5, 3, 2, 1, 4 163309 1811.19 3018
0.2 5, 3, 2, 1, 4 145498.8 1811.19 3018 0.3 5, 3, 2, 1, 4 127688.7 1811.19 3018 0.4 5, 3, 4, 2, 1 111924.8 1845.70 2957 0.5 5, 3, 4, 2, 1 93763.5 1845.70 2957 0.6 5, 3, 4, 2, 1 75597.8 1845.59 2957 0.7 5, 3, 4, 2, 1 57440.9 1845.70 2957 0.8 5, 3, 4, 2, 1 39279.6 1845.70 2957 0.9 5, 3, 4, 2, 1 21118.3 1845.70 2957
1 5, 3, 4, 2, 1 2957 2955.83 2957
0 0.2 0.4 0.6 0.8 1 1.2
1200 1400 1600 1800 2000 2200 2400 2600 2800 3000
C
u
m
u
la
ti
v
e
P
ro
b
a
b
il
it
y
[image:5.595.305.550.38.445.2]Total weighted delay (min.) ȕ=0 ȕ=0.5 ȕ=1
Fig. 5. Cumulative distribution function of the total weighted delay of surgeries forβ= 0,β= 0.5andβ= 1.
B. Results
The computer used to generate the schedule was equipped with an Intel Core 2.30GHz processor (i5-6200U) and 8 GB RAM. The CPU time required to solve the formulated stochastic programming problem was 3 s using the IBM ILOG CPLEX 12.6.3 solver. In the generated test instances, there were 2729 constraints and 1130 variables. We provide some numerical examples for various weighting factors ofβ
that range from 0 to 1 to assess the effects of the weighting factor β on the optimal solution (Table 2). The case of
β = 0 minimizes the expected value of the total weighted delay without considering the risk measure, i.e., risk neutral behavior. Conversely, the case of β = 1 minimizes the risk measure, i.e., risk-averse decision making. Minimizing the expected value of the total weighted delay (β = 0) results in the optimal sequence δ0 = 5, 3, 2, 1, and 4. The expected value of the total weighted delay becomes a small value of 1811.19; however, the value of the CVaR is a large value of 3018. In this case, there is a risk that a large delay might occur. The criterion of minimizing the CVaR, i.e., β = 1, resulted in the optimal sequence δ1 = 5, 3, 4, 2, and 1. Even though the CVaR becomes a small value of 2957, the expected value of the total weighted delay is a large value of 2955.83. The objective function value ofβ = 1 is 61.25 times less than that of β= 0 and 31.70 times less than that of β = 0.5. The expected value of the total weighted delay ofβ= 0is 1.63 times less than that ofβ= 1and 1.02 times less than that of β= 0.5. The CVaR ofβ = 1is 1.02 times less than that ofβ = 0.
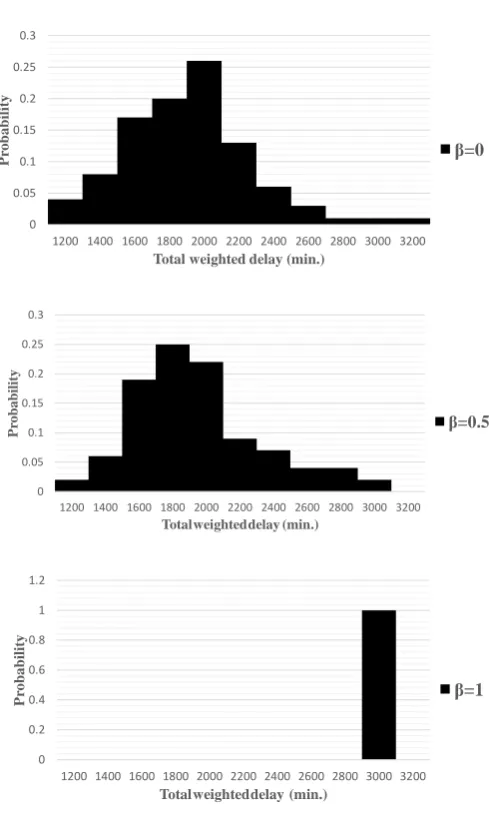
The cumulative distribution functions of the total weighted delay under both sequences are shown in Fig. 5. Therefore, the cumulative distribution function of β = 1 andβ = 0.5 reach a probability of 1 at a total weighted delay value of 3000, while β = 0 has a substantial associated probability of exceeding this value. This example represents the risk-averse nature of the CVaR and its effectiveness in reducing
Ϭ Ϭ͘Ϭϱ Ϭ͘ϭ Ϭ͘ϭϱ Ϭ͘Ϯ Ϭ͘Ϯϱ Ϭ͘ϯ
ϭϮϬϬ ϭϰϬϬ ϭϲϬϬ ϭϴϬϬ ϮϬϬϬ ϮϮϬϬ ϮϰϬϬ ϮϲϬϬ ϮϴϬϬ ϯϬϬϬ ϯϮϬϬ
P
ro
b
a
b
il
it
y
Total weighted delay (min.)
ȕ=0
Ϭ Ϭ͘Ϭϱ Ϭ͘ϭ Ϭ͘ϭϱ Ϭ͘Ϯ Ϭ͘Ϯϱ Ϭ͘ϯ
ϭϮϬϬ ϭϰϬϬ ϭϲϬϬ ϭϴϬϬ ϮϬϬϬ ϮϮϬϬ ϮϰϬϬ ϮϲϬϬ ϮϴϬϬ ϯϬϬϬ ϯϮϬϬ
P
ro
b
a
b
il
it
y
Totalweighteddelay (min.)
ȕ=0.5
Ϭ Ϭ͘Ϯ Ϭ͘ϰ Ϭ͘ϲ Ϭ͘ϴ ϭ ϭ͘Ϯ
ϭϮϬϬ ϭϰϬϬ ϭϲϬϬ ϭϴϬϬ ϮϬϬϬ ϮϮϬϬ ϮϰϬϬ ϮϲϬϬ ϮϴϬϬ ϯϬϬϬ ϯϮϬϬ
P
ro
b
a
b
il
it
y
Totalweighteddelay (min.)
ȕ=1
Fig. 6. Histograms of the total weighted delay of surgeries forβ = 0, β= 0.5, andβ= 1.
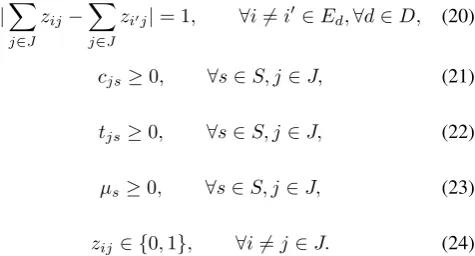
the variability. Figure 6 shows the histograms of the total weighted delays of surgeries forβ = 0,β = 0.5, andβ= 1. The objective function value of β = 1 is smaller than those of the otherβ values. The expected value of the total weighted delay ofβ= 0is the smallest of theβ values. The CVaR ofβ = 0.5 andβ = 1is smaller than that ofβ = 0. The maximum values of the total weighted delays ofβ = 0.5 andβ= 1are smaller than that ofβ = 0. It is important to consider both the expected value of the total weighted delay and the CVaR to create a single operating room schedule.
[image:5.595.304.547.62.220.2]V. CONCLUDING REMARKS
We develop a stochastic programming model for schedul-ing a sschedul-ingle operatschedul-ing room. We derive an optimal sequence for surgeries that minimizes the expected value of the total weighted delay and the CVaR. We analyze the effects of the weighting factor on the expected value of the total weighted delay and the CVaR. Thus, we find that it is important to consider the expected value of the total weighted delay and the CVaR to create a single operating room schedule.
In the future, we will compare the results obtained by the objective function including the CVaR to other approaches with the VaR or variance as the risk measures. In addition, the proposed model should be expanded to a multi-operating room scheduling model.
REFERENCES
[1] Blake, J.T. and Donald, J.: “Mount Sinai Hospital Uses Integer Program-ming to Allocate Operating Room Time,”Interfaces, vol. 32, no. 2, pp. 63–73, 2002.
[2] Cardoen, B. E. & Demeulemeester, B. J.: “Operating Room Planning and Scheduling: A Literature Review,”European Journal of Operational Research, vol. 201, no. 3, pp. 921-932, 2010.
[3] Denton, B.J. & Viapiano, A.V.: “Optimization of Surgery Sequencing and Scheduling Decisions under Uncertainty,”Health Care Management Science, vol. 10, no. 1, pp. 13–24, 2007.
[4] Dexter, F. & Macario, A.: “Applications of Information Systems to Operating Room Scheduling,”Anesthesiology, vol. 85, pp. 1232–1234, 1996.
[5] Fujiwara, Y.: “Data Analysis of Health Care Service Focusing on Acute Care Medicine,” Communication of Operations Research Society of Japan, vol. 58, no. 11, pp. 651-656, 2013 (in Japanese).
[6] Jackson, R.: “The Business of Surgery,”Health Management Technol-ogy, vol. 23, no. 7, pp. 20-22, 2002.
[7] Ito, M., Suzuki, A. & Fujiwara, Y.: “A Prototype of Operating Rooms Scheduling System: A Case Study in Aichi Medical University Hospi-tal,”Japan Industrial Management Association, vol. 67, no. 2E, pp. 202-214, 2016.
[8] Lamiri, M., Xie, X., Dolgui, A. & Grimaud, F.: “A Stochastic Model for Operating Room Planning with Elective and Emergency Demand for Surgery,”European Journal of Operational Research, vol. 185, pp. 1026–1037, 2008.
[9] Macario, A., Vitez, T. S., Dunn, B., & McDonald,T.: “Where are the Costs in Perioperative Care?: Analysis of Hospital Costs and Charges for Inpatient Surgical Care,”Anesthesiology, vol. 83, no. 6, pp. 1138– 1144, 1995.