LEABHARLANN CHOLAISTE NA TRIONOIDE, BAILE ATHA CLIATH TRINITY COLLEGE LIBRARY DUBLIN OUscoil Atha Cliath The University of Dublin
Terms and Conditions of Use of Digitised Theses from Trinity College Library Dublin Copyright statement
All material supplied by Trinity College Library is protected by copyright (under the Copyright and Related Rights Act, 2000 as amended) and other relevant Intellectual Property Rights. By accessing and using a Digitised Thesis from Trinity College Library you acknowledge that all Intellectual Property Rights in any Works supplied are the sole and exclusive property of the copyright and/or other I PR holder. Specific copyright holders may not be explicitly identified. Use of materials from other sources within a thesis should not be construed as a claim over them.
A non-exclusive, non-transferable licence is hereby granted to those using or reproducing, in whole or in part, the material for valid purposes, providing the copyright owners are acknowledged using the normal conventions. Where specific permission to use material is required, this is identified and such permission must be sought from the copyright holder or agency cited.
Liability statement
By using a Digitised Thesis, I accept that Trinity College Dublin bears no legal responsibility for the accuracy, legality or comprehensiveness of materials contained within the thesis, and that Trinity College Dublin accepts no liability for indirect, consequential, or incidental, damages or losses arising from use of the thesis for whatever reason. Information located in a thesis may be subject to specific use constraints, details of which may not be explicitly described. It is the responsibility of potential and actual users to be aware of such constraints and to abide by them. By making use of material from a digitised thesis, you accept these copyright and disclaimer provisions. Where it is brought to the attention of Trinity College Library that there may be a breach of copyright or other restraint, it is the policy to withdraw or take down access to a thesis while the issue is being resolved.
Access Agreement
By using a Digitised Thesis from Trinity College Library you are bound by the following Terms & Conditions. Please read them carefully.
Developing and Implementing Models for the Prevalence,
Incidence and Geographic Spread of O piate Use in
Ireland.
Ms. Orla Dempsey
Supervisor: Prof. Catherine Comiskey
School of Nursing and Midwifery,
Faculty of Health Sciences
A thesis subm itted to the
U n iv e rs ity o f D u b lin , T rin ity C ollege
for the degree of
D o c to r o f P h ilo so p h y
TRINITY COLLEGE
D eclaration
I hereby declare th a t the work described in this thesis is, except where otherwise stated, entirely my own work and has not been subm itted as an exercise for a degree at this or any other university.
I agree th a t Trinity College Library may lend or copy this thesis upon request. Signed
Ckia'Gm
Sum m ary
The objective of this study is to further develop and implement established m ath em atical models for the first tim e to the problem of estim ating the tru e size of the opiate epidemic and to develop and apply existing m athem atical models to the prob lem of modelling the geographic spread of opiate use in Ireland. Estim ates of the true size and spread of the opiate epidemic are difficult to obtain due to the hidden nature of opiate use however these estim ates are vital for policy makers and service providers when planning for the provision of effective treatm ent services. In a bid to estim ate the true size of the epidemic this research focuses on deriving suitable models to estim ate the prevalence and incidence of opiate use in Ireland.
The back calculation model from AIDS epidemiology is applied to the problem of estim ating the hidden, untreated incidence of opiate use. An estim ate of the hidden incidence is produced by back calculating from the known treated incidence through an estim ated latency period of opiate use. T he back calculation model is analytically solved and the solutions obtained are used to produce estim ates of the hidden, untreated incidence of opiate use when the exact rate of progression to treatm ent is unknown. In a bid to produce more accurate incidence estim ates d a ta on times from first opiate use to first treatm en t are obtained.
fitting G am m a and Weibull probability distributions to d a ta on 5,022 times to tre a t m ent for previously untreated opiate users. The exact rate of progression to first treatm en t along with a range of forms of treated incidence is applied to the back calculation model which is then solved analytically for the first tim e. The solutions obtained are applied to the problem of estim ating the true size of the hidden, un treated population of opiate users who will present for their first treatm ent in the future.
A vast array of techniques to estim ate the prevalence of drug and opiate use exist however a new approach which is not heavily d ata dependent would be beneficial to reseai'chers, policy makers and service providers. An integral equation model to estim ate the prevalence of opiate use is derived. The prevalence model derived is based on the models developed for the hidden incidence of opiate use. Estim ates of the prevalence of opiate use are produced when the exact rate of progression to treatm ent is unknown and known. W hilst estim ates of the tru e size of the epidemic are necessary, it is essential to determ ine where the epidemic will spread in order to determ ine measures to prevent further spread. A partial differential equation which uses the prevalence estim ates produced, is derived to describe the geographic spread of opiate use in Ireland. Techniques to estim ate model param eters for the p artial differential equation are developed and the hypothetical geographic spread of opiate use from Dublin to Wexford is simulated.
C ontents
1 In tro d u c tio n to M a th em a tic a l M o d e llin g and P r o b le m D r u g U se 1
1.1 Thesis Introduction and A i m s ... 1
1.1.1 Thesis O u t l i n e ... 2
1.2 The Modelling P r o c e s s ... 4
1.3 Introduction to M athem atical Modelling in E p id e m io lo g y ... 6
1.4 M o d e ls... 12
1.5 Historical Background to Drug U s e ... 16
1.5.1 Background to Illegal Drug Use in I r e l a n d ... 17
1.5.2 Background to Problem Opiate Use in Ireland ... 23
1.5.3 History of Irish Drug P o lic y ... 26
1.6 M athem atical Modelling and Illegal Drug U s e ... 30
1.7 Discussion and C o n c lu s io n s ... 35
1.8 Chapter S u m m a r y ... 36
2 E stim a tin g th e In cid en ce o f H id d en , U n tr e a te d O p ia te U se 37 2.1 In tro d u c tio n ... 37
2.2 M e th o d o lo g y ... 38
2.2.2 The R ate of Progression to First T reatm ent for Opiate Use, f(t) 41 2.2.3 Analytical Solutions for the U ntreated Incidence of Opiate
Use, U ( t ) ... 43
2.3 R e s u lts ... 46
2.3.1 Results - New Cases of Treated O piate Use, T ( t ) ... 46
2.3.2 Results - The R ate of Progression to Treatm ent, f ( t ) ... 50
2.3.3 Results - T he Hidden, U ntreated Incidence of Opiate Use, U(t) 53 2.4 Conclusion and D isc u ssio n ... 59
2.5 C hapter S u m m a r y ... 60
3 M o d e llin g th e R a te o f P r o g r essio n to F irst T rea tm en t for O p iate U se 61 3.1 In tro d u c tio n ... 61
3.2 Modelling the Incubation Period of Infectious Disease ... 62
3.3 M e th o d o lo g y ... 64
3.3-1 Probability Density F u n c t i o n ... 65
3.3.2 The G am m a and Weibull D istributions... 65
3.3.3 Probability P l o t s ... 67
3.3.4 The M ethod of Moments ... 68
3.4 D a t a ... 70
3.5 R e s u lts ... 76
3.5.1 Results: F itting the Weibull D istribution to the D ata . . . . 77
3.6 Conclusions and D iscussions... 81
3.7 C hapter S u m m a r j '... 82
4 E stim a tes o f th e In cid en ce o f U n tr e a te d O p ia te U s e w h e n th e E x a ct R a te o f P r o g r essio n to T rea tm en t is K n o w n 83 4.1 In tro d u c tio n ... 83
4.2 M e th o d o lo g y ... 84
4.2.1 Exponential Growth in F irst Treatm ent C o n tacts... 86
4.2.2 Linear Growth in First T reatm ent C o n t a c t s ... 89
4.2.3 Q uadratic Growth in F irst Treatm ent C o n t a c t s ... 91
4.3 Results - The Hidden, U ntreated Incidence of O piate Use, U(t) . . . 96
4.4 Conclusions and D is c u s s io n ... 99
4.5 C hapter S u m m a r y ... 101
5 E stim a tin g th e P rev a len ce o f O p ia te U se in Irela n d 102 5.1 In tro d u c tio n ... 102
5.1.1 M ethods for Estim ating the Prevalence of Illegal D rug Use . 103 5.2 M e th o d o lo g y ... 108
5.2.1 Case 1. Exponential model of T ( u ) ... 113
5.2.2 Case 2. Linear model of T ( u ) ... 115
5.2.3 Case 3. Q uadratic form of T ( u ) ... 116
5.3 R e s u lts ... 118
5.3.1 Results - Prevalence E s t i m a t e s ... 119
5.4 Conclusions and D is c u s s io n ... 123
6 D e v e lo p in g and Im p le m en tin g a M o d e l for th e G eograp h ical Spread
o f O p ia te U se in Irela n d 126
6.1 In tro d u c tio n ... 126
6.1.1 Modelling the Geographic Spread of O piate Use ... 127
6.2 M e th o d o lo g y ... 128
6.3 A Basic Model of the Spatial Spread of Infectious O piate Users . . . 131
6.4 Numerical Simulation of the Basic Model ... 133
6.4.1 Estim ates of the Irish Param eters for the Basic Model . . . . 133
6.5 Simulation Results for the Spread of Infectious Opiate Users in Ireland 137 6.6 Conclusion and D iscu ssio n ... 140
6.7 C hapter S u m m a r y ... 142
7 C o n clu sio n s and F urther W ork 143 7.1 I n tro d u c tio n ... 143
7.2 C o n c lu s io n s ... 144
7.3 Relevance of W o r k ... 145
List o f Figures
1.1 Schem atic diag ram of th e m odelling process. Source: B arnes & Ful-ford (2002, p. 10)... 5 1.2 C ocaine as th e m ain problem drug of m isuse by tre a tm e n t sta tu s ,
1998 to 2002 (Long et al. 2005)... 19 1.3 All tre a tm e n t con tacts in D ublin, by p rim ary d ru g , 1990 to 1995
(O ’B rien & M oran 1998)... 22
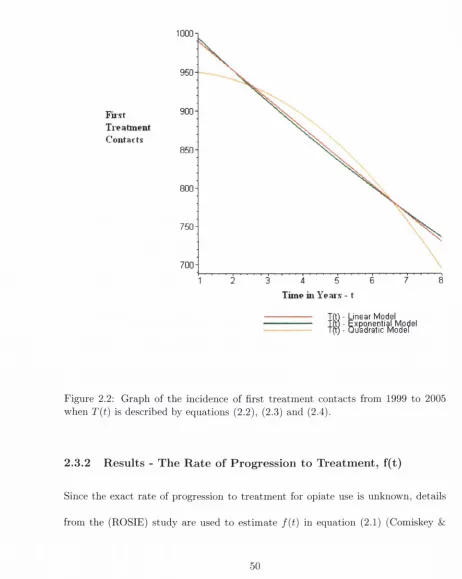
2.1 O bserved n um ber of first tre a tm e n ts of o p iate use from 1999 to 2005. Source: p riv ate com m unication. D r Jea n Long, H ealth R esearch B oard, Spring 2009... 47 2.2 G ra p h of th e incidence of first tre a tm e n t co n tac ts from 1999 to 2005
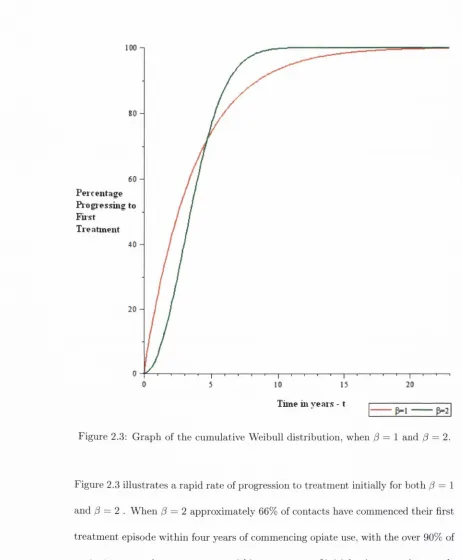
w hen T{t ) is described by eq uations (2.2), (2.3) an d (2.4)... 50 2.3 G rap h of th e cum ulative W eibull d istrib u tio n , w hen /? = 1 an d — 2. 52 2.4 Incidence of u n tre a te d o p iate use in Ireland from 1999 to 2005, w hen
T( t ) is described by eq u atio n (2.2) and f { t ) is m odelled using th e W eibull d istrib u tio n , eq u atio n (2.6)... 56 2.5 Incidence of u n tre a te d o p iate use in Ireland from 1999 to 2005, w hen
3.1 G am m a probability density w ith shape param eter, a = 2, a = 3 and
a — 4 and scale A = 1... 66 3.2 Weibull probability density curve w ith shape param eter, ^ — 2 ,0 = 3
and 13 — 4 and scale, p = 1... 68 3.3 Observed first treatm ent contacts in Ireland 1999 to 2005, correspond
ing to < = 1 to t = 7... 73
3.4 Relative frequencies of tim es to first treatm ent for opiate use in Ire
land, 1999-2005... 75 3.5 Cum ulative frequencies of times to first treatm ent for opiate use in
Ireland, 1999-2005... 76 3.6 Weibull probability plot - least squares m ethod... 78 3.7 Weibull probability plot - maximum likelihood m eth od... 79
3.8 Observed cimiulative frequencies of times to first treatm ent for opiate use and cumulative Weibull probability distribution fitted to d ata on
tim es to first treatm ent for opiate use... 80 3.9 Observed cumulative frequencies of times to first treatm ent for opiate
use and cumulative Gam ma probability distribution fitted to d ata on times to first treatm ent for opiate use... 81
List o f Tables
1.1 All treatm ent contacts in Dublin, by primary drug, 1990 to 1995 O’Brien & Moran (1998)... 21 1.2 Treatment contacts presenting with opiates as their main problem
drug of misuse. Source: O’Gorman (1998, p. 160)... 24
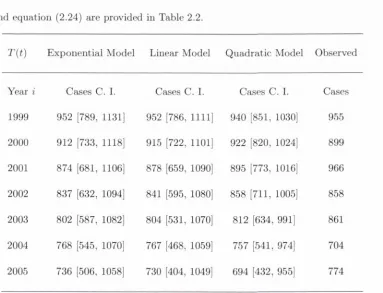
2.1 Parameter estimates of T(t) with standard errors (Std. Error). . . . 48 2.2 Ti, expected annual incidence of first treatm ent contacts with 95%
confidence intervals when the parameters in Table 2.1, with equations (2.2), (2.3) and (2.4) substituted into equation (2.24)... 49 2.3 Ui, expected annual incidence of hidden, untreated opiate use, with
95% confidence intervals, for F (l, 0.27) and a;(l,0.27) and T{t) as in equations (2.2), (2.3) and (2.4)... 54 2.4 Ui expected annual incidence of hidden, untreated opiate use, with
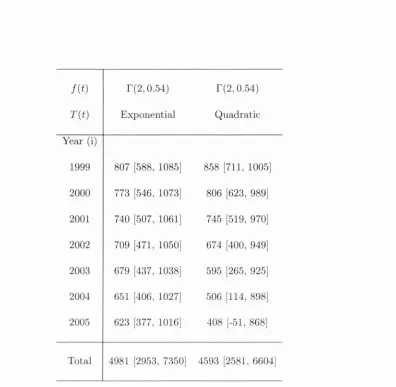
95% confidence intervals, for F(2,0.54) and T{t), as in equations (2.2) and (2.4)... 55 2.5 Expected annual incidence of hidden, untreated opiate use, for uj{2, 0.24)
and T{t), as in equations (2.2) and (2.4)... 58
3.2 The mean num ber of years using opiates before progressing to first
tre a tm e n t... 74
4.1 Param eter estim ates of (7(t) in equation (4.24), (4.35), (4.63) . . . . 96 4.2 Expected annual incidence of hidden, untreated opiate use with 95%
confidence interval, T{t ) exponential equation (4.12)... 97 4.3 Expected annual incidence of hidden, untreated opiate use with 95%
confidence interval, T{t ) linear equation (4.26)... 98 4.4 Expected annual incidence of hidden, untreated opiate use w ith 95%
confidence interval, T{t ) quadratic equation (4.37)... 99
5.1 Models for the incidence known of first treatm ent contacts, T{u) . . 119 5.2 Estim ates of the Prevalence of Problem atic O piate Use in Ireland in
2006, using equation (5.2), for the three cases of T{u) in equations (5.3), (5.4) and (5.5) and P{t) in equations (5.9), (5.15), (5.20), (5.10), (5.21), (5.14), (5.19) and (5.25)... 121 5.3 Sum mary of published prevalence estim ates... 122
6.1 Cases presenting for treatm ent for opiate-use in Ireland 2003-2007, by known treatm ent status. Source: Alcohol and Drug Research Unit of
the Health Research Board (2009) 135
6.2 Total number of cases presenting for treatm ent for opiate-use in Ire land 2003-2007. Source: Alcohol and Drug Research Unit of the
Health Research Board (2009)... 137 6.3 Estim ates of all opiate use in Ireland in 2006 from Table 5.2 with
A cknow ledgm ents
This research was funded by the Health Research Board (HRB), under grant num ber HSR/2005/150 and then subsequently by a Ph.D . student stipend at School of Nursing and Midwifery, Trinity College Dublin.
F irstly I would like to take this opportunity to thank my supervisor. Prof. C atherine Comiskey. Her support, encouragement, and tim e throughout the course of my Ph.D. are much appreciated. The enthusiasm she has for her research was motivational at times when the Ph.D. process was difficult.
Many thanks to Dr. Conor Houghton for his advice on C + + and to Dr. C ather ine Hurley for sharing her expertise on the statistical package M initab. I am grateful to Dr. Em m a W hite for her words of wisdom and for sharing details of her expe rience in pursuit of her Ph.D . Thanks to my colleagues and friends a t the School of Nursing and Midwifery, Trinity College Dublin, pgirticularly Em m a and Anne for interesting discussion!!
C hapter 1
In trod u ction to M ath em atical
M od elling and P rob lem D rug
1.1
T h esis In tro d u ctio n and A im s
resources.
According to Bailey (1975) understanding the nature of epidemic processes as sists the prevention of infectious disease. Brauer (2009) acknowledges th a t the fol lowing questions would be of interest to public health physicians when faced with an epidemic:
• How severe will the epidemic be?
• How many individuals will be affected and require treatm ent?
• W hat is the maximum num ber of individuals th a t will require treatm ent at any time?
This is also true of the drug use epidemic, if epidemiologists, health care providers and those responsible for resource allocation have an understanding of the nature of the drug use epidemic, more informed decisions regarding prevention and interven tion could be made. Thus the objective of this study is to further develop and apply established m athem atical techniques for the first tim e to the problem of estim ating the prevalence and incidence of opiate use and to develop and implement existing m athem atical models to the very real and longstanding problem of modelling the geographical spread of opiate use.
1.1.1
T hesis O u tlin e
This chapter outlines the history and applications of m athem atical modelling in relation to infectious disease to date. It also gives an overview of the history of
modelling in relation to drug use is outlined. The specific aim of this chapter is to outline the history of the existing m athem atical techniques used in modelling epidemics and to provide a background to the opiate epidemic in the Irish setting. In order to fulfill this aim we look at:
• The modelling process and w hat an appropriate model m ust include.
• How m athem atical modelling in epidemiology has evolved in an effort to pro vide a general understanding of existing techniques which may be applied to the problem of estim ating the size of the opiate epidemic in Ireland.
• Models used in AIDS epidemiology, particularly integral equations, due to the well documented association between AIDS and opiate use.
• The background to illicit drug use, specifically opiate use and drug policy in the Irish setting, in order to establish how patterns of drug use have evolved to date.
• M athem atical models which have previously been applied to substance misuse.
in tro d u ce d in earlier ch ap ters, are im plem ented to produce m ore refined incidence estim ates in C h a p te r 4. In C h a p te r 5 integral equations are applied to th e problem of estim atin g th e prevalence of u n tre a te d o p iate use in Ireland. C h a p te r 6 looks a t developing an d im plem enting differential equations for describing th e geographic sp read of illegal o p iate use in a p o p u latio n as a function of tim e. N um erical sim u lations are th e n perform ed using p aram eters e stim ated from Irish d a ta . C h a p te r 7 sum m arises th e research conducted in th is stu d y w ith conclusions and suggestions of fu tu re work.
1.2
T h e M o d ellin g P ro c ess
1. Identify Problenfi
6. Validate M odel
2. M ake Assunnptions
4 . Solve Equations 5. Interpret
Results
3. Form ulate Equations
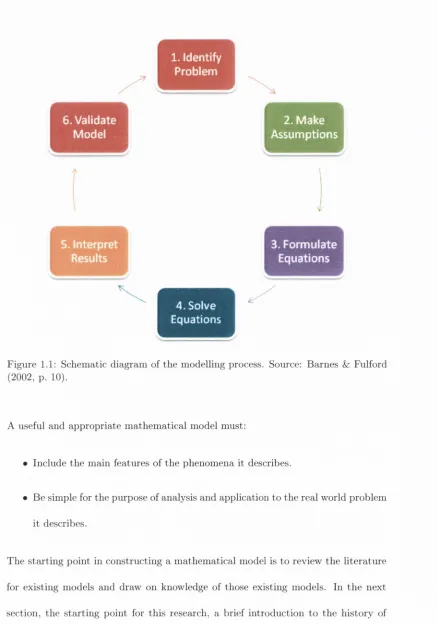
Figure 1.1: Schematic diagram of the modelhng process. Source: Barnes & Fulford (20 0 2, p. 10).
A useful and appropriate m athem atical model must:
• Include the main features of the phenomena it describes.
• Be simple for the purpose of analysis and application to the real world problem it describes.
The starting point in constructing a m athem atical model is to review the literature
[image:22.524.48.486.71.695.2]1.3
In tr o d u c tio n to M a th em a tic a l M o d ellin g in
E p id em io lo g y
M athem atical and statistical modelling of epidemics has a long and extensive his tory with modelling in population biology dating at least as far back as the 17th century. M odellers in the past have focused their research on modelling the spread of epidemics such as measles, m alaria, Tuberculosis (TB), Human Immunodeficiency Virus (HIV) and Acquired Immune Deficiency Syndrome (AIDS) and Severe Acute Respiratory Syndrome (SARS) (Kermack & Me Kendrick 1927, Ross 1911, Bailey 1975, Anderson & May 1991, M urray 2003b, D epartm ent of Health and Social Se curity 1988).
The first records of epidemic outbreaks can be dated back at least as far as ancient Greeks w ith Epidemics of Hippocrates (459-377 B.C.)(Bailey 1975). M athem atical and statistical models originated in early medical statistics when G raunt and P etty first studied the London Bills of M ortality in the 17th century. Bailey noted th a t progress was slow and the next record of m athem atical modelling in relation to disease was in the 18th century (Bailey 1975). In 1766, the m athem atician Daniel Bernoulli used a m athem atical m ethod to evaluate the eff'ectiveness of the variolation technique in a bid to produce immunity to the small pox disease. This was followed by Snow’s study on the tem poral and spatial p a tte rn of cholera cases which enabled him to dem onstrate th a t the disease was spread by the contam ination of w ater supplies (Snow 1855).
and then using the fitted curve to predict future outcomes or to predict outcomes
where d a ta was unavailable. Farr (1840), as cited by (Bailey 1975) applied curve
fitting techniques to d ata on small pox related deaths and later attem p ted to use
a similar m ethod to predict the course of an outbreak of rinderpest, also known as
cattle plague, amongst cattle. Brownlee went on to conduct more in-depth studies
of curve fitting to epidemic data, fitting various Pearsons curves to a wide range of
diseases (Bailey 1975). Barnes & Fulford (2002) described empirical models as one
of the most basic modelling techniques, however they discuss a lack of confidence in
the applicability of the fitted curve outside the range of the d a ta as a lim itation of
this kind of model.
According to Bailey, by the 1900’s the growing availability of m ortality statistics
illustrated the problems facing public health authorities and more suitable models
for more exact m athem atical investigation were suggested due to breakthroughs
in bacteriology. Perhaps this explains why early developments in m athem atical
modelling of infectious disease and the groundwork of the approach to epidemiology,
based on com partm ental models were made by public health physicians such as Sir
Ross, R.A., W.H. Hamer, A.G. Me Kendrick and W .O. Kermack between 1900 and
1935 (Brauer 2009).
Originally the vgist m ajority of work on communicable diseases was determ inistic
in character. Determ inistic models have no random ness involved in the future devel
opment of future states of the system and therefore produce the same o u tp u t for a
given starting condition. In 1906, Hamer introduced the ‘mass action principle’, the
basis of all determ inistic theories when he considered th a t the course of an epidemic
worked on form ulating a m athem atical model for the diffusion of malaria. He used a continuous-time framework of the ‘mass action principle’ in his work on the dynam ics of m alaria in 1908 (Ross 1911). In 1902 Ross was awarded the Nobel Prize in medicine and was knighted in 1911 for his groimd breaking work on the transm ission of malaria. The concepts of birth rates, death rates, attack rates and recovery rates were introduced to determ inistic models by Ross in 1911.
Kermack and Me Kendrick form ulated a simple com partm ental model which was useful in predicting the behavior of outbrealcs in their paper, “C ontributions to the M athem atical Theory of Epidemics” , which was published in 1927 (Brauer & Castillo-Chavez 2001). A com partm ental or determ inistic model involves assign ing individuals in a population to different com partm ents which represent different stages of an epidemic. Kermack and Me Kendrick produced a model w ith three com partm ents, S{t), I{t) and R{t), is illustrated as;
Susceptibles, S(t) — ^ Infected, I(t) — ^ Recovered, R(t)
where;
• S{t) is the number of individuals susceptible to a disease, in a population at tim e t.
• I{t) is the number of infected individuals capable of transm itting the disease a t tim e t to those individuals in the susceptible sub-group.
Tliroughout the history of m athem atical epidemiology' one of the most significant contributions was Kermack and Me Kendrick’s Threshold Theorem. The Thresh old Theorem states th a t the introduction of infectious cases into a community of susceptibles would not result in an epidemic outbreak if the density of suscepti- bles was below a certain critical value. Soper (1929) carried out more deterministic work focusing on measles, using difference equations which were very similar to the differential equations of other researchers.
One of the first stochastic models, published by Me Kendrick was a “eontinuous- infeetion” model (Bailey 1975), which involved an individual being infectious from the moment of infection until recovery, isolation or death. Stoclijistic models were considered as they take account of the probability aspects of a process. The nature and progression of diseases vary, particularly for new strains of diseases, therefore models for the future evolution of disease were described using probability distribu tions. The probability distribution models which accounted for the variable nature of disease progression were considered to provide a more realistic illustration of epi demics. Despite Me K endrick’s work on the “continuous-infection” model it wasn’t until the early 1940’s th a t developments in the more complex stochastic processes were considered when modelling infectious diseases.
th a t a more reahstic picture of a recurrent epidemic could be achieved by adopting a stochastic process. By the mid 1980’s many determ inistic and stochastic models to
describe the immune system and its interaction w ith HIV existed (M urray 2003a). Prior to 1957 a review of the history of m athem atical epidemiology was non existent until the first edition of Baileys classic text, “The M athem atical Theory of Infectious Diseeises and its Applications” was published (Bailey 1975). At the time there were approxim ately 100 references to m athem atical work in the literature and th a t had increased to 200 when Dietz published the review paper, “Epidemics and Rumours: A Survey” in 1967 Bailey (1975). Bailey states there was approxim ately 500 references when the second and final edition of “The M athem atical Theory of Infectious Diseases and its Applications” was published in 1975 further illustrating the growing trend in literature concerned w ith m athem atical epidemiology. T he text “Infectious Diseases of Hum ans” was published by Anderson & May (1991) with the prim ary aim of illustrating how simple m athem atical models could be used to interpret observed trends in epidemiology. The text “M athem atical Epidemiology of Infectious Diseases” which covers both stochastic and determ inistic modelling, was published by Diekmann & Heesterbeek (2000).
After reviewing some of the existing literature on the history of m athem atical modelling in epidemiology, armed w ith an awareness of the different types of models used, the literature was examined w ith a view to drawing on previous researchers’ tried and tested work in a bid to derive or develop and implement m athem atical m od els for problem drug use, specifically opiate use. It was decided th a t m athem atical
op iate use.
Individuals are in itiate d to o p iate use th ro u g h co n tac t w ith o th e r o p iate users, th is is sim ilar to th e transm ission of som e infectious diseases, such as b ac te rial m enin gitis, influenza, tuberculosis, im petigo and syphilis, which are all spread th ro u g h co n tact w ith infected individuals. M ossong et al. (2008) found th a t th e m ixing p a t te rn and co n tact ch aracteristics of an individual were relevant to th e spread of an infectious disease. Similarly, C auilkins (2001) describes a “social contagion” m odel of recru itm en t to dru g use, w hereby friends w ho are c u rren t d ru g users in itiate friends to drug use.
A tra it which is com m on to som e infectious diseases an d o piate use is th e hidden n a tu re of both. M any individuals infected w ith a disease p artic u la rly sexually tra n s m itte d diseases like chlam ydia, hum an papillom avirus an d HIV are unaw are they are infected w ith the disease as th ey rem ain asy m p to m atic for a long tim e (E ng &: B u tle r 1997). As o piate use is an illegal ac tiv ity an o p iate user rem ains “hid d en ” from in itiatio n to o piate use until presenting for first tre a tm e n t or com ing to th e a tte n tio n of au th o rities for d rug related offences.
sharing and unsafe sexual practices.
The following section gives a brief outline of integral equations and introduces integral equation models from infectious disease epidemiology which could be applied to modelling the prevalence, incidence and geographical spread of opiate use.
1.4
M o d els
Integral equations have previously been used in epidemiology to model infectious diseases such as AIDS, Tuberculosis and smallpox (Isham 1989, Salpeter & Salpeter 1998, Aldis & Roberts 2005). Integral equation models are of interest for this re search due to their extensive use in AIDS epidemiology. Models from AIDS epidemi ology are considered to model and estimate the true size of the opiate epidemic. The association between AIDS and injecting drug use is well documented. According to the United Nations Office on Drugs and Crime (2007) injecting drug users, particu larly opiate users are at risk of contracting infectious diseases such as HIV/AIDS. A similarity of opiate use and the HIV infection is the hidden nature of both. Opiate use is a hidden activity from onset of use until treatm ent is requested, similarly HIV is hidden from initial infection until AIDS diagnosis is reported. An integral equa tion model from AIDS epidemiology which is the foundation model for this research on estimating the true size of the opiate epidemic is the back calculation model.
The Romanian mathematician Traian Lalescu (1882-1929) famous for his work on integral equations earned his Ph.D. in Mathematics from the University of Paris in 1908. Lalescu published the first book ever on the subject of integral equations, “Introduction to the Theory of Integral Equations” in 1911.
under an integral sign, an example of a general integral equation in u{x) is
u{x) = f { x ) +
J
K[ x , t ) u{ t ) dt,where K{ x , t) is the kernel of the integral equation which is a function of two vari ables. According to Anselone & Nashed (1988) integral equations can be broadly
classified into the following categories;
• Integrodifferential equations which contain both derivatives and integrals of an unknown function.
• Integral transform s which m ap an equation from its original domain into an other target dom ain which is easier to m anipulate and solve than the original equation. The solution is then m apped back to the original domain with the inverse of th e integral transform .
• Stochastic integral equations are integral equations in which one or more of the term s is a stochastic process.
• Singular integral equations are integral equations th a t have a singular kernel within the range of integration or if one or both of the limits of integration are infinite.
• Volterra integral equations are integral equations which have one variable limit of integration. These equations have previously used in demography.
• Fredholm integral equations are integral equations which have fixed limits of integration.
• the problem of forecasting hum an population,
• the study of population dynamics such as surges in the birth rate,
• the propagation of stocked fish in a new lake,
to name but a few (Jerri 1999). Many integral equations, such as the equations to formulate the problems mentioned above can be classified into two main categories which are called Fredholm integral equations or Volterra integral equations. Fred- holm and Volterra integral equations can be further classified as equations of the “first kind” or the “second kind” . An equation is determined to be of the “first kind” if the unknown function appears only under the integral sign, however if the unknown function appejirs both inside and outside the integral sign an equation is said to be of the second kind. An example of each type of equation will be given below. Take u{t) to be an unknown function to be solved for, f { x ) is a given, known function and K{ x , t ) is a known integral kernel. Then a Fredholm integral equation of the first kind can be expressed as:
where a and b are th e fixed limits of integration. A Fredholm integral equation of the second kind can then be given as:
and a Volterra equation of the second kind is expressed by:
u{x) = f { x ) + [ K{ x , t ) u{ t ) dt
The im portance of an integral equation stem s from representing hereditary situa tions. An integral equation relates the present state of u{t) to the accumulation of changes in its previous values from tim e, i = 0 to present tim e t = t (Jerri 1985).
The back calculation model from AIDS epidemiology is an integral equation of the first kind and is expressed as:
where a{t) is the new AIDS diagnosis, /(<) is the known incubation period distri bution and h{t) is the unknown incidence of HIV infections for which AIDS will eventually be diagnosed (Isham 1989). E quation (1.1) has a variable limit of inte gration and the unknown function only appears under the integral sign therefore the back calculation model is a Volterra integral equation of the first kind. In chapter 2 and 4 the back calculation model in AIDS epidemiology will be described in detail, its potential as a model to estim ate the incidence of opiate use will be discussed, analytical solutions will be produced and estim ates of the hidden incidence of opiate use will be obtained.
1.5
H isto rica l B ack grou n d to D ru g U se
to O ’Kelly (2000) world governm ents a tte m p te d to control o p iate use d u rin g th e 19th cen tu ry as a result of th e following factors:
• An em erging grow th in professionalism in th e p h arm a ceu tica l and m edical disciplines.
• An aw areness of th e problem of m orphine addiction.
• R ecognition am ong socially concerned groups of th e im plications of th e avail ability and use of different forms of opiates.
1.5.1 B a ck g ro u n d to Illeg a l D r u g U s e in Irela n d
P rio r to 1969, th ere was a com plete lack of d a ta regarding problem d ru g use in Ireland. In 1969 a stu d y was conducted on b eh a lf of th e M edico-Social R esearch B oard, th e aim of th e stu d y was to investigate problem dru g use am ong young people in D ubhn (M asterson 1970). D ean et al. (1985) found th a t d rug use occurred across all social classes an d n oted th a t ignorance of th e dangers concerning d ru g use was a com m on factor in users across all social classes.
de-sp ite th e reduction in use of these drugs th ere was a num ber of doses of b o th drugs seized by th e G a rd ai (th e Irish pohce force) due to availabihty on th e black m arket.
T here have been significant changes in th e p a tte rn s of cocaine use an d availabil ity in Ireland from th e 1980’s to th e p resen t day. In th e eighties, cocaine was an extrem ely expensive d ru g an d tended to be used by higher social econom ic sections of society (C orrigan 1994). D espite th e significant re d u ctio n in th e p ro d u c tio n of cocaine, it has becom e m ore readily available an d less expensive in E u ro p e due to increased p ro d u c tio n in C olum bia. T h e price of cocaine has reduced d ra stica lly in Ireland, from € 1 0 2 p e r g ram (M oran et al. 2001) to € 6 0 to € 8 0 p e r g ram in 2009 (B racken 2009). W h ilst opiates ten d to b e th e m ost p o p u lar d ru g of m isuse th ere seems to be an association betw een cocaine use and o p iate use, in th a t o p ia te users ten d to use cocaine as an ad d itio n al d ru g (Bellerose et al. 2009, N a tio n al A dvisory C o m m ittee on D rugs 2007). T his connection m ay be explained by th e fact th a t cocaine reduces th e severity of o piate w ith d raw al (O ’C onnor 1991).
D uring th e five year p erio d from 1998 to 2002, 2,668 of th e individuals presenting of tre a tm e n t used opiates as th e ir m ain problem d ru g w hilst using ad d itio n al drugs (Long et al. 2005). O ver one fifth of those individuals were also using cocaine, com pared to only 167 individuals w ith a problem of p o ly d ru g use, using cocaine as th e ir m ain problem drug. D uring th e sam e tim e period, tre a tm e n t d em an d for cocaine use also increased dram atically. Seventy-eight individuals re p o rte d cocaine as th e ir m ain problem d ru g to th e N a tio n al D rug T re a tm e n t R ep o rtin g S ystem in 1998; th is num ber h a d m ore th a n treb led by 2002 w hen cocaine was re p o rte d as the
below.
□ Ali_Cases
□ Previously_Treated_Cases □ New_Treatm ent_Cases
1998 1999 2000 2001 2002T
Year
F igure 1.2: C ocaine as th e m ain problem d ru g of m isuse by tre a tm e n t sta tu s, 1998 to 2002 (Long et al. 2005).
[image:36.524.46.501.49.530.2]In spite of these substantial cocaine seizures it is believed th a t approxim ately 540 out of a possible 1,000 tons of cocaine make it onto the black m arket each year (Corrigan 1994). The steady increase in positive post m ortem results and road safety tests in recent years are also indicative of the growing trend in cocaine use (National Advisory Com m ittee on Drugs 2007). The findings of increasing cocaine use in Ireland indicate consistency w ith the upward trend in cocaine use in Europe N ational Advisory Com m ittee on Drugs (2007).
Year 1990 1991 1992 1993 1994 1995
Drug % % % % % %
Heroin 39.3 37.0 37.9 48.3 55.7 70.6
Morphine Sulphate Tablet 33.0 30.6 26.8 22.5 18.5 10.6
M ethadone 1.4 3.0 3.9 5.0 4.4 3.8
Cocaine 0.8 0.4 0.4 0.7 0.3 0.3
Ecstasy 0.0 0.3 2.0 3.5 2.5 3.0
Benzodiazepines 3.0 3.1 2.0 1.2 0.7 1.8
LSD 0.4 0.6 1.3 1.7 1.4 0.8
Volatile Inhalants 2.4 2.2 2.3 1.1 0.7 0.4
Cannabis 11.5 12.6 14.1 10.4 10.1 6.6
O ther Drugs 8.0 10.3 9.1 5.6 5.6 2.2
Valid N 2021 2337 2546 2896 2970 3587
Total N 2036 2359 2555 2919 2978 3593
[image:38.524.50.458.45.520.2]8 0 .0
C 6 0 .0
I O 4 0 .0
-Gl 2 0
.0-0
.0-1990 1991 1992 1993 1994 1995
□ H e ro in □ m st □ M eth ad o n e □ Cocaine ■ Ecstacy B B enzodiazepines □ LSD
Q Volatile_lnhalants □ can n ab is B O th er_ D ru g s
[image:39.524.69.471.32.517.2]Year
Figure 1.3: All treatm ent contacts in Dublin, by prim ary drug, 1990 to 1995 (O ’Brien & Moran 1998).
1.5.2
B ackground to P ro b lem O piate U se in Ireland
O piate use in Ireland dates back a t least as far as 1844, when Dr Francis R ynd (1845, p. 167) first described a m ethod of instilling “A solution of fifteen grains of acetate of m orphine by using an instrum ent made for the purpose.” Following on from this the hypoderm ic syringe was developed in Edinburgh in the 1840s. T he details of the preparation of the m orphia from Turkish opiiun were first published in the Dublin Pharm acopeia in 1850. The medical community in Ireland was increasingly concerncd w ith the problem of morphine addiction and Dr. H.C. Drury addressed the Royal Academy of Medicine to discuss morphine addiction in 1899. D rury discussed the problem s linked to free use of morphine and noted th a t these problems were particularly prevalent among the medical profession.
of increasing heroin seizures between 1980 and 1986 led to the misuse of synthetic opiates such as buprenorphine and morphine (Gordon 1995).
The percentage of first treatm ents and all treatm ents th a t used opiates as their prim ary drug fluctuated between 1990 and 1995, yet there was an overall p a tte rn of increasing treatm ent dem and for opiate use. The lowest proportion of individuals seeking treatm ent for opiate use was made in 1993, with approxim ately 75% of all treatm ent and 49% of first treatm ent sought by clients with opiates as their prim ary drug of misuse. The proportion of treatm ent contacts presenting w ith opiates as the prim ary drug of misuse is illustrated in Table 1.2 below.
Year
All Treatm ents Total ( % )
First Treatm ent Total (% )
1990 2037 (79.2) 624 (60.3) 1991 2359 (77.7) 450 (49.6) 1992 2555 (75.1) 668 (48.5) 1993 2919 (79.1) 859 (64.1) 1994 2978 (82.1) 1150 (74.3) 1995 3593 (86.8) 1396 (77.2)
Table 1.2: T reatm ent contacts presenting with opiates as their m ain problem drug of misuse. Source: O ’G orm an (1998, p. 160).
tre a tm e n t for all d ru g use, including opiate use is recorded, th e first estim ates of th e prevalence of o p iate use in D ublin were p roduced by Com iskey & B arry (2001). Com iskey & B arry (2001) estim ated th ere were 13,460 o p iate users in D ubhn which was over th ree tim es m ore th a n th e figure of 3,840 recorded by th e N ational D rug T re a tm e n t R ep o rtin g S ystem as using opiates as th e ir m ain dru g of misuse. Prom 1998 to 2002 th e n u m b er of new cases a tte n d in g for tre a tm e n t sta tin g opiates as th e m ain dru g of m isuse declined however in th e sam e tim e perio d th e num ber of all cases presenting for tre a tm e n t w ith opiates as th e p rim ary d ru g of m isuse rose from 4,479 to 5,742 (Long et al. 2005). Kelly et al. (2003) pro d u ced th e first n atio n al prevalence figures for o p iate use for Ireland for 2000 an d 2001. Kelly et al. (2003) suggests figures of 14,158 and 14,452 as th e e stim ated prevalence of o p iate users for th e whole of Irelan d for 2000 and 2001 respectively. T hese figures were fu rth e r broken down to suggest p o in t estim ates of 12,268 and 12,456 for D ublin for 2000 an d 2001 respectively.
1U0% increase in o piate use in Offaly an d Longford betw een 2004 an d 2007 (Lyons et al 2010). T h e re p o rt also found th a t th e re were excessively long w aiting lists for o p iate users accessing tre a tm e n t such as th e m eth ad o n e m ain ten an c e program and a to ta l lack of residential abstinence and re h ab ilitatio n facilities in th e M idland R egional D rugs Task Force region.
It is evident th a t th e problem of illicit d ru g use in Ireland has escalated in th e last forty years an d w h a t was once a problem m ainly in th e D ublin area has now sp read nationw ide. However it is im p erativ e to note th a t illicit d ru g use is recognised as a problem an d th e following sections d ocum ent th e h isto ry of d ru g tre a tm e n t policy and legal policies im plem ented in a bid to tackle th is problem in Ireland.
1.5 .3 H is to r y o f Irish D r u g P o lic y Treatm ent Policy
For th e p u rp o se of th is work we use th e N ational D rug T re a tm e n t R ep o rtin g S y ste m ’s definition of tre a tm e n t. T re atm en t is defined as any ac tiv ity w hich aim s to im prove th e psychological, m edical or social s ta te of individuals who seek help for th e ir drug problem (Alcohol an d D rug R esearch U nit of th e H ealth R esearch B oard 2007). M edication free th erap ies an d m edically assisted tre a tm e n t are th e tw o principles on w hich tre a tm e n t services are bu ilt. M edically assisted tre a tm e n t options include detoxification, m eth ad o n e re d u ctio n an d su b stitu tio n program m es while counselling, group th e ra p y an d psychotherapy are exam ples of m edication free th era p ies (Alcohol
and D ru g R esearch U nit of th e H ealth R esearch B oard 2007).
T re a tm e n t services can be fu rth e r classified, w ith som e services providing an ab stinence based approach an d o th ers co n cen tratin g on a h arm re d u ctio n approach.
free lifestyle by providing psychological su p p o rt an d a stru c tu re d schedule of daily activ ities which clients m ust a tte n d (Com iskey et al. 2009). A bstinence based tr e a t m ent is available in an in p a tie n t se ttin g know n as residential re h a b ilita tio n and an o u tp a tie n t se ttin g know n as s tru c tu re d day program m es. Up to th e la te 1980’s d ru g policy was d o m in ated by abstinence approaches which were ad o p ted by th e C oolm ine T h e ra p e u tic C om m unity an d T rin ity C o u rt (C ullen 1994). However as a re su lt of th e grow ing HIV problem in th e m id 1980’s in Ireland th e needle exchange program m e, a h arm re d u ctio n service, was established.
In 1989 five needle exchanges were set up to provide sterile injecting equipm ent an d m aterials such as sterile w ater and sw abs (Alcohol an d D rug R esearch U nit of th e H ealth R esearch B oard 2008b). A ccording to Cox & R obinson (2008) th e th ree m ain objectives of th e needle exchange pro g ram m e where;
• To reduce th e prevalence of blood b o rn e viruses.
• To ed u cate d ru g users of th e risks associated w ith injecting d ru g use a n d unsafe sexual practices.
• To engage w ith injecting drug users an d refer th em on to tre a tm e n t services.
In 2008 th ere were th irty four needle exchanges o p eratin g in Irelan d consisting of fixed-site exchanges, hom e visit exchanges an d exchanges in public locations. A ccording to Cox & R obinson (2008) needle exchanges have co n trib u te d to low or reduced spread of H IV am ong injecting dru g users, reduced levels of needle sharin g an d individuals in m ain tain in g low levels of risk.
detoxification is available in both in-patient and out-patient facilities. M ethadone
is the most commonly used agent for opioid detoxification in Ireland. This form
of detoxification, known as m ethadone reduction, is where an individual is given
gradually reducing doses of m ethadone usually over a four to twelve week period
until the individual is opiate-free.
Substitution treatm ent is a medically supervised form of drug treatm ent used
in Ireland. This treatm ent is provided by treatm ent centres, satellite clinics and
G P ’s. M ethadone, introduced in 1992, buprenorphine, introduced in 2002 and the
buprenorphine/naloxene, combination introduced in 2007 are all agents used for
opiate substitution treatm ent. M ethadone m aintenance was established as a harm
reduction service and is the most commonly used agent for heroin and other opiate
substitution treatm ent. The Central Treatm ent List (CTL) was established in 1993
to regulate and control the dispensing of m ethadone (D epartm ent of H ealth and
Children 2005). The Central Treatm ent List is a register of all clients receiving
m ethadone as treatm ent for problem opiate use in Ireland and insures th a t clients
can obtain there methadone from one source only.
Legal P o lic y
Although world governments initially recognised th a t illegal opiate use was a problem
in the nineteenth century and procedures were implemented to control illegal opiate
use, Irish drug policy did not originate until the 1960’s. Prior to the 1970’s the
general consensus was th a t Ireland had managed to avoid a serious drug problem,
it was however accepted th a t unless a constant effort was m aintained to prevent the
abuse of habit forming drugs, a serious drug problem would be inevitable (M asterson
would be im m inent, policies and procedures, which would go on to be developed and improved, were implem ented in an effort to control problem drug use.
In the latte r half of the 1960’s there was a dram atic increase in the numbers appearing before th e courts on drug related charges, from only one individual ap pearing in 1965 to fifty four individuals appearing before the courts by O ctober 1969 (M asterson 1970). Although a serious drug problem had not yet developed, the G arda drug squad was established in 1968 in response to a growing awareness of drug misuse am ong the public. A year later the first statu to ry outpatient drug treatm ent facility, the National Advisory and Treatm ent Centre was founded at Jervis Street Hospital in Dublin. Despite growing public awareness of problem drug use, progress with regard to legislation was slow, as the Misuse of Drugs Act, which provided a wide variety of controls over drugs susceptible to misuse was not passed until 1977.
In a bid to tackle the increasing problem of drug use, existing legislation was updated, new legislation was passed and new task forces were established. The Road Traffic A ct was amended in 1978 to include driving under the influence of an intoxicant, which is defined as drugs or alcohol, which renders the ability to control the vehicle as an offence. A special Government Task Force was launched in the D epartm ent of H ealth in 1983. Although th e task force report was not published it resulted in the enactm ent of The Misuse of Drugs Act (1984), which prevented the printing or sale of magazines or books which prom oted the use of drugs or advertised
for individuals accused of d ru g trafficking charges to be detain ed for u p to seven
days and also allow th e co u rts to draw inferences from th e failure of th e accused
to m ention p a rtic u la r facts d u rin g questioning. T h e C rim inal A ssets B u rea u was
launched in 1996 was to identify and confiscate crim inally o b tain ed assets. T hese
assets are confiscated tlu'ough th e application of th e Proceeds of C rim e A ct, 1996
w hich allows for freezing and rem oval of th e proceeds of crim e (M oran et al. 2001). T h e am en d m en ts to existing policies an d th e establishm ent of new task forces
discussed, d e m o n stra te policy m akers co m m itm ent to controlling th e illegal use of
drugs. Irrespective of this, dru g use continues to be a problem an d som e m odelling
has been done on problem d ru g use which will be discussed fu rth e r in th e next
section.
1,6
M a th em a tic a l M o d ellin g and Illegal D ru g U se
In sp ite of th e body of research on th e m a th em atica l m odelling of epidem ics little
has been done to apply th e m odels to th e w orldw ide problem of increasing and
expanding su b stan ce misuse. B obashev et al. (2007) discuss th e difficulties involved in applying m a th e m a tic a l m odels in dru g use research, nam ely th e availability of
reliable d a ta an d th e absence of clear, long term m arkers of drug use.
H im t & C h am b ers (1976) were am ong th e first researchers to a tte m p t applying
m odels to th e d ru g use epidem ic in th e U nited S ta tes. Leon H unt an d C arl C h am
b e r’s book th e “H eroin E pidem ic’, in which th ey developed a th eo ry for th e spread
of d ru g use in a bid to e stim ate tren d s in incidence of drug use was p ublished in
1976. H u n t & C ham bers (1976) pioneering work focused on th e m icro-diffusion and
Micro-difTusion, how drug use spreads from individual to individual, depends on a dru g users ten d en c y to sp read d rug use to new users sim ilar to th e transm ission of com m unicable diseases. M acro-diffusion, how d ru g use spreads from region to region, describes th e geographical spread of d ru g use across boundaries. However as a result of criticism of th e proposed m ethods a t th e tim e th e re was no developm ent to th e m odels (H ickm an 2006). A lthough th e assum ptions and m eth o d s proposed by H u n t an d C h am b ers were proven no t to be correct by H ickm an et al. (2001), H ickm an (2006) acknow ledges th a t th ey were a useful sta rtin g p o in t and questions th e difference in progress to d a te had H unt and C ham bers insights been tsiken on b o ard a t th e tim e.
class and the infected class. It can be used to model a situation where susceptible individuals become infected, these individuals then recover and become susceptible again. An SIR com partm ental model has three classes, the susceptible class, the infected class and the recovered classed. The SIR model can be used to represent a situation where the susceptible individuals become infected, recover and become immune. The conclusions drawn from the model analysis are th a t the spread of infectious disease epidemic is related to the hidden part of the drug users career and therefore the objective of intervention should be to reduce the length of the latency period of the drug using career, where the latency period is the hidden part of the drug-using career.
The EMCDDA (2001) suggest th a t modelhng based on m athem atical theory is a useful tool to estim ate the prevalence and incidence of opiate use or to aid un derstanding of drug processes. T he EMCDUA (2001) reiterate the fact th a t little has been done to apply m athem atical models to drug-use epidemiology. It published the monograph “M odelling Drug Use: M ethods to Quantify and U nderstand Hidden Processes” which suggests models to estim ate prevalence and incidence of opiate use such as the back calculation model, com partm ental models, which were discussed briefly in previous sections, m ultiple indicator m ethods, dynamic models and struc tu ra l equations. The m ultiple indicator m ethod is a prevalence estim ation technique which can be applied to the problem of estim ating the size of the opiate epidemic. This technique is discussed in detail along w ith the capture-recapture m ethod, the multi-source enum eration m ethod and the m ultiplier m ethod in chapter 5.
In more recent times, W hite & Comiskey (2007) identified a gap in knowledge with regard to the drug using career which they explain consists of initiation, habitual
use, treatm ent relapse cycle and recovery. The authors proposed a com partm ental model for the opiate using career and its param eters which is expressed by:
d S /3iUiS
dt ~ N '
dU, /3iC7i5 , (i3UiU2 , , , , , ,
dU2 /33[/iC/2 ,
(1.2)
where the param eters of the model are:
• 5: the num ber of susceptible individuals in the population.
• -): the num ber of individuals from the general population entering the suscep tible population.
• : the probability of becoming a drug user.
• U\'. the num ber of drug users not in treatm ent.
• N : the size of the to tal population.
• p: the proportion of drug users entering treatm ent.
• U2- th e num ber o f drug users in treatm ent.
• fi: th e natural d eath rate of the p opulation.
• a rem oval rate which includes drug related d eath o f a drug user n ot in treatm en t and recovery.
• ^2^ a rem oval rate which includes th e drug related d ea th of a drug user in treatm en t and successful recovery.
T he conclusion drawn from th e m odel analysis is th a t prevention is b etter th an cure, therefore it is more effective to prevent drug use th an to control drug use by increas ing the num bers accessing treatm en t. Work on m odelling drug use b o th nation ally and internationally is lim ited. T h e literature su ggests however th a t m odels for the purpose of estim a tin g th e true size of the epidem ic, the geographical spread and to provide a general understanding of th e epidem ic are essential.
infiu-enced an individuals initiation into drug use. It is widely believed th a t drug use is passed from generation to generation, an individual has a predisposition to abusing a particular drug, for example opiates, if their parents have struggled w ith addiction
to the same drug (Swan 1995). Another risk factor which increases vulnerability to opiate use is mixing patterns, non-drug users can be coerced into drug use by influ ential peers. A factor which is particularly relevant in the current economic climate is social deprivation, Greaves (2003) found people in areas w ith high levels of social and economic deprivation and m arginilisation are also more susceptible to drug use. Initiation to opiate use can be influenced by all of these factors, nevertheless, it is not practical to produce a m athem atical model which accounts for all of them.
M athem atical models which contain too m any different elements can be complex and are often difficult, sometimes even impossible to solve. Therefore it is more beneficial to keep models simple, as mentioned in section (1.2) on the modelling process and only include the most relevant factors for the estim ates required. The models for prevalence, incidence and geographic spread of opiate use will not have direct elements to account or the effect of social deprivation, however, the numbers and times to first treatm en t will be modelled allowing for changes as a result of cuts in funding, increased treatm ent demand and waiting times for treatm ent services.
1.7
D isc u ssio n and C on clu sion s
dif-ficult if not impossible to obtain. The fact th a t opiates are the prim ary drugs of misuse for treatm ent contacts at national and international level is well docum ented (United Nations Office on Drugs and Crime 2007), as is the num ber of treatm ent contacts for opiate use, yet there is still an identified gap in researchers’ and policy m akers’ knowledge with regard to the numbers being initiated to drugs (Behrens et al. 1999). As a result, the scope of decision-making for measures of prevention and intervention is severely limited. This thesis endeavours to produce models which will enable policy makers and service providers to anticipate the num ber of poten tial future treatm ent contacts for opiate use in a bid to tackle the very real problem of ongoing drug use and provide adequate treatm ent services.
1.8
C h ap ter S um m ary
C hapter 2
E stim atin g th e Incidence o f
H idden, U n treated O piate U se
2.1
In tr o d u ctio n
In a global climate of significant problem drug use, ongoing and widespread heroin use, the increase in cocaine use across all aspects of society and the increasing and illegal use of controlled drugs, the EMCDDA (2001) believe th a t one of the first questions to be addressed is to identify the scale of the problem. Illegal drug use is, by its nature, a hidden phenomenon and estim ates of the true size of the epidemic are difficult to obtain, however policy makers and service providers are particularly interested in this estim ate. For the purpose of this research, in c id e n c e is defined as the number of new cases of untreated opiate use in a defined population w ithin a specified time period and p re v a le n c e is defined as the to tal number of cases of opiate use in a given population at a designated tim e (Last 2001). W ith the exception of work by De Angelis et al. (2004) in England and Rava et al. (2001) in Italy, estim ates of the incidence of illegal drug use are very rare, yet viable cost effective m ethods to produce incidence estim ates are vital for the planning and provision of effective drug treatm ent services.
providers to allocate increasingly scarce resources accordingly, as these estim ates provide insight in the num ber of potential first treatm ent clients in the future. Illegal drug use is recognised as a problem worldwide, however according to United Nations Office on Drugs and Crime (2004) opiates continue to be the main problem drugs of
misuse at a global level, w ith this in mind, the specific aims of this chapter are:
• To derive a viable m ethod to produce current and regular estim ates of the incidence of untreated opiate use.
• To use the technique developed to estim ate for the first tim e the incidence of untreated opiate use in Ireland from 1999 to 2005.
2.2
M e th o d o lo g y
Previous use of the back calculation model to predict the incidence of disease, partic ularly AIDS, in the United States, U.K. and Ireland is well documented (Brookmeyer & Gail 1988, Brookmeyer & Damiano 1989, Ishani 1989, Comiskey & Ruskin 1992). W ithin the HIV and AIDS epidemiology the back calculation m ethod works on the premise th a t one can back calculate from the known reported AIDS cases, through the use of the known incubation period distribution, to provide an estim ate of the unknown and undiagnosed HIV cases. Hence w ith back calculation two of the three com ponents of the equation (2.1) below, T{t ), U{t) and f {t ) must be known. Us
ing the knowledge of the two known components, it is then possible to derive the third unknown component of the model from equation (2.1). Isham (1989) noted
The back calculation method has been constantly adapted to allow for changes in the components of the model and to account for reporting delays (Brookmeyer & Gail 1988, Brookmeyer & Damiano 1989, Isham 1989, Comiskey & Ruskin 1992,
Comiskey 2001) these enable researchers to produce better incidence estimates. The back calculation model may be expressed in the form.
where, in the substance use or opiate use application, T{t) is the known rate of new first treatment contacts for opiate use, U{t) is the rate of hidden, untreated opiate use, which is defined as opiate users who have never received any form of treatment for opiate use in the past and /(<) is the rate of progression to first treatment for opiate use. Using equation (2.1) the number of hidden opiate users can be estimated for a given year. By taking the known number of first treatm ent contacts for opiate use combined with published estimates of the average time to treatment it is possible to calculate the number of opiate users who have never been treated before, at a specified time.
(Comiskey & Hay 2001), were one of the first to propose the method of back calculation in this regard, suggesting that the approach used in estimating the hidden HIV incidence, could be applied to the problem of estimating the hidden untreated incidence of drug use from cases of known drug use.
The Empirical Bayesian back calculation approach was suggested as a method
to estimate the incidence of injecting drug use from data observed on drug users seeking treatment in Italy (Rossi 1999). However the lack of available data on the latency period distribution, that is the time from first heroin use to first treatment.
meant th a t it was impossible to dem onstrate the application of the m ethod to real national or international data. The m ethod was explored to estim ate long-term trends in injecting drug use in England, De Angelis et al. (2004) concluded th a t
while the m ethod was worthwhile, b e tte r information on overdose m ortality and cessation rates would improve the m ethod and make it more realistic.
W ithin this chapter the back calculation model (2.1) is adapted and analytically solved to obtain solution for the incidence of untreated drug use. In particular the model is applied specifically to the problem of opiate use. An opiate user is defined to be someone who has used an opiate such as heroin, il