Design, fabrication and optical characterization of Fabry-Pérot
tunable resonator based on microstructured Si and liquid crystal
Vladimir A. Tolmachev
a,b, Vasily A. Melnikov
b,
А
nna V. Baldycheva
b, Tatiana S. Perova*
band
Galina I. Fedulova
aa
Ioffe Physical Technical Institute, Polytechnicheskaya 26, St.-Petersburg, Russia
b
Department of Electronic and Electrical Engineering, Trinity College Dublin, Dublin 2, Ireland
ABSTRACT
The results of a simulation of the optical properties of a silicon Fabry-Pérot resonator (with liquid crystal filler in the cavity), operated on the shift of the interference bands in the infrared range are presented. The possibility of tuning the reflection coefficient from 0 to 0.95 (or transmission coefficient from 1 to 0.05) by changing the refractive index by 0.1 in the cavity and using the stop-bands and resonance peaks of high order is demonstrated. The prototype Fabry-Pérot resonators were fabricated by dry and wet etching of (100)Si and (110)Si. Some of the resonators were fabricated on a silicon-on-insulator platform. A superposition of transmission peaks with reflection maxima, predicted from calculations, was confirmed experimentally, using infrared microspectroscopy, with a temperature variation from 20 oC to 65 oC and
an applied electric field from 0V to 10V.
Keywords: Fabry-Pérot resonator,FTIR microspectroscopy, Liquid Crystal, Micromachining, Silicon Photonics, SOI
1.
INTRODUCTION
Silicon is an important optical material due to its transparency in the Near Infrared (NIR) range for both 1.3 and 1.55 µm telecommunication wavelengths as well as in the middle-infrared (MIR) and long-wave infrared (LWIR) ranges where the operational wavelength of waveguided Si-based photonic integrated circuits and optoelectronic integrated circuits can be extended far beyond the telecommunication range from 1.55 to 100 μm. The opportunities for Si-based long-wave infrared photonics are: sensing, communications and signal-processing in the 3–5 and 8–14 µm atmospheric-transmission windows, missile detection in the 20 µm region, as well as imaging, sensing and communications in the 30– 100 µm ‘terahertz’ regime1. Another important advantage of Si is the maturity of silicon processing in the CMOS
electronics industry, resulting in potentially low cost and large scale manufacturing capability2.
Polarization is one of the important properties which provides the ability to control the light propagation. To use this property, the light needs to be polarized in different manner. Polarization modulation is the most common mechanism used in Liquid Crystal (LC) devices for optical switching, beam steering, and display applications. Electro-optical devices based on LCs are extensively implemented in optical networks. For certain important applications, LC-based devices may offer some potential advantages: they possess a high electro-optic response, non-mechanical operation, lower power consumption, easy fabrication, and low cost3. It has been recently suggested4 that a combination of photonic
crystals (PC) and LC can be used for the fabrication of active devices for optical communication. The optical properties of such devices can be tuned by means of temperature or an applied electric field with the possibility of operation in the NIR, MIR and LWIR range of wavelengths.
*[email protected]; phone 3 531 896-1432; fax 3 531 677-2442; http://www.mee.tcd.ie
Photonic Crystal Materials and Devices IX, edited by Hernán R. Míguez, Sergei G. Romanov, Lucio Claudio Andreani, Christian Seassal, Proc. of SPIE Vol. 7713, 771320
© 2010 SPIE · CCC code: 0277-786X/10/$18 · doi: 10.1117/12.855541
Proc. of SPIE Vol. 7713 771320-1
There are numerous publications devoted to experimental investigations of the electro-tuning effect in LC photonic structures such as LC-opal composite structures,microporous Si-LC structuresand multilayered one-dimensional (1D) PC with a liquid crystal cavity (see references in [5]), which manipulating with light propagating perpendicular to the substrate. The number of papers dealing with the molding of in-plane light propagation is relatively small and these mainly present the results on the thermo-tuning effect in 1D and 2D PCs. One of the main reasons for that is the difficulty with the application of an electric field to the matrices based on electro-conductive materials. In Ref. [6], for example, tuning of the defect mode position in the NIR frequency range by means of an applied electric field varied from 10 to 20V was demonstrated for a 2D PC with LC filler in the cavity. In other papers7,8 1D PCs with LC filler were
investigated and the tuning of the photonic band gap (PBG) edge was obtained experimentally within the range of a 2 to 10 V applied electric field, which is in accordance with theoretically predicted threshold voltage for nematic LCs9.
The main aim of the majority of the ongoing investigations, devoted to periodical Si-LC structures and based on both the 1D PCs and 2D PCs with high optical contrast, is to use the PBG material's regions of high reflection. For this purpose the utilisation of the lowest PBG is preferable, since this particular band gap for a certain design of PCs may provide a complete (or quasi-complete) PBG, existing for different angles and polarisations of incident light. This is the so-called omni-directional PBG. In certain cases in 1D PCs the secondary PBGs are also in use, since, in accordance with simulations, they provide the band gap with a reasonable width and quality of the defect mode, comparable with these parameters for the lowest PBG. The investigation of PBGs of high order in real PCs is further complicated due to the fact that the imperfections aroused during fabrication (e.g. the roughness and lack of thickness uniformity of Si sidewalls) affect the PBGs of high order more strongly. The latter is one of the reasons why the PBGs of high order are rarely used in real photonic devices.
In this paper we analyse the utilisation of the simplest photonic structure, consisting of only two Si walls (two mirrors), with the air gap (resonator cavity) between them, which can be infiltrated with LC. This type of photonic structures is well known in physical optics as the Fabry-Pérot (FP) interferometer10. The operating principle of FP interferometer is
based on receiving the interference bands (fringes) of the light wave propagating through this device. The interference measurements (i.e. measurements of the interference bands (IBs) in reflection spectrum) are performed in this study by means of an external spectrometer. Since at certain conditions the IBs possess resonance peaks in reflection spectrum, we call the aforementioned device a Fabry-Pérot resonator (or simply resonator). The prerequisites for the design of a FP resonator (FPR) are: i) the high reflection of mirrors in case of Si, ii) a potential for large variation of the devices using micro-structuring of silicon, iii) the capability to vary the resonator optical length by infiltration of different liquid compounds into the cavity, iv) the application of the resonator in a wide range of transparency of Si (1-15 μm), including LC as a filler, and v) the ability to reorient the LC director by heating or application of electric field of low voltages.
Therefore, the objective of this work is the design and investigation of different methods of fabrication of FP resonator with ability to use the bands of high reflectance and the resonance peaks of high order. The empty and LC infiltrated FPRs (with Air and LC in resonator cavity, correspondingly) were fabricated by micro-structuring of (110)Si, using anisotropic etching (AE), as well as of (100)Si, using deep reactive ion etching (DRIE). The reflection and transmission spectra of the fabricated structures were measured by means of Fourier Transform Infrared (FTIR) microspectroscopy in wide infrared range and using Optical Spectrum Analyser (OSA) with fibre-coupling set up in NIR. The perspective targets of this work are the fabrication of the tunable polarisation element integrated into silicon chip, tunable optical filter and a moderately fast light modulator.
2.
SIMULATION OF FABRY-PÉROT RESONATOR
In order to design the Fabry-Pérot resonator it is necessary to select it’s parameters in such a way that the optical characterisation of the device would be possible after fabrication. Technologically, the minimum size of the device, that can be realised by optical lithography is, in our case, of about 1 μm. The range of possible spectral measurements using the FTIR micro-spectrometer is 1.5-15 μm. Therefore, for calculations we can choose a working wavelength of λ0=10
μm. In accordance with Ref. [10], the size of a resonator cavity (Fig. 1(a)) must equal
Dcav=λ0/2N (1)
Proc. of SPIE Vol. 7713 771320-2
where N is the refractive index of the cavity. In the case of the empty cavity with refractive index N =1 the size (or width) of the resonator cavity is Dcav =5 μm. The optical width of a high-refractive index (ODH) layer in this resonator can then be determined from the following expression
ODH= λ0/4. (2)
Since in our case we use a single Si wall as a mirror (see Fig. 1a), the geometrical size of the Si wall can be determined from the expression
DH =ODH /NH, (3)
where NH is the refractive index of the H-layer, namely a Si layer with NSi=3.42 in the IR range.
Fig.1. Schematic presentation of Fabry-Pérot resonator, consisting of two Si walls separated by (a) a gap and infiltrated with liquid crystal molecules with different alignment: (b) vertical planar, (c) horizontal planar, (d) isotropic, (e) homeotropic and (f) quasi-isotropic (or random) in the mesophase.
Therefore, the width of the Si walls is DSi=0.731 μm, the width of a resonator cavity is Dcav=5 μm, and the obtained structure is adapted for a working wavelength of λ0=10 μm with maximum transmission for the resonance peak and maximum reflectance from the Si-walls (mirrors). The reflection spectrum R, calculated by means of Transfer Matrix Method (TMM)11, is shown by the dashed line in Fig. 2, which demonstrates the characteristic spectral pattern of bands
with high reflection (with the maxima of R at around 0.95). For convenience we will name these bands as stop-bands (SBs). The calculations are performed at normal incidence of light and at the refractive index of the incoming and outgoing medium N=1.
2000 4000 6000 8000 0.0
0.5 1.0
5 10 15
0.0 0.5
1.0 b
a
R
ν, cm-1
R
λ, μm
2000 4000 6000 8000 0.0
0.5 1.0
5 10 15
0.0 0.5
1.0 b
a
R
ν, cm-1
R
[image:3.612.89.528.220.277.2]λ, μm
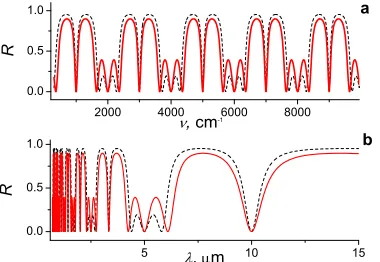
Fig. 2. The simulations of the reflection spectra of two ideal FP resonators with calculated working (a) frequency of ν0=1000 см-1 or (b) wavelength of λ0=10
μm for i) empty cavity at Ncav=1, Dcav =5μm (dashed
line) and ii) LC-cavity (solid line) at Ncav =1.6, Dcav
=3.125 μm.
Fig. 3 Comparison of two FP resonators, calculated
for Dcav=5μm with N=1 (dashed line) and N =1.6
(solid line) in a resonator cavity.
High R values are the characteristic feature of high optical contrast periodical structures, and it can be seen that only two Si walls in total support this high value of R. Figures 2a and 2b also demonstrate deep resonance peaks situated exactly
Proc. of SPIE Vol. 7713 771320-3
[image:3.612.82.272.439.570.2] [image:3.612.316.505.442.576.2]in the middle of the SBs and we characterise this resonator as an ideal Air-resonator. If we want to change the parameters of a resonator, there are at least two ways to do so. One way is to fabricate the resonator with cavities of different geometrical sizes and shift the resonance peak to low or high wavelength regions, as was demonstrated in Ref. [12], for example. Another way is to fill the cavity with some compound, like liquid for example, with a known refractive index. Since we are going to use the same working wavelength (λ0=10 μm), the geometrical width of the cavity must be
decreased by n-times in accordance with Eqn. (1). Let us consider a liquid crystal with refractive index Ncav=1.6, which will result in a value of Dcav =3.125 μm, and calculate the spectrum R with these new parameters (see Fig. 2, solid line). As can be seen from Fig. 2, the reflection spectrum for a LC-resonator appears to be close to the spectrum R of the Air-resonator. Therefore, for the design of FP resonator both approaches can be utilized. However, we must note that in the second case, due to the decrease in the optical contrast of the Si-LC-Si system, the maximum values of R decrease down to 0.9 as well as the peak at the half-height of SB is broadened. This resonator we identify as an ideal LC-resonator.
2500 5000 7500 10000 0.0
0.5 1.0
5 10 15
0.0 0.5 1.0
b a
R
ν, cm-1
R
λ, μm
2500 5000 7500 10000 0.0
0.5 1.0
5 10 15
0.0 0.5 1.0
b a
R
ν, cm-1
R
λ, μm
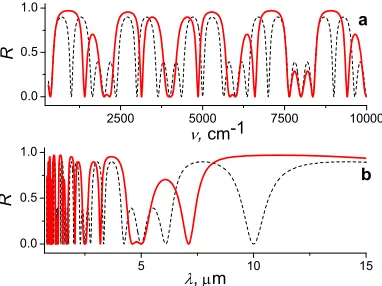
Fig. 4. The reflection spectra for LC-resonator with Dcav
=3.125 μm and Ncav=1.6 (dashed line) and Ncav=1 (solid line).
Fig. 5. The reflection spectra calculated for ideal
LC-resonator at Ncav=1.6 (dashed line) and after infiltration
with compound of Ncav=1.5 (solid line).
Let us consider now a different type of resonator (non-ideal) where in the cavity, calculated for the Air-resonator, the LC with Ncav =1.6 is infiltrated. As can be seen from Fig. 3 this approach results in appearance of two or three resonance peaks within all stop-bands of the original Air-resonator. This result, in fact, was expected, because by infiltration of LC into a cavity, the optical thickness of the cavity increases by 1.6 times, that provides the condition for observation of two or more resonances. In the first and the fifth SBs two resonance peaks, red- and blue-shifted on relative values of Δν/ν (of ~20% and 40%)with respect to the peak, correspondent to the Air-resonator, are obtained. For the third SB the total overlapping of peak’s position for Air and LC resonators is observed and, in addition to that, two extra peaks are appeared. Therefore, the empty (Air) resonator at ν =5000 cm-1 after LC infiltration demonstrates the resonance peak at
the same frequency as well as two additional resonance peaks at ν =4500 and ν =5500 cm-1. We will consider now
another (inverse) pair of resonators, i.e. the ideal LC-resonator (Fig. 2, solid line) with hypothetically removed LC-filler from the cavity. This means, that we calculate the reflection spectrum for the resonator with cavity width estimated for LC (namely Dcav =3.125 μm), but using N=1 at the same time (see Fig. 4). It can be seen from Fig. 4, that the peak position of LC-resonator at ~1000 cm-1 is situated at the maximum of R in the first SB of Air-resonator. A similar
situation is observed at ν =7000 and ν=9000 cm-1. Therefore, for the Air-resonator we have nearly total reflection
(R=0.95) at wavelength of 10 μm (1000 cm-1), while LC infiltration results in total transmission (T=1) at this wavelength.
However, the process of LC infiltration and removal is not very fast and such an approach is not practical for fabrication of a tunable device. For real devices the utilisation of the optical media with the refractive index variation under application of the external forces (temperature or electric field) is more practical. In particular, the refractive index modulation of LCs under external forces could be of order 0.1-0.2. Let us estimate the tuning of the LC-resonator under these conditions, i.e. let us compare the reflection spectra calculated for the ideal LC-resonator at Ncav =1.6 and for non-ideal one at Ncav =1.5 (Fig. 5). Figure 5 shows that tuning LC from Ncav =1.6 to Ncav =1.5 leads to the shift of the resonance peak in the first and in the second stop-bands. However, the most interesting effect is observed for the fourth (ν=7000 cm-1) and fifth (ν=9000 cm-1) SBs where the total transmission in the resonance peak in one state of LC
Proc. of SPIE Vol. 7713 771320-4
[image:4.612.88.279.221.364.2] [image:4.612.319.508.223.359.2]orientation (Ncav =1.6) replaced with zero transmission in another LC state (Ncav =1.5). This result is similar to the one demonstrated in Fig. 4. Therefore, the calculations, demonstrated in this Section, shows the capability of tuning the maximum of reflection R from 0 to 0.95 (or T from 1 to 0.05) by variation of the refractive index on ΔNcav in the resonator cavity and by using the stop-bands of high order.
3.
FABRICATION AND OPTICAL CHARACTERISATION OF FABRY-PÉROT
RESONATOR BASED ON SILICON AND LIQUID CRYSTAL
3.1 Fabrication of the resonator by microstructuring of Si
The FB resonator for infiltration of LC was fabricated using optical lithography both on (110)Si by means of anisotropic chemical etching13 and on (100)Si using DRIE process18. For fabrication of the passive FP resonators the conventional
Si wafers were used while tunable LC-FPR devices were formed on (110)Si-on-insulator (SOI) wafers. Thermal silicon dioxide was used as a mask when etching the wafers. The depth of the grooves was 50 μm and 20 μm. The choice of 20 μm depth, in particular, was dictated by the minimum size of the aperture of the FTIR and OSA instruments, used for optical characterization (see Section 3.2). The example of silicon resonator, fabricated on (110)Si is depicted in Fig. 6. It was shown that anisotropic chemical etching results in smooth (practically mirror-like) Si sidewalls (Fig. 6b). At the same time, the roughness of Si sidewalls, obtained after DRIE, is quite substantial (see Section 3.4, Fig. 11f). The cavity was infiltrated with commercial LC E7 (Merck)9 using a specially designed reservoir and channels (Fig. 6a). Si
electrodes were connected to the outer pads by attaching thin metal wires to the chip contact areas with a silver paste 8.
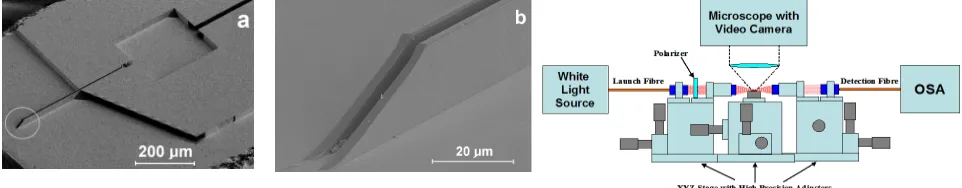
Fig. 6. SEM images of Air-resonator, fabricated on SOI platform, using (110)Si, with (a) reservoir for LC infiltration and b) the cross-section of the resonator edge. Depth of Si-walls is
hSi=20μm.
Fig. 7. Schematic of the optical setup with OSA for characterization of LC-resonator in the near infrared range (λ=0.9-1.7 μm).
3.2 The methods of reflection and transmission spectra measurements
The reflection spectra were first measured by FTIR micro-spectrometer at normal incidence of light in the range λ=1.5-15 μm (650-6500 см-1) for the empty resonator and then measured again after infiltration of the resonator cavity with LC
E7 (see Ref. [14] for more details). For polarized infrared measurements it was accepted that the electric vector of incident light aligns along the channel of the Si grooves for E-polarized light, while for H-polarized light the electric vector aligns along the depth of the grooves as shown in Fig.1. For characterization of the structure in the Near Infrared (NIR) range λ= 0.9-1.7 μmwe used an optical fiber-coupling set-up based on an OSA. The setup was developed for the purpose of polarized transmission measurements in the NIR range (Fig.7). We note that all experimental spectra (reflection and transmission) are demonstrated further in arbitrary (or normalized) units for clarity of the results comparison. The normalization of the data was necessary due, in particular, to a large shading effect14 during infrared
measurements of the resonators integrated into the chip (Fig. 6 a).
The obtained experimental spectra were fitted using the chosen model for the three-layer system (Si-Air-Si or Si-LC-Si), which allows us to obtain the precise values of the thicknesses DSiand Dcav as well as NLC, served as fitting parameters. Both thickness values, obtained from the fitting coincide well with the results estimated from SEM images. The optical constants for Si were taken from Ref. [15] accounting for the dispersion and absorption of silicon in the NIR range. The refractive index of the incoming and outgoing medium is taken as N=1.
Proc. of SPIE Vol. 7713 771320-5
[image:5.612.67.548.326.420.2]3.3 The reflection spectra of Air and LC resonators, fabricated by anisotropic etching of (110)Si.
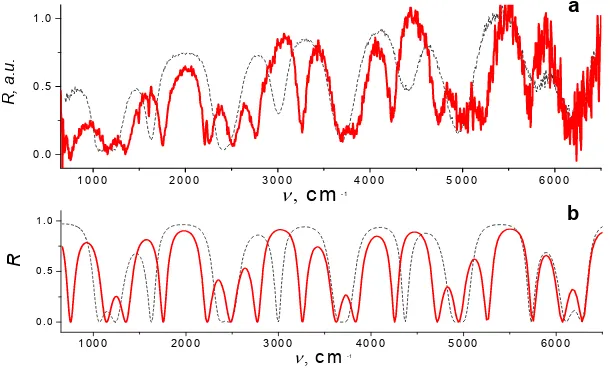
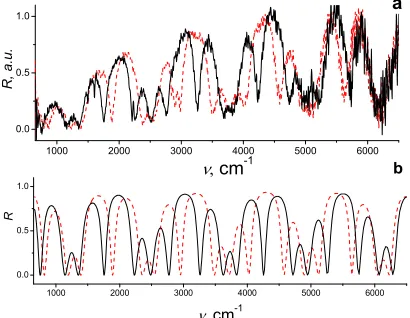
The polarised reflection spectra R of the resonator, fabricated by anisotropic etching of (110)Si, are discussed in this section. The experimental, E-polarized reflection spectra of the Air and LC resonators are shown in Fig. 8 a. This figure depicts the characteristic interference bands spread uniformly throughout the entire range of spectra from 650 to 6500 cm-1 (15-1.5 μm). The fitting of the registered spectra was performed until the best fitting was achieved at certain fitting
parameters DSi and Dcav. The spectrum calculated with the best fitting parameters (DSi=1.2 μm and Dcav=3.4 μm) is shown in Fig. 8b for Ncav=1. As can be seen from Fig. 8b the calculated spectrum shows four characteristic resonance peaks, which are also observed in the experimental spectrum with some degradation of peak quality. The latter is demonstrated as a broadening of the resonance peaks as well as decrease of the peak’s amplitude. This degradation could be caused by a few factors such as the focused light beam of the FTIR microscope, shading effect, unevenness of the Si walls and others. Nevertheless, the position of all experimental SB peaks is in a good agreement with calculated spectrum, which confirmed the good quality of the Si sidewalls and their correspondence to the desired geometrical parameters. The infiltration of LC into the cavity results in substantial blue-shift of nearly all of the IBs, which reflects the decrease in the refractive index of the resonator cavity. Moreover, the shape of the resonance peaks becomes more distinct. As is well known a decrease in the optical contrast at the interface of two phases diminishes the effect of light scattering, which can influence the peak quality and thereby explains some improvement in the resonance peaks quality. The fitting of the reflection spectra R for LC-resonator with the same parameters DSi and Dcav, but at variation
1 0 0 0 2 0 0 0 3 0 0 0 4 0 0 0 5 0 0 0 6 0 0 0 0 .0
0 .5 1 .0
1 0 0 0 2 0 0 0 3 0 0 0 4 0 0 0 5 0 0 0 6 0 0 0
0 .0 0 .5 1 .0
R
, a.u.
ν, c m-1
a
b
R
ν, c m-1
Fig. 8. The (a) experimental and (b) calculated reflection spectra for Air (dashed line) and
LC (solid line) resonators. For spectrum, shown in (b), Ncav=1 (dashed line) and NLC=1.72
(solid line) for DSi=1.2 μm and Dcav=3.4 μm. The height of Si wall is hSi=50 μm.
of Ncav=NLC in the range from 1.3 to 1.8, leads to a reflection spectrum R for E-polarisation, shown in Fig. 8b (solid line) at NLC =1.53. Quite good agreement is observed again between calculated and experimental spectra in Fig. 8.
A similar approach was used for fitting the R spectra of the LC-resonator for H-polarisation, and both spectra (for E and H polarisations) are shown in Fig. 9. Figure 9 reveals that the R spectrum for E-polarisation for three lowest SBs is blue-shifted with respect to that for H-polarisation. Apart from this, the resonance peaks are observed on Fig. 9 in maxima of IBs at ~3300 cm-1 and at ~4200 cm-1 as was predicted above (see Figs. 4 and 5). As was already shown for the
E-spectrum, the fitting of H-spectrum demonstrates a very good convergence between experimental and calculated spectra at NLC=1.53. It is known from literature16, that LC E7 possesses birefringence of order 0.2 and characterised by two values of the refractive indices in the IR range, namely the ordinary refractive index, No =1.49 and extraordinary refractive index Ne=1.69. From the fitting we have received practically the same value of ΔN=0.19, but a slightly different values for No =1.53 and Ne =1.72. Moreover, the high value of ΔN is also confirmed by the appearance of the
Proc. of SPIE Vol. 7713 771320-6
[image:6.612.152.457.310.494.2]characteristic vibrational bands of LC E717 at 1497, 1602 and 2222 cm-1, which are observed in the E-spectrum and
almost absent in the H-spectrum. Therefore, we can conclude that the spontaneous planar orientation of the LC director along the channel has occurred, which corresponds to the schematic, presented in Fig. 1b. The experimental R spectra versus wavelengths (the same ones as presented in Fig. 9a vs. wavenumbers) are presented in Fig.10a with extension to the NIR range 1.5 – 3 μm. A good correspondence between the positions of R bands and the resonance peaks is observed in the regions of 1.7-1.8 and 2.2-2.35 μm, which is in agreement with the calculated data shown in Fig. 10b.
1000 2000 3000 4000 5000 6000
0.0 0.5 1.0
1000 2000 3000 4000 5000 6000 0.0
0.5 1.0
R,
a.u.
ν, cm-1
a
R
ν, cm-1
b 1.6 1.8 2.0 2.2 2.4 2.6 2.8 3.0
0.0 0.5 1.0
1.6 1.8 2.0 2.2 2.4 2.6 2.8 3.0 0.0
0.5 1.0
R
, a.
u.
λ, μm
a
R
λ, μm
b
Fig. 9. The (a) experimental and (b) calculated reflection spectra for LC-resonator for E- (solid line) and H-polarisation (dashed line). Calculated spectra with
NLC=1.72 (solid line) and NLC =1.53 (dashed line), DSi=1.2
[image:7.612.321.526.169.326.2]μm and Dcav =3.4 μm.
Fig. 10. The (a) experimental and (b) calculated reflection spectra in NIR range vs. wavelengths (from Fig.9).
Thus, the resonator with Dcav =3.4 μm demonstrates quite promising characteristics as follows from simulations. If it is an LC-resonator, then, in accordance with Eqns. (1) - (3), λ0=(2·1.6)·Dcav = 11 μm and DSi =11/(3.42·4) =0.8 μm. During fabrication we have received a resonator with DSi =1.2 μm, which is quite close to the calculated value. We can, therefore, conclude that the LC-resonator with a working wavelength of 11 μm (or ~910 cm-1) is fabricated. The
resonance peak of this FP resonator is seen in experimental (Fig. 9a) and in calculated (Fig. 9b) reflection spectra. In addition to that, the corresponding resonance peaks of 2nd, 3rd, 4th and 5th SBs are perfectly depicted in the calculated as
well as in experimental spectra of Air and LC resonators (see Figs. 8 – 10).
3.4 The reflection spectra of LC resonator fabricated on (100)Si by deep reactive ion etching.
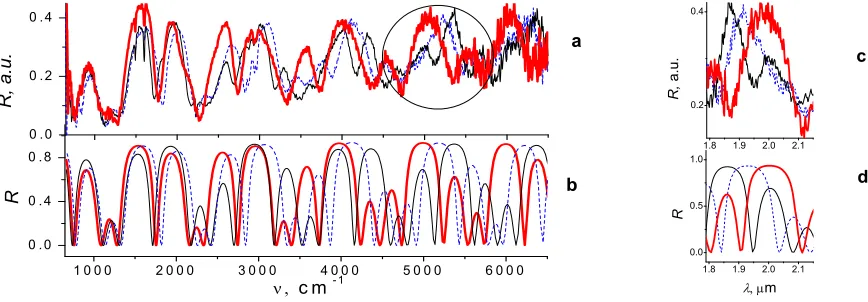
Let us now investigate a non-ideal resonator with non-optimal calculated parameters. In contrast to the previously described FPR, this resonator is fabricated on (100)Si by DRIE process. In this case, if the depth of the etching is relatively large, quite significant roughness of the Si sidewalls (see Fig. 11e,f) is observed, which may strongly influence the quality of the experimentally registered spectra. Another distinct feature of this resonator is the smaller depth (or height, h) of its Si walls (hSi= 20 μm). The decrease in the height of the Si walls results in a decrease of the aperture of the incident light beam, which in turn leads to reduction of the signal-to-noise ratio during FTIR measurements. The experimental and calculated reflection spectra for Air and LC resonators are presented in Fig. 11. The interference bands in spectrum R are deformed and demonstrate the reduced amplitude modulation and so only the part of the spectral range below 4000 cm-1 is shown. The fitting of this reduced range of spectra (650 – 4000 cm-1) for the Air resonator (see
Fig. 11a) yields the following parameters of the resonator: DSi =2.6 μm and Dcav=5.4 μm. Therefore, if we use this resonator as a resonator calculated for utilisation with LC, then it’s working wavelength (the position of the first resonance peak) will correspond to λ0=2·1.6⋅Dcav= 17.3 μm and the thickness of the Si walls to DSi= 17.3/(3.42·4)=1.26 μm. Thus, according to the calculations, the obtained resonator does not have optimal parameters and, as a result, the
Proc. of SPIE Vol. 7713 771320-7
[image:7.612.83.288.171.330.2]position and the quality of the resonance peaks will be different. Nonetheless, the characteristic peaks (dashed lines in wavenumber (Figs. 11a,c) and in wavelength (Fig. 11b,d) presentations) at ~1300 cm-1 (7.7μm) and at ~2500 cm-1 (4 μm) are well identified during the fitting as resonance peaks in the reflection spectrum of the Air resonator. After the infiltration of the Air cavity with LC, the Ncav changes and this leads to change in the experimental and calculated spectra
R, denoted by solid lines in Figs.11 a,b and Figs.11 c,d, respectively. Performing the fitting with known parameters DSi =2.6 μm and Dcav=5.4 μm, we find the value of Ncav=1.53. This value of NLC provides the shift of spectral patterns in such a way that at the frequency of ~900 cm-1 (11 μm) for the empty resonator R has high values, while for LC cavity
the values of R are low. A reverse situation is observed at frequency of ~2500 cm-1 (4 μm) where for the empty resonator
the low R values are obtained, while for the LC-cavity the R values are high. Therefore, it was shown that an LC resonator can be designed even with non-optimal parameters and despite this it can possesses relatively good optical characteristics close enough to the calculated values of an ideal resonator. It was also shown that the roughness of Si sidewalls impairs the quality of the resonator fabricated on Si using the DRIE technique.
4 6 8 10 12 14
0.0 0.2 0.4
1000 1500 2000 2500 3000 3500
0.0 0.2 0.4
4 6 8 10 12 14
0.0 0.5 1.0
1000 1500 2000 2500 3000 3500
0.0 0.5 1.0
d b
a
R, a.u.
λ, μm
c
R,
a
.u
.
ν, cm-1
R
λ, μm
R
ν, cm-1
Fig.11. The (a,b) experimental reflection H-spectra of empty (dashed line) and LC (solid line) resonator vs. (a,c)
wavenumber and (b,d) wavelength. (c,d) Calculated spectra with N=1 (dashed line) and NLC =1.53 (solid line).
SEM images of the resonator: (e) the top view and (g) a sidewall roughness, obtained after DRIE of (100)Si, hSi=
20 μm.
3.5 Tunable resonator operating on the effect of reorientation of LC director during heating
The tunable LC resonator was fabricated on (110)Si by anisotropic etching, in which the tuning of optical properties was obtained due to the reorientation of LC molecules (or LC director) as was predicted in Section 2, Fig. 5. Initially, the reflection spectrum, R of an Air resonator was measured and its parameters were determined, using a fitting procedure as described above. The Air resonator parameters were chosen close to the ideal ones, as described in section 3.3; the parameters obtained during the fitting of the reflection spectra are: DSi =1.2 μm and Dcav=3.6 μm. Then, the cavity was
infiltrated with LC E7 and the reflection spectra were measured at room temperature for E- and H-polarization of the incident light (see Fig. 12a). As can be seen from Fig. 12a, the spectra R are shifted at different polarisations. The fitting, performed for R spectra (Fig. 12b), enables the value of NLC to be determined from each of these spectra. The NLC value, obtained for E-polarisation is 1.67, while for H-polarisation NLC=1.5. Moreover, as can be seen from Fig. 12 a, the characteristic vibrational bands of LC E7 at 1497, 1603 and 2222 сm-1 are also present in the spectrum R only for
E-polarisation, which confirmed that LC has a pronounced spontaneous orientation of rod-like molecules along the channel. This type of LC orientation is shown schematically in Fig. 1c and is one of the most common types of alignment, obtained in our group during LC-infiltration into 1D PCs air channels by capillary effect.
Proc. of SPIE Vol. 7713 771320-8
The resonator was heated up to 65oC using a calibrated thermocouple micro-heater and the reflection spectrum was
registered again at this temperature (Fig. 12a). The variation of NSi at heating to 65oC is not larger than 0.001 and, therefore, can be neglected in this case. Using the fitting of the registered reflection spectrum, the value of NLC was estimated to be around NLC=1.54. Two spectral effects were revealed for R spectrum at E-polarisation (see the stop-band in Fig. 12 shown by circle). In particular, the resonance peak, observed at frequency ~ 5100 cm-1 (at wavelength of 1.94
μm on Fig. 12c), is situated quite close to the maximum of reflection from the heated resonator (thick line). The value of
R=0.25 a.u. is observed at this resonance peak at room temperature, while at 65oC the maximum of reflection increases
up to R=0.4 a.u.. At the same time, at frequency of ~5300 cm-1 (wavelength 1.94 μm) the reflection is R=0.41 a.u. at
room temperature, while at heating of LC to 65oC and its transition to isotropic phase (see Fig.1d) the resonance peak at
λ=1.9 μm with R=0.19 a.u. is appeared. Thus, the thermo-optical effect of LC can be used at two wavelengths. With improved fabrication technology of this type of FP resonators, the much higher ratio of the reflection values (up to 0.01/0.89) for these two cases can be achieved (Fig. 12d). Unfortunately in this type of experiments it is difficult to return to the original LC orientation after cooling the structure down to room temperature. However, this example demonstrates the principle of tuning the resonator for controlling the relative intensity of the reflected light of certain polarizations. It is also demonstrates the possibility of utilizing the observed optical effects in SB and in resonance peaks of high order.
0 .0 0 .2 0 .4
1 0 0 0 2 0 0 0 3 0 0 0 4 0 0 0 5 0 0 0 6 0 0 0 0 . 0
0 . 4 0 . 8
R, a.u.
ν , c m- 1
b
R
a
1.8 1.9 2.0 2.1
0.2 0.4
1.8 1.9 2.0 2.1
0.0 0.5 1.0
R,
a.u.
λ, μm
d
R
[image:9.612.93.527.278.429.2]c
Fig. 12. (a,c) The experimental reflection spectra of LC resonator, demonstrated the effect of thermo-tuning, namely the transition from LC mesophase at 20 ºC (dashed line for H- and thin line for E-polarisation) to the isotropic
phase at 65 ºC (thick line). (c,d) The fragment of R spectra shown against wavelength in the region of interest.
(b,d) Calculated spectra with NLC=1.67 (thin line), NLC =1.54 (thick line) and NLC =1.5 (dashed line). Dcav =3.6
μm, DSi=1.2 μm and hSi =50 μm.
3.6 Tunable resonator based on the reorientation of LC molecules under applied electric field
The resonator was fabricated on a SOI platform with (110)Si device layer of thickness 20 μm. The design of the resonator includes the channels for infiltration of the LC, the channels for electrical isolation of one part of the structure from another, which will be connected to electrodes of different polarity in order to apply an electric field to reorient the LC molecules from planar to homeotropic alignment8 (see Fig.1e). The structure was fabricated by anisotropic etching
of the device layer and the etching was stopped at the SiO2, which results in a Si-wall depth of 20 μm (Fig. 6a). The
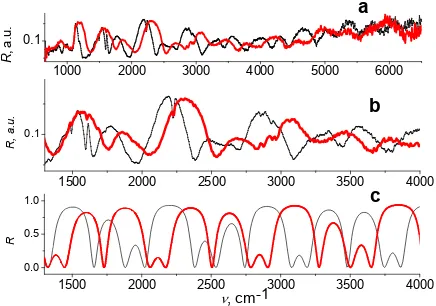
measurements of the reflection spectra of the fabricated structure were first performed by FTIR micro-spectrometer. By fitting of the registered reflection spectra using TMM the structure parameters of the fabricated resonator were determined as DSi =2.3 μm and Dcav=3.7 μm. FTIR measurements were performed again after the infiltration of the resonator cavity with LC. The data analysis shows that only a small spectral shift is revealed between reflection spectra in H and E polarisations. In addition to that, the characteristic vibrational bands of LC E7 show up in the R spectra for both polarisations. We, therefore, conclude that the initial alignment of LC molecules is random in this case (see Fig. 1f). The reflection spectra in H-polarisation are demonstrated in Figs. 13 a,b as in the absence of the applied electric field, i.e. at 0V (thin line), and with an applied electric field of 10V (thick line). As can be seen from Figs. 13 a,b, the spectrum at 10V is blue-shifted, which certifies the decrease in the refractive index of the cavity. At the same time the
Proc. of SPIE Vol. 7713 771320-9
intensity of the vibrational bands of LC E7 also significantly decreased. Both effects enable us to confirm that a good quality homeotropic alignment is accomplished at 10V.
1000 2000 3000 4000 5000 6000 0.1
1500 2000 2500 3000 3500 4000 0.1
1500 2000 2500 3000 3500 4000 0.0
0.5 1.0
R
, a.
u.
c b
R, a.u.
R
ν, cm-1
a
1.0 1.2 1.4 1.6
0.0 0.2 0.4 0.6 0.8
1.0 1.2 1.4 1.6
0.1 1
λ, μm
T
, a.
u
. a
λ, μm
T
[image:10.612.327.539.132.302.2]b
Fig. 13 (a,b) The experimental reflection H-spectra of LC
resonator at 0V (thin line) and 10V(thick line), demonstrated
the electro-tuning effect. (c) Calculated spectra at NLC=1.55
(thick line) at 0V and NLC= 1.50 (thin line) at 10V. The values
DSi =2.3μm and Dcav=3.7μm, as well as NLC were obtained
[image:10.612.77.295.134.287.2]from fittings. hSi = 20 μm.
Fig. 14 a) Electro-tuning effect for the same sample as in Fig. 13, measured with OSA-setup in NIR range. b)
Calculated spectra for NLC =1.5 (thin line) at 0V and
NLC=1.45 (thick line) at 10V. Arrows show the
resonance peaks in calculated spectra.
The fitting of each spectrum, shown in Fig. 13 c, yields the following values for the refractive index: NLC =1.55 for 0V and NLC=1.5 for 10V, which results in the relatively small value of ΔN=0.05. Our previous results8, obtained for electro-tuning of the PBGs in the same range of the applied voltages, demonstrate larger values of ΔN =0.15, correspondent with tuning of the refractive index value from the planar alignment of LC E7 with NLC =1.67 to homeotropic alignment with
NLC =1.52. However, the effect demonstrated in paper8 was unrepeatable, i.e. the subsequent ON/OFF switching of the applied electric field did not result in the initially obtained shift. We conclude that in paper8 the orientation of the LC
molecules after the applied electric field was OFF did not return to the initial state of alignment, and we presume that random (or quasi-isotropic) alignment was formed in the mesophase (see Fig.1f), because the fitting of spectra for both (H and E) polarisation results in a value of NLC =1.56. In this paper the reproducible electro-optical effect with a smaller shift of SB’s edge, resulting in a transition of the NLC value from 1.55 to 1.50, was observed. Therefore, we have received an initial random alignment of LC molecules in the mesophase similar to the result obtained earlier in paper8.
As far as the concept of using a combination of different resonance peaks and corresponding SBs for tuning, we did not confirm this experimentally for the investigated sample, since the dimensions of the sample were not optimised. Although, a substantial shift of the SBs edges at 1600, 2200, 2900 сm-1 and other frequencies was revealed. We,
therefore, believe that tuning the SBs of high orders could be possible for FP resonator with non-optimised parameters. Similar investigations of interference band shift with applied electric fields of 0V and 10V were also performed on the transmission spectra of this sample, using fibre coupling set up in combination with OSA (Fig. 14a). As can be seen from Fig. 14a, the spectrum is blue-shifted at the applied electric field, which indicates a decrease in NLC. The fitting of IBs shows, that for 0V NLC =1.5, while for 10V NLC =1.45. These values slightly differentiate from NLC obtained with FTIR micro-spectrometer, but demonstrate a good agreement between calculated and experimental data (Fig. 14b). One of the shortcomings is the absence of the resonance peaks in experimental spectra, which are seen very clearly in the simulated spectra. We believe that these resonance peaks, appearing at wavelengths of 1.4 μm and smaller, disappeared due to the focused beam of the incident light in our experiments or due to the unevenness of Si walls in resonator. This conclusion
Proc. of SPIE Vol. 7713 771320-10
is indirectly confirmed by the poor conditions of IBs observed in FTIR spectra in the region below 3μm (see Fig. 13a), since the higher the order of SBs and the resonance peaks, the stronger is their deformation. Nevertheless, in this experiment the small and repeatable value of ΔN=0.05 under applied electric field of 10V was obtained from measured transmission spectra as well as from measured R spectra shown in Fig. 13.
4.
CONCLUSION
The design of a Fabry-Pérot resonator with liquid crystal filler in the cavity, operated on a shift of the interference bands in the middle-infrared spectra range is presented. The ability of tuning the reflection coefficient in band maximum from 0 to 0.95 (or transmission coefficient from 1 to 0.05) by varying the refractive index of the media in the resonator cavity and using stop-bands of high order is demonstrated.
Fabry-Pérot resonator devices were fabricated by anisotropic chemical and dry etching of (110)Si and (100)Si, respectively, including SOI substrates. Optical characterisation of the resonance peaks is performed with polarized FTIR microspectroscopy (in reflection mode in the range of 1.5-15 μm) and by using the fibre-coupling set-up in conjunction with OSA (in transmission mode in the range of 0.9 -1.7 μm), which enable reflection and transmission spectra to be obtained over a wide wavelength range, namely from 0.9 to 15 μm. Apart the interference bands of high reflection (Stop Bands) and the resonance transmission peaks, the characteristic vibrational bands of liquid crystal were also observed. The obtained total information enables us to determine the geometrical parameters of the resonator and to make a conclusion on the alignment of the LC molecules, infiltrated into the cavity.
Using the acquired experimental data, we were able to confirm the predictions of simulations on matching the transmission peaks with reflection maxima in the optical spectra, including spectra registered during LC reorientation at heating to 65 oC (the transition temperature to the isotropic phase of LC E7). The tuning of the edge of the stop-bands
and the resonance peaks for Fabry-Pérot resonator was obtained in reflection and transmission mode of the infrared spectra with an applied electric field of 10V.
ACKNOWLEDGMENTS
This work has been supported by IRCSET, Ireland Postdoctoral Award and ICGEE Programme, Science Foundation Ireland (NAP-94 Programme), Grants of Russian Foundation for Basic Research, N08-02-01408 and 09-02-00782. The authors wish to express their appreciation to E.V. Astrova for useful discussion, M. Lynch for help with OSA measurements and Yu. Zharova for help with samples fabrication.
REFERENCES
[1] Soref, R. A., Emelett, S. J. and Buchwald, W. R., “Silicon waveguided components for the long-wave infrared region”, J. Opt. A: Pure Appl. Opt., 8, 840–848, 2006.
[2] Pavesi, L. and Lockwood, D. J., eds., [Silicon Photonics], Springer, Berlin, 397 (2004).
[3] Blinov, L. M. [Electro-optical and Magneto-optical Properties of Liquid Crystals], Wiley, N.Y., (1984).
[4] Busch, K. and John, S. “Liquid-Crystal Photonic-Band-Gap Materials: The Tunable Electromagnetic Vacuum,” Phys. Rev. Lett., 83(5), 967-970 (1999).
[5] Busch, K., Lölkes, S., Wehrspohn, R., Főll, H., eds., [Photonic Crystals. Advances in Design, Fabrication, and Characterization], Weinheim: Wiley-VCH (2004).
[6] Anderson S. P., Haurylau M., Zhang J., and Fauchet P. M., “Hybrid Photonic Crystal Microcavity Switches on SOI”, Proc. SPIE 6477, 647712-1/8 (2007).
[7] Tolmachev, V. A., Astrova, E. V., Perova, T. S., Zharova, J. A, Grudinkin, S. A., Melnikov, V. A. “Electro-tunable in-plane one-dimensional photonic structure based on silicon and liquid crystal”, App. Phys. Lett., 90, 011908, (2007).
[8] Tolmachev, V. A., Grudinkin, S. A., Zharova, J. A., Melnikov, V. A., Astrova, E.V., and Perova, T.S. “Electro-tuning of the photonic band gap in SOI-based structures infiltrated with liquid crystal”, Proc. SPIE 6996,
69961Z-1/9 (2008).
Proc. of SPIE Vol. 7713 771320-11
[9] Data Sheet Licristal® E7, Merck KGaA, Germany (2001).
[10] Lipson, S. G., Lipson, H., Tannhauser, D. S. [Optical Physics (3rd ed.)]. London: Cambridge U.P., 248 (1995). [11] Azzam, R. M. A., Bashara, N. M., [Ellipsometry and polarized light], Amsterdam, North-Holland, 334 (1977). [12] Lipson, A. and Yeatman, E. M. “A 1-D Photonic Band Gap Tunable Optical Filter in (110) Silicon”, J. of
Microelectromechanical Systems, 16(3), 521-527 (2007).
[13] Kendall, D. L. “Vertical etching of silicon at very high aspect ratios”, Ann. Rev. Mater. Sci.,9, 373-403 (1979). [14] Tolmachev, V. A., Perova, T. S., Astrova, E. V., Volchek, B. Z. and Vij, J. K., “Vertically etched silicon as 1D
photonic crystal”, Physica status solidi (a), 197(2), 544-549 (2003).
[15] Palik, E.D., ed., [Handbook of Optical Constants of Solids], Academic Press.Inc, NY, p .805 ( 1985).
[16] Khoo, L. C. “The Infrared Optical Nonlinearities of Nematic Liquid Crystals and Novel Two-wave Mixing Processes”, J. Mod. Opt. 37(11), 1801-1813 (1990).
[17] Wu, S., Efron, U., and Hess L. V. D. “Infrared birefringence of liquid crystals”, App. Phys. Lett., 44(11), 1033-1035 (1984).
[18] Melnikov, V.A., Astrova, E.V., Perova, T.S., and Srigengan, V., “Stain etching of micro-machined silicon structures”, J. Micromech. Microeng., 18(2), 025019-1/6 (2008).
Proc. of SPIE Vol. 7713 771320-12