glass membranes were produced by Corning (Vycor威), Schott, and PPG. Glass membranes are typically made as discs, tubes or hollow-Rbres. To produce microporous glass membranes, a homogene-ous melt consisting of 70 wt% SiO2, 23 wt% B2O3 and 7 wt% Na2O is formed between 1300 to 15003C. Phase separation of the initially homogeneous glass melt occurs by lowering the temperature to about 8003C. One phase consists primarily of insoluble sili-con dioxide. The other phase, rich in alkali borate, can be leached from the heterogeneous glass by treat-ment with a mineral acid. After removal of the alkali borate phase, a microporous silica membrane is formed.
Future Developments
During the past forty years membranes have gained signiRcant importance in a wide variety of industrial separations. Currently, polymeric membranes are most commonly used for commercial applications. However, recent developments on inorganic mem-branes are very promising and such memmem-branes may broaden the separation spectrum of membranes for separations. The wide-spread use of inorganic mem-branes in industrial applications is currently limited by their poor mechanical stability and very high pro-duction costs. If these problems can be solved in future work, inorganic membranes will present a new generation of high-performance membranes for the next millennium.
Further Reading
Baker RW, Cussler EL, Eykamp Wet al. (1991)Membrane Separation Systems}Recent Developments and Future Directions. Park Ridge, NJ: Noyes Data Corporation. Bhave RR (1991) Inorganic Membranes. New York:
Van Nostrand Reinhold.
Burggraaf AJ and Cot L (1996)Fundamentals of Inorganic Membrane Science and Technology. Amsterdam: Elsevier.
Cabasso I (1987) InEncyclopedia of Polymer Science and Engineering, Vol. 9, pp. 509}579. New York: John Wiley and Sons.
Kesting RE (1971) Synthetic Polymeric Membranes. New York: McGraw-Hill Book Company.
Kesting RE and Fritzsche AK (1993)Polymeric Gas Separ-ation Membranes. New York: John Wiley and Sons, Inc. Koros WJ and Pinnau I (1994) In: Paul DR and Yampolskii YP (eds) Polymeric Gas Separation Membranes, pp. 209}271. Boca Raton: CRC Press.
Lloyd DR (1985) Materials Science of Synthetic Mem-branes. ACS Symp. Ser. 269. Washington DC: ACS. Mulder M (1996)Basic Principles of Membrane Technology,
2nd edn, Boston, MA: Kluwer Academic Publishers. Petersen RJ and Cadotte JE (1990) In: Porter MC (ed)
Handbook of Industrial Membrane Technology, pp. 307}348. Park Ridge, NJ: Noyes Publications. Pinnau I (1994)Polym.Adv.Techn., 5, 733.
Strathmann H (1979)Trennung von molekularen Mischun-gen mit Hilfe synthetischer Membranen. Darmstadt: Dr. Dietrich Steinkopff Verlag.
Strathmann H (1990) In: Porter MC (ed) Handbook of Industrial Membrane Technology, pp. 1}60. Park Ridge, NJ: Noyes Publications.
Micro
\
ltration
I. H. Huisman, AMKM, TNO Voeding, AJ Zeist,
Holland
Copyright^ 2000 Academic Press
Introduction
MicroRltration is a separation technique for remov-ing micron-sized particles, like bacteria, yeast cells, colloids, and smoke particles, from suspensions or gases. The process uses membrane Rlters with pores in the approximate size range 0.1 to 10m, which are permeable to theSuid, but retain the particles, thus causing separation. Examples of particles with sizes in the microRltration range are presented inFigure 1. MicroRltration membranes wereRrst commercial-ized in the 1920s, and were at that time mainly used for the bacteriological analysis of water. After 1960 the number of successful microRltration applications
grew rapidly, and nowadays microRltration processes are operated in such different Relds as the biotech-nological, automobile, electronics, and food industry. Examples of applications are the harvesting of bacter-ial and yeast cells, the recovery of latex pigments from paints, and the puriRcation of water for the electronics industry. In the food industry, microR ltra-tion is used in the clariRcation of fruit juices, wine, and beer, in fat removal from whey and in removal of bacteria from milk.
Figure 1 Particles in microfiltration size range.
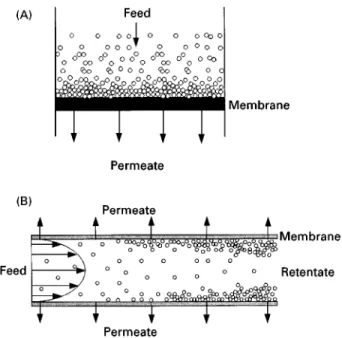
Figure 2 (A) Dead-end filtration and (B) cross-flow microfiltra-tion using a tubular membrane.
(tangentialSow)Rltration (Figure 2). Indead-endT l-trationthe mainSow direction is perpendicular to the membrane. The suspended particles are continuously dragged towards the membrane and deposit on the surface or inside the membrane pores. The deposition of particles leads to a continuously increasing resist-ance to Sow and thus to a continuously decreasing permeateSux rate. To reduce this deposition process, microRltration is often carried out in thecross-Uow mode(tangentialSow) in which the mainSow direc-tion is tangential to the membrane. TheSow ‘scours’
away particles from the membrane surface, and thus limits particle deposition.
Micro
\
ltration Membranes
Two main types of membrane Rlters exist: screen Tlters and depthTlters. Screen Rlters contain capil-lary-type pores; particles are retained on the mem-brane surface primarily by a sieving mechanism. Depth Rlters contain a random, tortuous porous structure; particles are retained through adsorption and mechanical entrapment within the bulk of the Rlter. ScreenRlters are absolute: particles larger than the pore size are retained, whereas particles smaller than the pore size can pass relatively easily through the membrane. Particle retention of depthRlters is not that clearly deRned: retention values increase slowly over a broad particle size range and only reach 100% for very large particles. DepthRlters are often used for dead-end Rltration, as they can retain a high particle load.
Membrane Materials and Membrane Preparation
MicroRltration membranes are available in a wide variety of materials and methods of manufacture. Many membranes are made of polymers, such as cellulose acetate, polysulfone, and polyvinylideneS u-oride (PVDF). Most of these membranes are solvent cast, through a phase inversion process. Other prep-aration techniques are stretching (polytetraS uoro-ethylene, PTFE, membranes) and track-etching (poly-carbonate membranes). The track-etching process results in cylindrical pores with a very narrow size distribution.
Other microRltration membranes available are made from glass, from ceramics, such as alumina, titania, and zirconia, and from metals, such as silver and stainless steel. Advantages of these inorganic materials are their higher stability towards extreme process conditions, such as high temperature, ex-treme pH values, and solvents different than water. Most metal and some ceramic membranes are pro-duced by a sintering process, whereas other ceramic membranes are produced by sol-gel processing or by anodic oxidation. Some novel membranes are pre-pared by lithographic techniques.
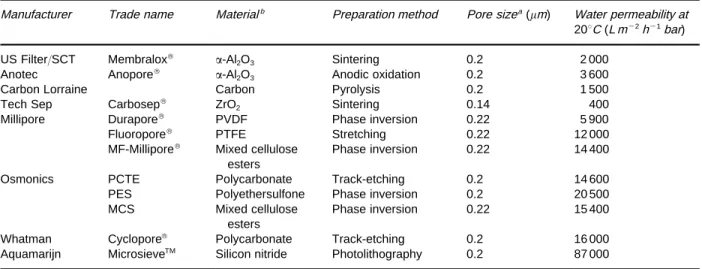
Table 1 Various microfiltration membranes and their water fluxes
Manufacturer Trade name Materialb Preparation method Pore sizea(m) Water permeability at
203C (L m\2h\1bar)
US Filter/SCT Membralox] -Al2O3 Sintering 0.2 2 000
Anotec Anopore] -Al2O3 Anodic oxidation 0.2 3 600
Carbon Lorraine Carbon Pyrolysis 0.2 1 500
Tech Sep Carbosep] ZrO
2 Sintering 0.14 400
Millipore Durapore] PVDF Phase inversion 0.22 5 900
Fluoropore] PTFE Stretching 0.22 12 000
MF-Millipore] Mixed cellulose esters
Phase inversion 0.22 14 400
Osmonics PCTE Polycarbonate Track-etching 0.2 14 600
PES Polyethersulfone Phase inversion 0.2 20 500
MCS Mixed cellulose
esters
Phase inversion 0.22 15 400
Whatman Cyclopore] Polycarbonate Track-etching 0.2 16 000
Aquamarijn MicrosieveTM Silicon nitride Photolithography 0.2 87 000
aAll these membranes are available with pore sizes in large ranges. The pore sizes closest to 0.22m are mentioned here to compare
water fluxes of the different membranes. bPVDF, polyvinylidene fluoride; PTFE, polytetrafluoroethylene.
Membrane Characterization
Originally the main goal in characterization of porous membranes was to determine the pore-size distribution. It has however been realized more re-cently that membrane surface properties, such as hy-drophobicity, zeta potential and surface roughness, play an important factor in fouling and retention properties of membrane processes. Characterization is therefore nowadays performed by various tech-niques, measuring different structural and physico-chemical parameters. The relatively novel technique of AFM microscopy has been shown to provide in-formation on many membrane properties of interest: pore size distribution, surface roughness, and ad-hesion behaviour. In Table 2, various measurement techniques are summarized.
Dead-end Micro
\
ltration
In dead-endRltration, theSuid is forced perpendicu-larly through the membrane, while all or most of the particles are retained (Figure 2a). If screenRlters are used, these particles build a cake layer on the surface, which causes an additional resistance toSow. If depth Rlters are used, these particlesRll the voids within the membrane bulk, and in this way cause an increased resistance. For both types of Rlters, the increased resistance causes a continuous decline inSux if a con-stant transmembrane pressure is used (Figure 4). After some time, theSux has been reduced to unac-ceptably low levels, and the membrane has to be cleaned or replaced.
Dead-endRltration is preferred over cross-SowR l-tration in situations where the concenl-tration of par-ticles to be removed from theSuid is very low, as is
the case for sterile Rltration in the pharmaceutical industry, for gas cleaning, and for guard-Rlters positioned as last step in a high-purity water unit. Dead-endRltration is also used in situations where backSush techniques and gas sparging are so effective that the use of a cross-Sow is not necessary, as found in some wastewater-treatment plants. Fluid Flow through Membrane Pores
The capacity of a microRltration process is expressed as Sux,J, which is the volume of permeate passing through the membrane of areaAmand per unit time:
J"1 Am
dV
dt [1]
where V is the volume of permeate, and t is time: Most commercial liquid microRltration processes operate at Suxes of typically about 10\4m s\1 (360 L m\2h\1).
The driving force for thisSux is thetransmembrane pressure(most commonly written asP), the pressure difference between feed side and permeate side, which results from applying either suction to the permeate side or pressure to the feed side, or both. Transmembrane pressures in liquid microRltration are typically 5}100 kPa (0.05}1 bar). It was found phenomenologically that the Sux increases linearly with the transmembrane pressure (Darcy’s law):
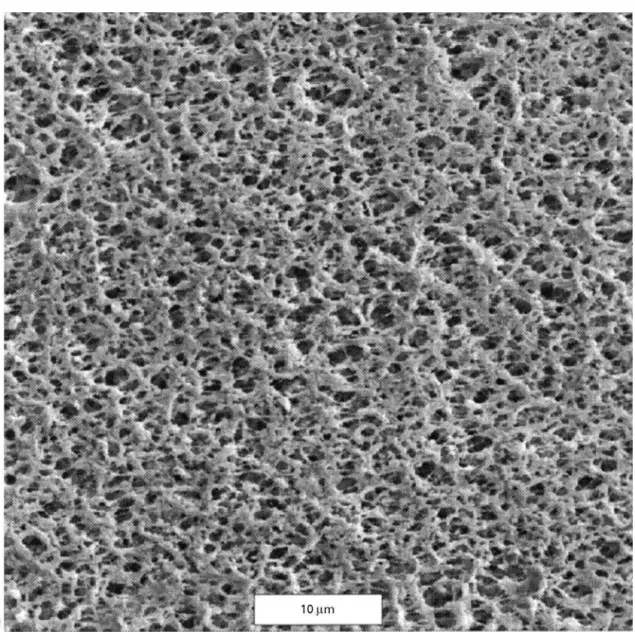
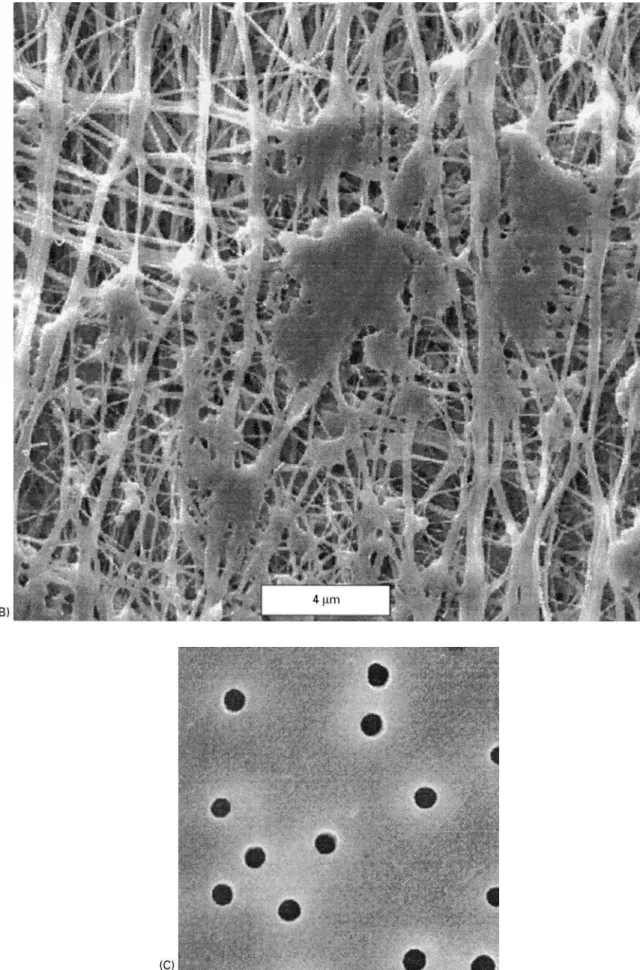
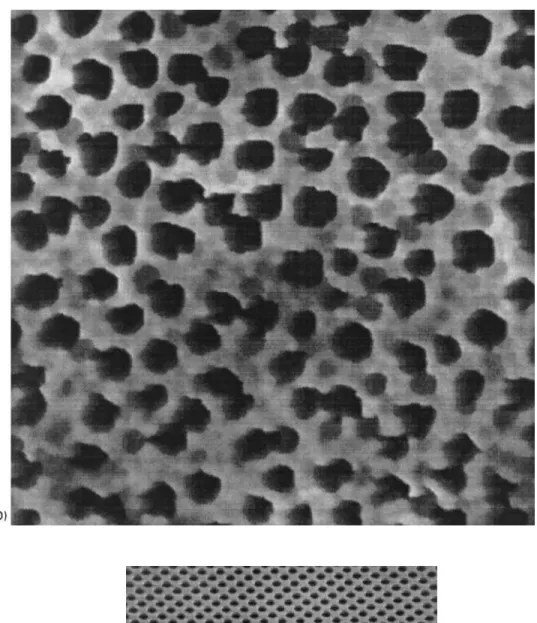
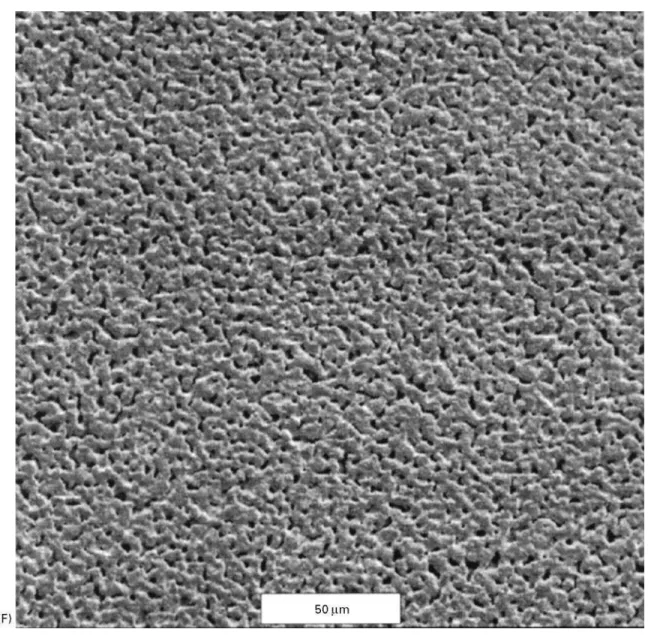
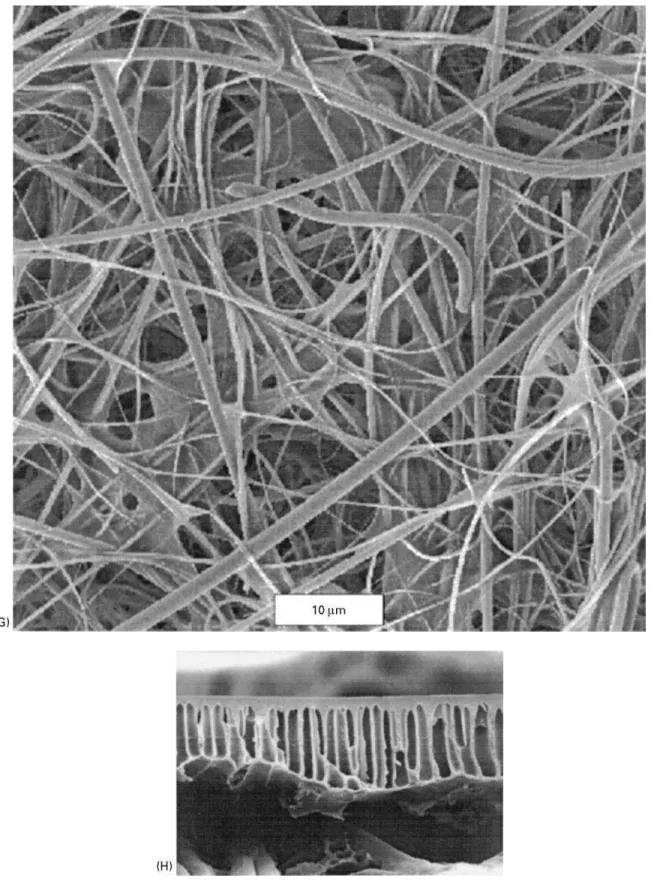
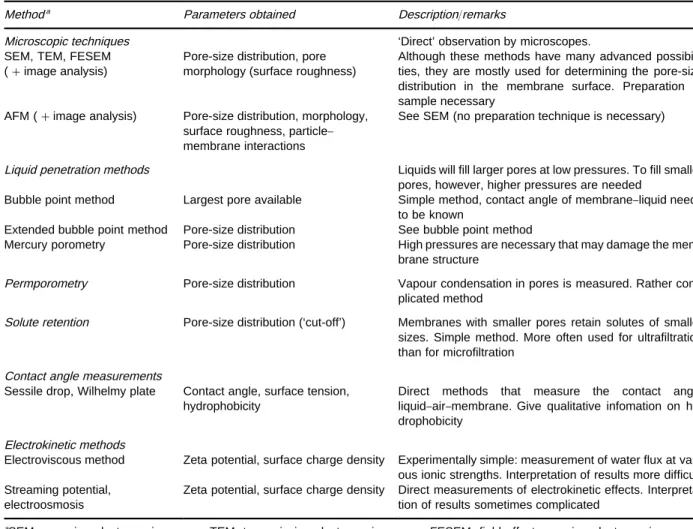
J" P Rm)0
Figure 3 SEM (A}C, E}H) and AFM (D) of surfaces and cross-section of different membranes. (A) Durapore membrane, rating 0.22m, PVDF solvent cast membrane (Millipore). (B) Fluoropore membrane, 0.1 rating, stretched PTFE (Millipore). (C) Polycarbonate track-etched membrane (Osmonics). (D) Anopore membrane, 0.1m rating, anodically oxidated Al2O3 (Anotec). (E) Microsieve,
photolithography, silicon nitride (Aquamarijn). (F) Silver membrane (Millipore). (G) AP15 glass fibre depth filter (Millipore). (H) Cross-section of a P series membrane, solvent cast polyethersulfone (Osmonics). (A), (B), (F) and (G) were kindly supplied by the Millipore corporation. (C) and (H) were kindly supplied by Osmonics; (D) was kindly supplied by the Group of Membrane Science and Technology, University of Valladolid, Spain; (E) was kindly supplied by Aquamarijn.
permeateSow. Thepermeabilityof the membrane is deRned as the inverse of its resistance (1/Rm). MicroRltration membranes have permeabilities of typically 10\11m.
The permeability is related to the pore size. The exact relation between permeability and pore size depends on the geometry. For straight cylindrical pores, the Hagen}Poiseuille equation yields:
Rm"8l
mr2p
[3]
where l is the membrane thickness, m is the membrane porosity, and rp is the pore radius. For membranes comprised of sintered spheres, the Kozeny}Carman equation may give a better approxi-mation:
Rm"45(1!m) 2l
3ma2 m
Figure 3 Continued
Screen Filters: Cake-layer Build-up
The Sux calculated by eqns [2]}[4] is the so-called ‘pure waterSux’. DuringRltration, fouling and cake-layer build-up continuously decrease theSux to values much lower than the pure water Sux. Darcy’s law (eqn [2]) can be written for a fouled membrane as:
J" P Rtot)0
[5]
whereRtot is the total hydraulic resistance. It can be divided into the membrane resistance (Rm), the resist-ance caused by fouling (Rf), and the resistance caused by the cake layer (Rcake):
Rtot"Rm#Rf#Rcake [6]
Figure 3 Continued
to predict the extent of fouling quantitatively; a qualitative description is given in a later section. The cake resistance can be calculated by the Kozeny} Carman equation, eqn [4], where the cake’s void fraction , the cake-layer thickness c, and the particle radius a are to be inserted for m, l and amrespectively.
The void fraction of the cake layer,, may depend on various parameters, such as transmembrane pressure, particle size distribution, shape, and compressibility, and the effect of particle}particle in-teractions. Often a value between 0.3 and 0.4 is found for.
A model for the time dependent dead-end Rltration Sux is obtained by combining eqns [4]}[6] with a mass balance describing cake layer build-up:
dcdt#J
b"(1!) dcdt [7]
wherebis volume fraction of particles in the bulk. If a constantP is applied, theSux is given by:
J(t)" P 0Rm
1# 2RK cbP)t (1!!b)0R2m
\1/2 [8]
whereRKcis the speciRc cake resistance ("Rc/c). Care must be taken when using eqn [8] asandRK coften depend on time (cake compaction).
Depth Filters
Figure 3 Continued
most important mechanisms are particle capture by interceptionand particle capture by diffusion. Inter-ception occurs when a particle follows aSuid
Table 2 Membrane characterization methods
Methoda Parameters obtained Description/remarks
Microscopic techniques ‘Direct’ observation by microscopes.
SEM, TEM, FESEM (#image analysis)
Pore-size distribution, pore morphology (surface roughness)
Although these methods have many advanced possibili-ties, they are mostly used for determining the pore-size distribution in the membrane surface. Preparation of sample necessary
AFM (#image analysis) Pore-size distribution, morphology, surface roughness, particle} membrane interactions
See SEM (no preparation technique is necessary)
Liquid penetration methods Liquids will fill larger pores at low pressures. To fill smaller
pores, however, higher pressures are needed
Bubble point method Largest pore available Simple method, contact angle of membrane}liquid needs to be known
Extended bubble point method Pore-size distribution See bubble point method
Mercury porometry Pore-size distribution High pressures are necessary that may damage the
mem-brane structure
Permporometry Pore-size distribution Vapour condensation in pores is measured. Rather
com-plicated method
Solute retention Pore-size distribution (‘cut-off’) Membranes with smaller pores retain solutes of smaller sizes. Simple method. More often used for ultrafiltration than for microfiltration
Contact angle measurements
Sessile drop, Wilhelmy plate Contact angle, surface tension, hydrophobicity
Direct methods that measure the contact angle liquid}air}membrane. Give qualitative infomation on hy-drophobicity
Electrokinetic methods
Electroviscous method Zeta potential, surface charge density Experimentally simple: measurement of water flux at vari-ous ionic strengths. Interpretation of results more difficult Streaming potential,
electroosmosis
Zeta potential, surface charge density Direct measurements of electrokinetic effects. Interpreta-tion of results sometimes complicated
aSEM, scanning electron microscopy; TEM, transmission electron microscopy; FESEM, field effect scanning electron microscopy;
AFM, atomic force microscopy.
Figure 4 Flux versus time for the dead-end microfiltration of a silica particle suspension.
Capture by diffusion occurs when the Brownian motion of the particle results in contact between the particle and theRlter matrix.
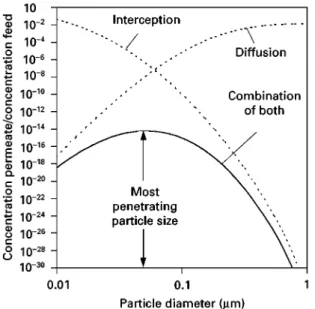
Interception is the dominant capture mechanism for large particles; Brownian diffusion is the dominant capture mechanism for smaller particles. Capture is therefore least effective for intermediate size particles, leading to the existence of a ‘most penetrating particle size’ (Figure 5). The exact value of this most penetrat-ing particle size depends on the membrane pore dia-meter and the Sow velocity. It has been found, how-ever, that capture of particles from gas streams by membranes of pore diameters of about 0.2m is so effective that essentially all particles are retained.
For depthRltration of liquids, the situation is dif-ferent, as physicochemical (charge) effects alter the relative magnitudes of the capture mechanisms de-scribed above. If physicochemical conditions are fa-vourable, capture efRciencies in liquids can be similar to those in gases. If conditions are less favourable, capture efRciencies for the smaller particles decrease
Figure 5 Schematic representation of efficiency of capture by interception and capture by diffusion versus particle size. The most penetrating particle size is obtained by combining both mechanisms.
Figure 6 Flux versus time for the cross-flow microfiltration of a silica particle suspension.
Cross-
]
ow Micro
\
ltration
Dead-end microRltration, as stated, may suffer from dramatic Sux loss because of deposition of particles on the membrane surface and fouling phenomena. Therefore microRltration is often carried out in the cross-Uow mode (Figure 2b). The tangential Sow (cross-Sow) ‘scours’ away particles from the mem-brane surface, and thus limits cake-layer build-up and fouling. Another advantage of cross-SowRltration is the possibility for continuous operation. Cross-Sow Rltration is used in most industrial large-scale micro-Rltration plants. For cross-Sow microRltration, screen Rlters are mainly used.
Cake-layer Build-up and Fouling
During a cross-Sow microRltration process, a Sux behaviour is often observed as shown inFigure 6. The Sux declines atRrst rapidly with time; then the speed ofSux decline decreases, andRnally asteady stateis reached where the Sux does not decrease anymore. The decrease in Sux is commonly ascribed to two phenomena:cake-layer build-upandfouling.
WhenRltering a suspension, the membrane retains suspended particles. The particle concentration near the membrane will therefore gradually increase. Cake-layer build-up will occur when the particle con-centration near the membrane surface reaches the maximum packing density (0.6}0.7). Cake-layer build-up is thus caused by the particles that are retained by the membrane based on their size, independent of any speciRc interaction between these
particles and the membrane. Cake-layer build-up in microRltration is a phenomenon similar to concentra-tion polarizaconcentra-tionin ultraRltration.
Fouling, on the other hand, is based on a direct contact between solutes and the membrane surface. The term ‘fouling’ includes many processes, such as adsorption and deposition of macromolecules, bac-teria, or small organic molecules on the membrane surface or within the pores. Fouling increases the hy-draulic resistance against permeateSow, and thus re-duces the capacity of the microRltration process. More-over, fouling in general increases the observed retention of the membrane as it reduces the effective pore size.
If one plots the steady-stateSux for crossSow micro-Rltration versus transmembrane pressure (P) often a curve as given inFigure 7is obtained. Three regimes can be observed. For low values of P, theSux in-creases linearly with P and often equals the pure water Sux. For higher values of P, the Sux curve bends, because of cake-layer build-up, andSuxes be-come less than the pure waterSux. The point where the deviation from the straight line starts is often referred to as thecriticalUux. For even higherP, the Sux is independent of the pressure. This pressure inde-pendentSux value is referred to as thelimitingUux. Factors In]uencing Membrane Fouling and Cake-layer Build-up
The extent of membrane fouling and cake-layer build-up depends on many parameters, which can be grouped in three main contributors:
E properties of the membrane, E properties of the suspension, and
Figure 7 Steady-state flux versusP for the cross-flow micro-filtration of a silica particle suspension.**, water; - - -䊐- - -, silica particle suspension.
roughness, and pore-size distribution. In general, macromolecular adsorption is more severe for hydro-phobicthan for hydrophilic membranes. Fouling by negatively charged colloids is less for negatively charged membranesthan for uncharged or positively charged membranes. As most colloids in practical suspensions acquire a negative charge, negatively charged membranes are preferred in general. Mem-brane fouling is further reduced by choosing membranes with smooth surfaces, small pore sizes, andnarrow pore size distributions.
Feed suspension properties of importance are par-ticle concentration, parpar-ticle charge (zeta potential), ionic strength, and overall composition. The amount of cake-layer build-up increases withparticle concen-tration. Charge effects can reduce fouling by mem-brane-particle repulsion, and can reduce cake-layer build-up by particle}particle repulsion. Such charge effects are less pronounced at highionic strength, as the ions present in solution ‘shield’ the charge of membrane and particles. Overall composition of the feed suspension is of great importance for the fouling behaviour. Fouling may be caused not only by the main particles retained, but also by macromolecules and small organic molecules, which ‘geometrically’ should pass through the pores easily.
Process properties of importance are the transmem-brane pressure and the cross-Sow velocity. Low foul-ing normally occurs at lowtransmembrane pressures and high cross-Uow velocities. More detailed in-formation is given in a later section.
Calculating the Limiting Flux
To calculate the limiting steady-stateSux, local mass balances near the membrane surface are used. It is
then assumed that the limitingSux is reached when the amount of particles transported towards the membrane by the permeateSux (convection) equals the amount of particles transportedaway from the membrane by the cross-Sow. The cross-Sow can cause back-transport by at least four different mecha-nisms:
E Brownian diffusion, E shear-induced diffusion, E inertial lift, and
E surface transport.
In the following, these mechanisms will be ex-plained. It is assumed throughout this section that the particles are spherical and monodisperse, and that long-term fouling and physicochemical interactions are negligible.
Brownian diffusion If back-transport is caused by Brownian diffusion the standard concentration polar-ization theory can be used, employing the Brownian diffusion coefRcient for spherical particles:
D" kT 60a
[9]
wherekis the Boltzmann constant,Tis temperature, andais the particle radius. By numerical calculations, using a suspension viscosity that depends on the par-ticle concentration, it can be shown that the Sux is given by:
J"0.0769
wk 2T230a2L
1/31/3
b [10]
wherew is the wall shear stress andL is the mem-brane length.
Eqn [10] predictsSuxes of the right order of mag-nitude for suspensions of small particles (up to about 10 nm). It under-predictsSuxes by one or two orders of magnitude if applied to suspensions of larger par-ticles. This discrepancy is called the ‘Sux paradox’. This paradox is explained by assuming that there are other mechanisms for back transport, apart from Brownian diffusion.
Figure 8 Torque balance for the surface transport model. F
O"horizontal drag force caused by the cross flow;FJ"vertical
drag force caused by the permeate fluxJ ; Fi"particleIparticle
interaction force;"angle of repose.
It can be calculated, using an empirical value of the shear-induced diffusion coefRcient, that the limit-ingSux is given by:
J"0.060w 0
a4(1!3.8 b)
bL
1/3
[11]
valid for b(0.2, i.e. for all practical applications. Eqn [11] has been shown to give good Sux predic-tions for suspensions of hard spherical particles, and reasonable Sux predictions for complex bioSuids such as milk. Although eqn [11] is derived for local viscous Sow, Sux calculations have also been re-ported to be accurate for many turbulent Sow processes.
Inertial lift If a diluted suspension of particlesSows through a duct, particles present close to the wall will migrate towards the centre, perpendicular to the streamlines. This migration, caused by complex hy-drodynamic interactions, is called inertial lift. In cross-Sow microRltration, inertial lift may be able to prevent particles from depositing onto the membrane. To model this phenomenon, it is assumed that a cake layer builds up during microRltration until the con-vective velocity towards the membrane (the Sux J) equals the lift velocity,vL,awayfrom the membrane:
J"vL"0.0360a 32
w
3 0
[12]
The inertial lift theory neglects the inSuence of a par-ticle on the motion of another parpar-ticle, resulting in aSux equation which does not depend on the particle concentration. The inertial lift model is therefore only valid for very low particle concentrations. As theSux predicted by eqn [12] increases with the cube of the particle size and the square of the wall shear stress, inertial effects are expected to be important only for large particles ('5m) and high cross-Sow vel-ocities (w'10 N m\2).
Surface transport A particle on top of aRlter cake is subject to different forces, as shown inFigure 8. The horizontal drag force caused by the cross-Sow FOexerts a clockwise torque on the particle, and the vertical drag force caused by the permeate Sux FJ exerts a counterclockwise torque. If the torque caused by the cross-Sow is larger than the torque caused by the permeateSux, the particle canrollover the cake layer to the outlet of the membrane. This mechanism of transport is called surface transport.
Equating the clockwise torque with the anticlock-wise torque, an equation for the limiting Sux is
obtained:
J" 2.36aw
0tan(a2RKc)2/5
[13] whereis the angle of repose (see Figure 8).
Just as for the inertial lift model, the present model neglects the inSuence of a particle on the motion of another particle, resulting in a Sux equation which does not depend on the particle concentration. Eqn [13] overpredictsSuxes for typical microR ltra-tion condiltra-tions by an order of magnitude or more. Two of the models described above, the Brownian diffusion model and the shear-induced diffu-sion model, use a continuum approach. The other two, the inertial lift model and the surface transport model, are based on asingle-particle approach. The single-particle approach is only valid for low particle concentrations and large particles.
In Figure 9, the Suxes predicted by the two con-tinuum models are given as a function of particle size for typical cross-Sow microRltration conditions. The Sux predicted by the inertial lift model is plotted in the same graph to indicate the order of magnitude of inertial effects. For small particle sizes, Brownian effects dominate and the Sux decreases with particle size. For intermediate particle sizes, shear-induced diffusion dominates and the Sux increases with particle size. For large particle sizes ('5m) inertial effects dominate causing theSux to increase even faster with particle size.
The combined effect of Brownian and shear-in-duced diffusion can be described by:
Figure 9 Flux calculated according to different models as a function of particle diameter. Calculations were performed for
w"32 N m\2, b"10\3, andL"1.2 m, using eqns [10]}[12]
for the Brownian, shear-induced, and inertial-lift models, and using eqn [14] for combining Brownian and shear-induced diffu-sion, - - - -, Brownian diffusion model; ) ) ) ) ) ), shear-induced diffusion model;*, Brownian and shear-induced diffusion model;
22, inertial lift model.
Figure 10 Flux and amount of matter deposited on the mem-brane as a function of time for the filtration of a suspension of 0.48-m silica particles. Circles represent experimental values for a particle concentration of 1.7 kg m\3, a transmembrane
pres-sure of 0.42 bar and a cross flow velocity of 1 m s\1; lines
repres-ent model calculations.
Figure 11 Feed-and-bleed operational configuration for cross-flow microfiltration.
where JBois the Sux according to Brownian theory, eqn [10], and JSI is the Sux according to shear-induced theory, eqn [11]. Predictions according to eqn [14] are also given in Figure 9.
Calculating the Transient Behaviour of Cross-]ow Micro\ltration
The time dependence of the Sux can be predicted using an approach as outlined in the section on dead-endRltration, yet allowing for back-transport accord-ing to the particle transport mechanisms described above. Such descriptions are rather complicated, and will not be treated here.
A simple but effective approach to model the tran-sient behaviour of the permeate Sux is the use of a combination of transient dead-endRltration theory and a cross-SowRltration model for the steady-state (limiting)Sux. While the cake is initially developing, the effect of the cross-Sow is small and can be neglect-ed, so that cross-SowRltration theory can be approxi-mated by dead-endRltration theory. Upon approach-ing the steady state, the cross-Sow begins to arrest the cake growth and dead-end Rltration theory is no longer accurate. However, near the steady state the Sux shows only minor time dependence, and theSux can be approximated by its steady-state value.
The procedure to predict the total transient behav-iour of the permeate Sux is thus to use dead-end Rltration theory (see the section on dead-end microR l-tration) until the time the steady-stateSux is reached and then use the steady-state Sux predicted by
a steady-state cross-Sow Rltration model. This ap-proach is illustrated inFigure 10, modelling the tran-sient Sux and cake-layer build-up in the cross-Sow microRltration of a suspension of silica particles.
Process Considerations
Cross-Sow microRltration is usually carried out in the feed-and-bleed mode, shown inFigure 11. The use of a retentate recycle makes it possible to work at high cross-Sow velocities (high Qc) while having low retentate Sows (i.e. high volumetric concentration factors Vc"1#QP/QR). When high concentration factors are desired, several recirculation loops may be placed in series, or in even more complicated schemes, with loops both in parallel and in series (Christmas tree design).
Figure 12 Microfiltration flux when filtering a particle suspen-sion, with and without backflush.
(about 0.5 bar) for several seconds every few minutes (Figure 12).
Fouling is reduced by high cross-Sow velocities and low transmembrane pressures. High cross-Sow vel-ocities cause high-pressure drops along the membrane, which cause the P to be undesirably high at the entrance of the membrane module. Therefore microR l-tration processes have been developed which facilitate a cross-Sow both on the feed side and on the permeate side. The pressure drops on both sides are similar in magnitude, guaranteeing a uniform transmembrane pressure. This method of operation has been shown to be effective in many dairy applications.
Other process techniques to reduce fouling are the use of pulsedSow, gas sparging, and electric or acous-ticRelds, and the use ofSow geometries that create secondary Sows or vortices resulting in high shear rates (e.g. the use of ‘turbulence promoters’ or curved channels).
Conclusions
Over the last 70 years, microRltration has developed from a small specialized technology used only in
laboratories to a multibillion dollar industry for separation and puriRcation of liquid and gas streams. Especially since the 1980s, exciting new applications have become possible, due to improved membranes (for example, ceramics) and improved technologies (for example, backpulsing, uniform transmembrane pressure). Still, great challenges exist, for example in the processing of beverages, such as fruit juices, milk, and beer, where membrane fouling seriously impairs the economy of the process.
To overcome these problems, researchers and en-gineers are becoming increasingly interested in hybrid and combined processes. Combining microRltration with good pre- and post-treatments or with other separation processes may result in better and more economic separations.
See also: II/Membrane Separations: Filtration.
Further Reading
Belfort G, Davis RH and Zydney AL (1994) The behavior of suspensions and macromolecular solutions in cross-Sow microRltration.Journal of Membrane Science 96: 1}58.
Bowen WR and Jenner F (1995) Theoretical descriptions of membrane Rltration of colloids and Rne particles: an assessment and review.Advances in Colloid and Inter-face Science56: 141}200.
Ho WSW and Sirkar KK (1992) Membrane Handbook. New York: Van Nostrand Reinhold.
Howell JA, Sanchez V and Field RW (1993)Membranes in Bioprocessing } Theory and application, 1st edn. London: Chapman and Hall.
Mulder M (1992)Basic Principles of Membrane Techno-logy, 1st edn. Dordrecht: Kluwer Academic Publishers. Scott K (1995) Handbook of Industrial Membranes.
Oxford: Elsevier Science.
Zeman LJ and Zydney AL (1996) MicroTltration and UltraTltration. Principles and Applications. New York: Marcel Dekker.
Pervaporation
H. E. A. BruKschke and N. P. Wynn,
Sulzer Chemtech GmbH, Neunkirchen, Germany
Copyright^ 2000 Academic Press
Development
In 1917 PA Kober published a paper in which he described his observation that ‘a liquid in a collodion