Ames Laboratory Conference Papers, Posters, and
Presentations
Ames Laboratory
2012
A Computational Strategy for Design and
Implementation of Equipment That Addresses
Sustainable Agricultural Residue Removal at the
Subfield Scale
David J. Muth Jr.
Idaho National Laboratory, dmuthjr@gmail.com
Joshua Koch
Idaho National Laboratory
Douglas S. McCorkle
Iowa State University, doug@agsolver.com
Kenneth M. Bryden
Iowa State University, kmbryden@iastate.edu
Follow this and additional works at:
http://lib.dr.iastate.edu/ameslab_conf
Part of the
Biomechanical Engineering Commons
This Conference Proceeding is brought to you for free and open access by the Ames Laboratory at Iowa State University Digital Repository. It has been accepted for inclusion in Ames Laboratory Conference Papers, Posters, and Presentations by an authorized administrator of Iowa State University Digital Repository. For more information, please contactdigirep@iastate.edu.
Recommended Citation
Muth, David J. Jr.; Koch, Joshua; McCorkle, Douglas S.; and Bryden, Kenneth M., "A Computational Strategy for Design and Implementation of Equipment That Addresses Sustainable Agricultural Residue Removal at the Subfield Scale" (2012).Ames Laboratory Conference Papers, Posters, and Presentations. 90.
A Computational Strategy for Design and Implementation of Equipment
That Addresses Sustainable Agricultural Residue Removal at the Subfield
Scale
Abstract
Agricultural residues are the largest potential near term source of biomass for bioenergy production.
Sustainable use of agricultural residues for bioenergy production requires consideration of the important role that residues play in maintaining soil health and productivity. Innovation equipment designs for residue harvesting systems can help economically collect agricultural residues while mitigating sustainability concerns. A key challenge in developing these equipment designs is establishing sustainable reside removal rates at the sub-field scale. Several previous analysis studies have developed methodologies and tools to estimate sustainable agricultural residue removal by considering environmental constraints including soil loss from wind and water erosion and soil organic carbon at field scale or larger but have not considered variation at the sub-field scale. This paper introduces a computational strategy to integrate data and models from multiple spatial scales to investigate how variability of soil, grade, and yield within an individual cornfield can impact sustainable residue removal for bioenergy production. This strategy includes the current modeling tools (i.e., RUSLE2, WEPS, and SCI), the existing data sources (i.e., SSURGO soils, CLIGEN, WINDGEN, and NRCS managements), and the available high fidelity spatial information (i.e., LiDAR slope and crop yield monitor output). Rather than using average or representative values for crop yields, soil characteristics, and slope for a field, county, or larger area, the modeling inputs are based on the same spatial scale as the precision farming data available. There are three challenges for developing an integrated model for sub-field variability of sustainable agricultural residue removal—the computational challenge of iteratively computing with 400 or more spatial points per hectare, the inclusion of geoprocessing tools, and the integration of data from different spatial scales. Using a representative field in Iowa, this paper demonstrates the computational algorithms used and establishes key design parameters for an innovative residue removal equipment design concept.
Keywords
Design, Sustainability
Disciplines
Biomechanical Engineering
Comments
This proceeding is fromASME 2012 International Design Engineering Technical Conferences and Computers and Information in Engineering Conference, Vol. 2: 32nd Computers and Information in Engineering Conference, Parts A and B. (2012): 1287–1294, doi:10.1115/DETC2012-71430. Posted with permission.
Proceedings of the ASME 2012 International Design Engineering Technical Conferences & Computers and Information in Engineering Conference IDETC/CIE 2012 August 12-15, 2012, Chicago, IL, USA
DETC2012-71430
A COMPUTATIONAL STRATEGY FOR DESIGN AND IMPLEMENTATION OF
EQUIPMENT THAT ADDRESSES SUSTAINABLE AGRICULTURAL RESIDUE
REMOVAL AT THE SUBFIELD SCALE
David Muth, Jr.
Idaho National Laboratory, U.S. Dept. of Energy Idaho Falls, ID, U.S.A.
ABSTRACT
Douglas McCorkle
Ames Laboratory, U.S. Dept. of Energy Ames, lA, U.S.A.
Agricultural residues are the largest potential near term source of biomass for bioenergy production. Sustainable use of agricultural residues for bioenergy production requires consideration of the important role that residues play in maintaining soil health and productivity. Innovation equipment designs for residue harvesting systems can help economically collect agricultural residues while mitigating sustainability concerns. A key challenge in developing these equipment designs is establishing sustainable reside removal rates at the sub-field scale. Several previous analysis studies have developed methodologies and tools to estimate sustainable agricultural residue removal by considering environmental constraints including soil loss from wind and water erosion and soil organic carbon at field scale or larger but have not considered variation at the sub-field scale. This paper introduces a computational strategy to integrate data and models from multiple spatial scales to investigate how variability of soil, grade, and yield within an individual cornfield can impact sustainable residue removal for bioenergy production. This strategy includes the current modeling tools (i.e., RUSLE2, WEPS, and SCI), the existing data sources (i.e., SSURGO soils, CLIGEN, WINDGEN, and NRCS managements), and the available high fidelity spatial information (i.e., LiDAR slope and crop yield monitor output). Rather than using average or representative values for crop yields, soil characteristics, and slope for a field, county, or larger area, the modeling inputs are based on the same spatial scale as the precision farming data available. There are three
Joshua Koch
Idaho National Laboratory, U.S. Dept. of Energy Idaho Falls, ID, U.S.A.
Kenneth Bryden
Iowa State University Ames, lA, U.S.A
challenges for developing an integrated model for sub-field variability of sustainable agricultural residue removal-the computational challenge of iteratively computing with 400 or more spatial points per hectare, the inclusion of geoprocessing tools, and the integration of data from different spatial scales. Using a representative field in Iowa, this paper demonstrates the computational algorithms used and establishes key design parameters for an innovative residue removal equipment design concept.
INTRODUCTION
The DOE released a study in 2005 that identified scenarios with over 270 million metric tons of agricultural residue biomass (i.e., materials other than grain including stems, leaves, and chaff) available annually in the US [1]. Assuming a biomass to biofuel conversion rate of 330 liters per metric [2,3], this resource base could produce over 89 billion liters of biofuels annually. Federal legislation through the Energy Independence and Security Act of 2007 calls for US biofuel production to increase above 136 billion liters annually by 2022. If this federal requirement is met, agricultural residues will play an essential role.
The challenge is that agricultural residue removal must be managed carefully to be sustainable. Residues play a number of critical roles within the agronomic system that must be considered when making removal decisions [4-6]. There are six environmental factors that can limit sustainable agricultural residue removal-soil organic carbon, wind and water erosion,
l Copyright © 2012 by ASME
plant nutrient balances, soil water and temperature dynamics, soil compaction, and off-site environmental impacts [7]. Previous efforts have assembled a set of modeling, simulation, and database tools to support investigation of these factors. The challenge is that these tools are disparate and focused on a specific environmental process for which they were developed. The question of sustainable agricultural residue removal requires the integration of these disparate tools to more comprehensively support decisions. Furthermore, the practical implementation of sustainable agricultural residue removal requires the design and development of residue harvesting equipment that can adjust to variability in field conditions that change sustainable residue removal rates at the sub-field scale. Design, development, and commercial implementation of residue harvest equipment with variable rate residue removal capability requires a computational strategy that can (1) establish equipment performance requirements as design parameters, (2) evaluate the effectiveness of equipment design concepts, and (3) provide real-time sustainable residue removal assessments for the equipment control systems. This paper develops a computational strategy for multi-scale analysis of residue removal that meets the first of these equipment design and implementation criteria, establishing performance requirements of variable rate residue removal equipment as design parameters. The computational strategy implements a model and data integration framework built on the following premises:
1. The use of well-developed and validated models and databases provides significant advantages in terms of quickly achieving results that can provide confidence in residue removal decisions.
2. Capable tools supporting model and data integration for complex decision making have emerged within the engineering community and can be applied to the residue removal problem.
3. Data from multiple spatial and temporal scales is required for the model and data integration framework to establish equipment design parameters and make sustainable residue removal decisions.
The first step in executing the model and data integration strategy is identifying the model and database tools that provide a sufficiently comprehensive analysis of the scenarios and also satisfy the decision making requirements stated above. With the appropriate modeling and database tools identified, the study was executed to deliver a product satisfying the stated requirements.
BACKGROUND
Past agricultural crop residue removal modeling efforts have focused on soil erosion from wind and water. Residue removal has been considered sustainable for removal rates where computed erosion losses are less than the tolerable soil loss limits established by the NRCS. Larson [9] used the Universal Soil Loss Equation in 1979 to perform the first major assessment of the sustainability of removing agricultural residues. This study examined soils and production systems in
the Com Belt, the Great Plains, and the Southeast US. Residue removal was investigated under a range of tillage practices with respect to erosion constraints and potential nutrient replacement requirements. The broader issue of soil health and long term productivity, specifically soil organic carbon levels, was not considered.
The Revised Universal Soil Loss Equation [10] and Wind Erosion eQuation [11] were used by Nelson in 2002 [12] to estimate sustainable removal rates of com (Zea mays L.) stover and wheat (Triticum aesivum L.) straw. This study expanded Larson's analysis through the use of the Soil Survey Geographic (SSURGO) Database [13], an open access national soil survey database provided by NRCS. Nelson's methodology considered water and wind induced erosion for SSURGO soil map units, the unique identifiers for soils with different characteristics, for reduced and no tillage management practices. This study was based on "county average, hectare-weighted fields." The approach developed county level composite soil characteristics that were used to establish erodibility factors for the erosion equations. The Nelson study found that in 1997 the midwestern and eastern United States could have sustainably supplied more than 58 million metric tons of com stover and wheat straw. Extending and updating this methodology in 2004, Nelson et al. [14] included five one-and two-year crop rotations (e.g., com-soybean [Glycine max (L.) Merr.]) and calculated erosion at the SSURGO soil map unit spatial scale. At the soil map unit scale, residue retention requirements were established for each management scenario using county average crop yields. Each soil was assessed using the representative slope from the SSURGO database. This study considered wind and water induced soil erosion constraints and found that if all acres were in a com-soybean rotation using reduced tillage practices; nearly 398 million metric tons of agricultural residues could be sustainably removed annually from the 10 highest com grain producing states in the United States. Graham et al. [15] utilized Nelson's methodology to perform a nationwide com stover availability assessment. The spatial scale of data and analysis assumptions were consistent with Nelson's, but an additional constraint was added to this by restricting stover removal from non-irrigated production in dry climates. This constraint was included based on an assumption that for non-irrigated production in dry climates, all stover was required on the soil surface to help maintain soil moisture levels. Including this additional constraint, Graham et al. [15] found that sustainable national stover potential was nearly 106 million metric tons annually.
[16]In recent years the NRCS has transitioned to process-based analyses by adopting the Revised Universal Soil Loss Equation 2 (RUSLE2) [16], the Wind Erosion Prediction System (WEPS) [17], ,Soil Conditioning Index (SCI) [18] models for conservation management planning. The NRCS field office implementation of RUSLE2, WEPS, and SCI utilizes representative soil and slope, and field average yield assumptions to analyze a management plan for a particular field [19]. The choice for a representative soil and slope are based on selecting the "dominant critical" soil area. The NRCS field
office technical note describes the dominant critical soil area as having the following characteristics, (l) it is significantly large enough to effect a change in management, (2) it is not an average of the field characteristics, (3) it is not the worst case scenario, and (4) if dominant in terms of area it is not the flattest or least erosive soil in the field. There are two primary questions the models are used to answer. The first is whether soil loss due to erosion is greater than the tolerable soil loss limits (T value) set by the NRCS for each SSURGO database soil type. The second question is whether the SCI is greater than 0, which qualitatively suggests that soil organic carbon levels will not be depleted for a given scenario.
As currently implemented in NRCS field offices, the tools require direct user interaction for each simulation scenario, thus limiting their application to high fidelity spatial and temporal scenario assessment. Scenario assessment is a time consuming task in which data from one or more databases is formatted as input for one model, and then the output is combined with other data to become input for the other models. One way to address this concern is through an integrated modeling approach that takes advantage of the simulation capabilities of process-based environmental models and implements them within a modeling framework that facilitates hands-free model execution. This approach was used in a study by [8] that investigated residue removal for the state of Iowa considering wind and water induced erosion, and soil organic carbon as potential limiting factors. This study was performed using an integrated modeling toolkit that coupled the RUSLE2, WEPS, and SCI models with the SSURGO, CLIGEN [20], WINDGEN [21], and NRCS management practice [22] databases. This assessment determined that under current crop rotations, grain yields, and tillage management practices, nearly 26.5 million metric tons of agricultural residue could be sustainably removed in Iowa.
None of the current modeling approaches supports analysis of the impact of sub-field scale variability on the design and implementation of residue harvesting equipment which maximizes the sustainable removal of residue. However, the high fidelity spatial data necessary to perform sub-field scale analyses are becoming increasingly available. The high fidelity spatial data available for these analyses include crop yield data from combine harvesters and high resolution digital elevation models (DEMs) describing surface topography.
High Fidelity Spatial Data
GPS technologies and precision agriculture concepts which emerged in the 1990s resulted in a number of techniques and methodologies for acquiring and using high fidelity spatial information in agricultural production systems (Stafford, 2000). One of the most widely utililzed products has been harvester yield monitors. These datasets are acquired directly from harvester yield monitors are typically in the form of ESRI™ shapefiles [23]. These datasets provide significant detail at a sub-field scale. For example, a typical yield monitor output can contain over 400 yield measurements per hectare, and point -to-point yield across the field may vary by a factor of more than
10.
Surface slope impacts the spatial variability of several important agricultural productivity characteristics including soil water [24], agronomic variables [25] and crop yields [26]. High fidelity surface topology is available in the form of digital elevation models (DEMs). DEMs have been developed for agricultural lands using several different approaches. These include the use of U.S. Geological Survey (USGS) produced national datasets [27] and more recently the use of light detection and ranging (LiDAR) through airborne laser scanning [28]. Several states, including Iowa, have worked toward LiDAR mapping of the entire state. In Iowa this effort is moving forward through the GeoTREE LiDAR mapping project [29]. LiDAR mapping is the highest fidelity surface slope data currently available and provides a more accurate representation of relatively low slope agricultural land than the USGS produced DEMs [30]. Based on this, LiDAR data assembled through the GeoTREE project are utilized in the work presented here.
Soil characteristics such as organic matter and sand fraction in the topsoil horizon have significant spatial variability and can impact crop yields and availability of agricultural residue for removal. The SSURGO database provided by NRCS is available through several web-based access points. Soil characteristic data in SSURGO are represented at approximately a 10-100 m scale.
SUBFIELD INTEGRATED MODELING STRATEGY Noting the variability of crop yields reported by precision harvesting, the variability of slope, and the variability of soil characteristics across individual fields, it has been shown there is also significant sub-field variability in sustainable agricultural residue removal rates[3l]. This paper develops an integrated model for guiding the design and implementation of residue harvesting equipment that is capable of adjusting to sub-field variability of sustainable agricultural residue removal. This model includes current modeling tools (i.e., RUSLE2, WEPS, and SCI), existing data sources (i.e., SSURGO soils, CLIGEN, WINDGEN, and NRCS managements), and available high fidelity spatial information (i.e., LiDAR slope and crop yield monitor output). The basic modeling process remains the same as earlier investigations of sustainable agricultural residue removal. The difference is that instead of modeling based on average or representative values for crop yields, soil characteristics, and slope for a field, county, or larger area, the modeling inputs are based on the same spatial scale as the precision farming data available. There are three challenges for developing an integrated model for sub-field variability of sustainable agricultural residue removal-the computational challenge of iteratively computing with 400 or more spatial points per hectare, the inclusion of geoprocessing tools, and the integration of data from different spatial scales. The starting place for the sub-field model developed here is the earlier integrated model developed by Muth and Bryden [8]. The model was built using the VE-Suite integration framework [33], which enables extension and updating of the models, databases,
3 Copyright © 2012 by ASME
and framework as needed without rev1s10n of the existing components.
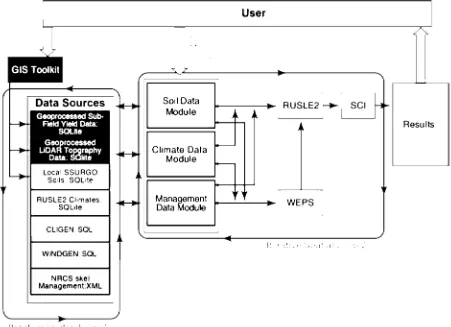
Figure 1 shows the dataflow within the sub-field integrated model. As shown, the computational challenge of iteratively computing sustainable residue removal is handled by updating the scheduling algorithm. Two iterative loops are used. The first assembles databases with all needed information for each crop yield data point input as an ESRI shapefile. Following completion of this task, the second loop uses the data and RUSLE2, WEPS, and SCI models to simulate the environmental processes for each spatial location and management scenario of interest. For this study about 1,200 model executions per hectare ( 400 spatial elements, 1 management scenario, 3 model executions [RUSLE2, WEPS, SCI] per spatial element) are required. Upon completion of the scenario runs, the model results are provided back to the user through an SQLite database that includes references to the original yield data point shapefile. The results are formatted for simple interaction through standard mapping and visualization tools. The database of results is also equipped with a set of queries that provide the user with the model results in numeric form.
The geoprocessing tool used in this project is ESRI™ ArcGIS 10. ESRI™ ArcGIS 10 was chosen because it has automated and commercially supported geoprocessing algorithms to perform the functions required for data processing in this study. An SQLite database structure is integrated into the model to provide management of the high fidelity yield and topography datasets. The SQLite databases contain the necessary data for the soil, climate, and management data modules to assemble and organize the model input data. The computational scheduling algorithm packages the information and calls the models as needed. The resulting data are then accessible via an SQLite database.
Assembly of the needed data requires resolving information at different spatial scales between the various databases. RUSLE2 has been developed with the base computation unit as a single overland flow path along a hill slope profile. For a particular field a number of overland flow paths may exist. For conservation planning a particular overland flow path is selected to represent a field, and a management practice is selected that controls erosion adequately for that flow path profile. The conservation management planning application of RUSLE2 requires selection of a representative soil, slope, slope length, and yield that are considered constant for the field. To use RUSLE2 at the sub-field scale, the assumption is made that the soil, slope,
and yield characteristics at each spatial element provide the representative overland flow path for the field. In earlier studies, the representative values used were based on the primary factors of concern at a local scale. These factors were then used to create a representative area weighted average applicable at a larger scale. In this study those primary factors are used directly at a local scale and then aggregated. This is a reasonable approach but must be applied with care. Each spatial element does not exist as an independent entity but rather is influenced by its neighboring elements. Even so, significant insight can be gained by applying RUSLE2, WEPS, and SCI at a spatial element basis. A similar assumption is made for the WEPS model. WEPS models a three-dimensional simulation region representing a field or small set of adjacent fields. Using WEPS for conservation planning also requires the selection of a representative soil, slope, and yield. The assumption made to use WEPS in the sub-field scale integrated model is that the soil, slope, and yield characteristics for a spatial element in question are representative for a field scale simulation region. The SCI is modeled for each spatial element by using the SCI sub-factors calculated by RUSLE2 and WEPS using the assumptions as stated.
RESIDUE REMOVAL EQUIPMENT DESIGN PARAMETERS
This study uses the sub-field integrated model to establishing performance requirements for residue removal equipment design concepts that can react to the issues associated with sub-field scale variability. The design parameters are to maximize the residue removed while maintaining sustainable land management practices measured by erosion as soil carbon metrics as described previously. The sub-field integrated modeling strategy using the framework shown in Fig. 1 is executed across a set of potential removal rates ranging from 0% to 80% removal. This adds an additional 36 model executions for each spatial element resulting in nearly 43,200 model execution per hectare. At each spatial element the maximum sustainable removal rate is established as the highest rate which has a tolerable soil loss from erosion and does not cause a loss in soil carbon. The data layer built through this computational process establishes the equipment performance requirements and basic design parameters for a residue harvester which can adapt to sub-field changes in sustainable residue removal rates.
RUSLE2 Cl,mates SOL1te
CLIGEN SOL
WINDGEN SOL
NAGS skel Management:XML
It· ',:t •' .; :' I I 'I '
Soil Data Module
Cltmate Data Module
Management Data Module
Figure L The subfield integrated modeling framework
Model Validation
The initial integrated model coupling RUSLE2, WEPS, and SCI was verified to provide the same conclusions as the NRCS field office versions of the models as described in Muth and Bryden [8]. However, in the case of sub-field sustainability of agricultural residue removal, there are no computational or experimental results available for validation. Because of this, the code was validated in two ways. In the first, the high fidelity spatial databases were populated with the same field average data as is used in the NRCS field office implementation. The code was then run and summarized at the sub-field scale, demonstrating that the code properly called, formatted, computed, and assembled the data needed. In each case the integrated sub-field model provided the same conclusions as the standard model use cases. In the second way, the code was used to analyze several fields, and the results were examined for reasonableness and to ensure the results could be explained.
RESULTS
The sub-field integrated modeling strategy was applied for a 57 ha field in Cerro Gordo County, Iowa in the north central part of the state. The application of the modeling strategy for this field is focused on developing residue harvester equipment design parameters meeting the objectives of maximizing the
User
RUSLE2--...
Results
WEPS
amount of residue collected and sustainably managing the entire field. The field used in this study has diverse soil characteristics with soil organic matter ranging from 1.5% to 7.5% (Fig. 2a) and sand fractions ranging from 17.8% to 87.0% (Fig. 2b) in the top layer of the soil. These are important sub-field characteristics because organic matter is critical for long term productivity of the soil, and sand fraction can be an indicator of susceptibility to soil loss through erosion. Areas of low organic matter and high sand fraction correlate with the higher surface slopes shown in Fig. 2c. These field characteristics have a negative impact on grain yield, as shown in Fig. 2d. Muth et al. (20 12) determined that only 21% of Field 1 would be managed sustainably with existing commercially available residue removal equipment due to the significant diversity in soil and surface slope characteristics. The design parameters for equipment that adapts to the sub-field variability in removal rate are established by executing the sub-field modeling strategy for residue removal rates from 0% to 80%. The specific removal increments investigated are 0% and 25% to 80% at 5% increments. Figure 2e shows the sustainable residue removal fraction across the case study field. Figure 2f shows sustainable residue removal ranging from 0 to over 5 Mg ha-1. The areas with low grain yield do not sustainably support
any residue removal. Specifically, for grain yields below approximately 5 Mg ha-1 the minimum removal rate of 25% is
5 Copyright © 2012 by ASME
[image:7.612.82.533.72.399.2]too high for sustainable removal. It is also shown that sustainable removal fraction increases in areas of the field where soil organic matter is higher.
Figure 2e provides spatially explicit perspective on the equipment performance requirements for a residue harvester
Organic Matter in top horizon (%)
D 1.50 0 1.51-2.00 0 2.01-3.50 • 3.51-5.50 • 5.51-7.50
Surface Slope (%)
0 0-1.06 0 1.07-1.31
D 1.32-1.55
D 1.56-1.79 0 1.80-2.04 0 2.05-2.28 0 2.29-2.77 • 2.78-3.26 • 3.27-4.24
(a)
(c)
designed to adapt to the sub-field scale variability in sustainable removal rate. Areas of the field can be found at all of the modeled residue removal rates. This leads to the conclusion that maximizing the removed residue for bioenergy production while managing the land sustainably for this case study field
Sand Fraction in top horizon (%)
017.80 0 17.81-40.00 0 40.01-42.10 • 42.01-65.00 • 65.01-87.00
Grain Yield (Mg ha-1)
0 0-3.13 0 3.14-4.39 0 4.40-5.64 0 5.65-6.89 0 6.90-8.15
(b)
(d)
0 8.16-9.40 . - . . 0 9.41-10.66 ., _ _
*
~
·
• 11.92-13.17 -• 4.25-18.14
D 10.67-11.91
-~-
· ·_0 •
. . • • 13.18-14.42 ' - . . • 14.43-15.68 .. . .
Removal Fraction
(%)
00% 025% 030% 035% 040% 044% 050% 055% 060% .65% .70% .75% .80%
(e)
Residual Removal Rate
(Mg ha-1)
0 o-0.56 0 0.57-1.12 0 1.13-1.68 0 1.69-2.24 0 2.25-2.80 0 2.81-3.36 0 3.37-3.92 • 3.93-4.48 • 4.49-5.04 • 5.05-5.60
(f)
12-GA50016-04 Figure 2. Subfield scale sustainable residue removal analysis results.
[image:8.612.43.555.144.688.2]~ c:
.g
:I
..c
·.s VI
i5
""C
Qj
u::
30%
25%
20%
15%
10%
5%
0%
Removal Rate Distribution
0 25 30 35 40 45 so 55 60 65 70 75 80
Residue Removal Rate (%)
100%
90%
80%
~
70%
QJ
60% ·.;::; >
50% ~
:I
40% E
:I
30% u
20%
10%
0%
Figure 3. Subfield residue harvester equipment performance requirements.
CONCLUSIONS
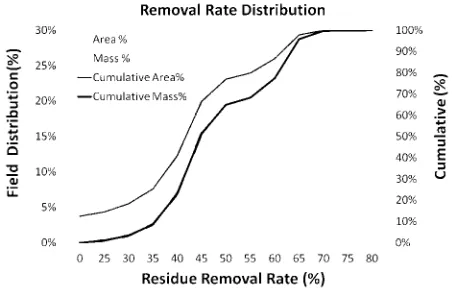
This paper develops a computational strategy to model the impact of sub-field scale variability on equipment performance parameters for agricultural residue removal. The computational strategy integrates together data inputs from multiple spatial scales, geoprocessing tools to facilitate interaction with high fidelity sub-field scale data, and models representing soil erosion from wind and water forces and soil organic matter. A computational scheduling algorithm is used to support integration of the multiple models, databases, and other information at the sub-field scale. The model was then used to examine a field in Iowa to examine the relationship between sub-field variability and residue harvester design parameter requirements to simultaneously meet the objectives of maximizing sustainable residue removal and managing the entire field sustainably. The results of the analysis show that for the case study field a residue harvester would have to adjust from 0% to 80% residue removal to maximize sustainable residue removal. However, a machine design that adjusts from 40% to 65% residue removals would collect 91% of the sustainably removable residue mass while managing the entire field sustainably. These results can potentially have significant impact on the cost and design parameters for residue harvesting equipment.
ACKNOWLEDGMENTS
This work was funded in part by the DOE's Office of Biomass Programs. The authors gratefully acknowledge the significant support from all partners in the DOE Biomass Regional Feedstock Partnership Program. The authors also gratefully acknowledge David Muth Sr. for providing study data. Professor Bryden gratefully acknowledges the funding support of the Sun Grant Initiative through the Biomass Regional Feedstock Partnership.
the equipment design would be required to adapt across the full range of 0% to 80% removal. One question that arises is whether a smaller range of residue removal would be nearly as effective. Figure 3 provides perspective on the machine performance requirements for the case study field by representing the spatially explicitly results in Fig. 2e to a histogram that the percentage of field area and percentage of sustainable agricultural residue collected at each of the modeled removal rates. Figure 3 shows that the 45% removal rate covers the largest percentage of the field and provides the largest percentage of the residue. Figure 3 also shows that in Field l, a residue harvester with the capability to adjust between 40%-65% residue removals would collect 91% of the sustainably removable residue mass.
REFERENCES
[l] Perlack, R.D., Wright, L.L., Turhollow, A.F., Graham, R.L., Stokes, B.J., Erback, D.C., 2005. Biomass as feedstock for a bioenergy and bioproducts industry: The technical feasibility of a billion-ton annual supply. DOE OBP. DOE/G0-102005-2135.
[2] Aden, A., Ruth, M., Ibsen, K., Jechura, J., Neeves, K., Sheehan, J., et al., 2002. Lignocellulosic biomass to ethanol process design and economics utilizing co-current dilute acid prehydrolysis and enzymatic hydrolysis for com stover. NREL/TP-510-32438.
[3] Phillips, S.D., Tarud, J.K., Biddy, M.J., Dutta, A., 20ll. Gasoline from wood via integrated gasification, synthesis, and methanol-to-gasoline technologies. NREL/TP-5100-47594.
[4] Karlen, D.L., Andrews, S.S., Wienhold, B.J., Doran, J.W., 2003. Soil quality: humankind's foundation for survival. J. Soil Water Conserv. 58(4), 171-179.
[5] Johnson, J.M.F., Reicosky, D., Allmaras, R., Archer, D., Wilhelm, W.W., 2006. A matter of balance: conservation and renewable energy. J. Soil Water Conserv. 61, l20A-l25A.
[6] Wilhelm, W.W., Johnson, J.M.F., Karlen, D.L., Lightle, D.T., 2007. Com stover to sustain soil organic carbon further constrains biomass supply. Agron. J. 99,
1665-1667.
[7] Wilhelm, W.W., Hess, J.R., Karlen, D.L., Johnson, J.M.F., Muth, D.J., Baker, J.M., et al., 2010. Balancing limiting factors and economic drivers for sustainable midwestern US agricultural residue feedstock supplies. Ind. Biotechnol. 6(5), 271-287.
[8] Muth, D.J., and K.M. Bryden. 2012. An integrated model for assessment of sustainable agricultural residue removal limits for bioenergy systems. Environ. Modell. Softw. In review.
[9] Larson, W.E. 1979. Crop residues: energy production or control? J. Soil Water Conserv. 34:74-76.
7 Copyright © 2012 by ASME
[image:9.612.48.276.80.224.2][10] Renard, K.G., G.R. Foster, G.A. Weesies, D.K. McCool, and D.C. Yoder. 1997. Predicting soil erosion by water: a guide to conservation planning with the Revised Universal Soil Loss Equation (RUSLE). Agricultural Handbook Number 703. USDA Agricultural Research Service, West Lafayette, IN.
[11] Fasching, R.A. 2006. Wind erosion equation -management period method Microsoft Excel spreadsheet. Agronomy Technical Note MT-76 (Rev. 3). USDA-NRCS, Bozeman, MT.
[12] Nelson, R.G. 2002. Resource assessment and removal analysis for com stover and wheat straw in the eastern and midwestern United States: rainfall and wind erosion methodology. Biomass Bioenergy 22:349-363.
[13] USDA-NRCS. 2011c. Soil Survey Geographic (SSURGO)
Database. Available at
http://soils.usda.gov/survey/geography/ssurgo/ (accessed 14 April2011, verified 14 Jan. 2012). NRCS, Washington, DC.
[14] Nelson, R.G., M. Walsh, J. Sheehan, and R. Graham. 2004. Methodology to estimate removable quantities of agricultural residues for bioenergy and bioproduct use. Appl. Biochem. Biotechnol. 113-116:13-26.
[15] Graham, R.L., R. Nelson, J. Sheehan, R.D. Perlack, and L.L. Wright. 2007, Current and potential US com stover supplies. Agron. J. 99: 1-ll.
[16] USDA-NRCS. 20 11b. Revised Universal Soil Loss Equation, Version 2 (RUSLE2). Official NRCS RUSLE2
Program. Available at
http:/ /fargo.nserl.purdue.edu/rusle2 _ dataweb/RUSLE2 _Ind ex.htm (accessed 15 Jun. 2011, verified 14 Jan. 2012). NRCS and USDA-ARS, Washington, DC.
[17] USDA-ARS and NRCS. 2008. Official NRCS-WEPS Site. Wind Erosion Prediction System. Available at http://www .weru.ksu.edu/nrcs/wepsnrcs.html (last accessed 15 Jun. 2011, verified 14 Jan 2012). NRCS and USDA-ARS, Washington, DC.
[18] USDA-NRCS. 2012. Using SCI to Assess Management
Effects on Soil Carbon. Available at
http:/ /soils. usda.gov /sqi!concepts/soil_ organic_ matter/som _sci.html (verified 14 Jan. 2012). USDA-NRCS, Washington, DC.
[19] USDA-NRCS Iowa 2008. Choosing the planning area of a field by "dominant critical area." USDA-NRCS Iowa Technical Note 29. Des Moines, lA.
[20] USDA-ARS. 2009. Cligen overview. Available at http://www.ars.usda.gov/Research!docs.htm?docid=l8094 (last accessed 15 June 2011,verified 5 Jan. 2012). USDA ARS, West Lafayette, IN.
[21] Wagner, L.E., J. Tartarko, and E.L. Skidmore. 1992. WIND-GEN: a statistical database and generator for wind data. PaperNo. 922111. ASAE 1992 International Summer Meeting, Charlotte, NC. 21-24 Jun. 1992. ASAE, St. Joseph, MI.
[22] USDA-NRCS. 2011a. Crop management zone databases.
Available at
ftp:/ /fargo.nserl.purdue.edu!pub/RUSLE2/Crop _ Managem ent_Templates/ (accessed 15 June,2011, verifiedl4 Jan. 20 12). USDA-NRCS., Washington, DC.'
[23] Environmental Systems Research Institute (ESRI). 1998. ESRI Shapefile technical description: an ESRI white paper. ESRI, Redlands, CA.
[24] Moore, I.D., G.J. Burch, and D.H. Mackenzie. 1988. Topographic effects on the distribution of surface soil water and the location of ephemeral gullies. Trans. ASAE 31:1098-1107.
[25] Bell, J.C., C.A. Butler, and J.A. Thompson. 1995. Soil-terrain modeling for site-specific agricultural management. p. 209-227. In P.C. Robert et al. (ed.) Site-Specific Management for Agricultural Systems. Proc. Int. Conf., 2nd, Minneapolis, MN. 27-30 Mar. ASA, CSSA, and SSSA, Madison, WI.
[26] Green, T.R., and R.H. Erskine. 2004. Measurement, scaling, and topographic analyses of spatial crop yield and soil water content. Hydrol. Processes 18:1447-1465. [27] Dosskey, M.G., D.E. Eisenhauer, and M.J. Helmers. 2005.
Establishing conservation buffers using precision information. J. Soil Water Conserv. 60:349-354.
[28] McKinion, J.M., J.L. Willers, and J.N. Jenkins. 2010. Spatial analyses to evaluate multi-crop yield stability for a field. Comput. Electron. Agric. 70:187-198.
[29] Geoinformatics Training, Research, Education and Extension Center (GeoTREE). 2011. Iowa LiDAR
mapping project. Available at
http://www .geotree.uni.edu!lidarProject.aspx (last accessed 31 Dec. 2011, verified 14 Jan. 2012). University of Northern Iowa, Cedar Falls, lA.
[30] USGS. 2010. Seamless Data Warehouse: national elevation datasets. Available at http://seamless.usgs.gov (verified 31 Dec. 20 ll ). USGS, Reston, VA.
[31] Muth, D., Koch, J., McCorkle, D., andK.M. Bryden. 2012. Modeling Sustainable Agricultural Residue Removal at the Subfield Scale. Agron. J. 104:970-981.
[32] McCorkle, D.S., and K.M. Bryden. 2007. Using the semantic web to enable integration with virtual engineering tools to create extensible interfaces. Virtual Reality 11:253-260.