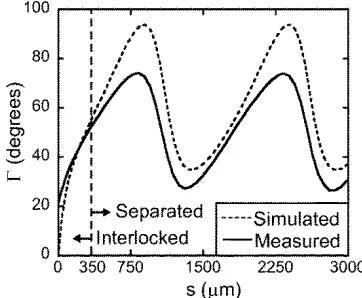
Artificial dielectric devices for variable polarization compensation at millimeter and submillimeter wavelengths
Full text
Figure


Related documents
Earth Planets Space, 50, 905?911, 1998 Development of instruments for seafloor geodesy Hiromi Fujimoto1, Kin ichiro Koizumi1, Yukihito Osada1, and Toshihiko Kanazawa2 1Ocean
A low intensity sampling block (4% sampling intensity) covered the whole study area including Manovo Gounda Saint Floris National Park and Bamingui Bangoran National Park and part
Output form LM324 is fed to microcontroller to transmit data over receiver section via zigbee module.The aim is to design an ambient temperature measurement circuit.. The
PLX5622 treatment of scrapie-infected tgGFP/RFP mice To distinguish between microglia and monocytes, which are both Iba1-positive, we did similar scrapie infection experiments
The findings revealed that PCAT- 1 expression could be a potential diagnostic target in patients with colorectal (CRC), gastric, breast, bladder, lung cancer, and
With sample data requests, agents are not interested in particular objects. Hence, object sharing is not explicitlydefined by their requests. The distributor is “forced” to
Figures 9 shows the comparison graph results of packet delivery ratio for all nodes in the simulation for GEOR model and CNOR model implementation. The red colour line represents
(2014), the authors use super- resolution microscopy to demonstrate that Corolla is ex- pressed in the central region of the synaptonemal complex.. Why did the authors choose
