margret fine-davis
•
mary mccarthy
•
ciara o’dwyer
•
grace edge
•
mairéad o’sullivan
The Effects of
Flexible Working on Work-Life
Balance and Social Inclusion
evaluation of a series of pilot projects
margret fine-davis • mary mccarthy
ciara o’dwyer • grace edge • mairéad o’sullivan
carried out pilot projects to encourage the development of flexible working arrangements for working parents, carers, older workers and people with mental health difficulties in a project on Work-Life Balance. This project was funded by the European Social Fund through the EQUAL Community Initiative and administered through the Department of Enterprise, Trade and Employment.
The members of the Steering Committee of the National Flexi-Work Partnership:
Centre for Gender and Women’s Studies, Trinity College, Dublin: Dr. Margret Fine-Davis, Senior Research Fellow & Project Director,
Mary McCarthy, Deputy Project Director, Grace Edge, Researcher and Ciara O’ Dwyer, Researcher
FÁS: Mary Beggan, Manager, Equal Opportunities and Social Inclusion
IBEC: Maria Cronin, Director of EU and Social Policy, and Catherine Maguire, Social Policy Executive
Aware: Geraldine Clare, CEO and Julie Healy, National Co-ordinator
Age Action Ireland: Robin Webster, CEO and Lorraine Dorgan, Deputy CEO
ICTU: Anne Speed, Branch Secretary , SIPTU
wish to thank the 52 respondents who participated in this research.
We would also like to express our appreciation to the members of the Working Party of Employers who helped in the design and implementation of the Project
Arup Consulting Engineers: Grace Grennan, HR Co-ordinator
Bright Horizons: Neil Brown, General Manager, Ireland
Cadbury Ireland: Eoin Foster, Industrial Relations Manager
Campbell-Bewleys: Catriona Ferriter, Group Human Resources Manager
Cantrell and Cochrane: Sharon Dunne, HR Manager
Citigroup: Cecilia Ronan, HR Manager
Creative Labs: Celine Maguire, HR Specialist
Darndale Belcamp Integrated Services: Kelda Barnes, Centre Manager
Eircom: Grainne O’Boyle, Employee Relations Manager
ESB: Niall O’Connor, Equal Opportunities Officer
FÁS: Frank Boyle, HR Manager
Irish Biscuits Ltd: Roisin Down, HR Specialist
Norwich Union International: Barbara Owen, Head of Human Resources
Price Waterhouse Coopers: Annmarie Rogers, Senior Manager-Human Resources
St. Andrew’s Resource Centre: John Fitzsimons, Director
Trinity College, Dublin: Louise Power, Personnel Officer
Walsh Family Foods: Patrick Walsh, Director
The Steering Committee also wishes to express its appreciation to two former members of the Steering Committee for their contribution to the conceptualisation and development of this project:
Jackie Harrison, former Director of Social Policy, IBEC and Denise Hanrahan, former Family Friendly Co-ordinator, ICTU.
The Steering Committee would also like to thank Keeley Wynne, former Researcher with the Project, who contributed to all phases of the project, including design of the questionnaires. We also wish to thank Florence Craven, who transcribed and wrote up the focus group interviews.
We would also like to acknowledge the valuable contribution made by the members of our Advisory Committee on Work-Life Balance and Mental Health. These included: Padraig Allen, Carol Ball, Michelle Clarke, David Cooney, Alan Cosgrave. Sean Daly, Alan Fisher, John Lamb,
Ann McGuckin, Reg McCutcheon, Marie Madden, Madeleine Maxwell, Dr. Gerald Morgan and Sean O’Reilly.
In addition, we wish to thank the following for their individual assistance in carrying out this pilot project: Economic and Social Research Institute: Prof. James Williams, Head, and Bernadette Ryan, Executive, Survey Unit
EQUAL Technical Support Unit, WRC: Tony Tyrrell, Manager and Tony Ward, Finance Officer
Finally, we would like to express our great appreciation to the children who contributed the paintings and drawings illustrating this report. These children were from two childcare centres that participated in the Men in Childcare element of our Project. The drawings express the children’s portrayal of that project and also their concept of work-life balance.
1. Introduction 1
1.1 Background 1
1.2 Rationale 1
1.3 Work-Life Balance 2
2. Specific Needs of Diverse Groups in the Workforce 5
2.1 Needs of Working Parents and Carers 5
2.2 Working Needs of Older Workers 6
2.3 Mental Health Issues and the Workplace 7
2.4 Overall Benefits for Employers from Flexible Working 8
3. Research Design and Method 9
3.1 Background: The Development of the Pilot Projects 9
3.2 Overview of Research Design 10
3.3 Sample 11
3.4 Instruments 11
3.5 Data Collection Procedures 11
3.6 Data Analysis 11
4. Results 13
4.1 Background 13
4.2 Flexible Working 23
4.3 Workplace Needs of Employees and Perceptions of Employers’ Response 27
4.4 Effects of Flexible Working on Work-Life Balance 38
5. Summary and Conclusions 43
5.1 Background and purpose 43
5.2 Collaboration with employers 43
5.3 Sample and method 43
5.4 Results 44
5.5 Discussion and conclusions 48
4.2 Age Profile of the Sample, by Group 13
4.3 Highest Educational Qualification, by Group 14
4.4 Number of Children for Whom Respondents have Caring Responsibilities, by Group 14
4.5 Number of Elderly People for Whom Respondents have Caring Responsibilities, by Group 16
4.6 Number of Ill/Disabled People for Whom Respondents have Caring Responsibilities, by Group 16
4.7 Total Number of People for Whom Respondents have Caring Responsibilities, by Group 17
4.8 Type of Transport used to Travel to Work, by Group 17
4.9 Ease/Difficulty of Commuting to Work, by Group 18
4.10 Perceptions of Stressfulness of Commute to Work, by Group 19
4.11 Sector of Employment, by Group 19
4.12 Length of Time Worked in Organisation, by Group 20
4.13 Type of Contract, by Group 20
4.14 Type of Employment, by Group 21
4.15 Managerial Status, by Group 21
4.16 Number of Hours contracted to Work per week, by Group 22
4.17 Usual Time of Starting Work, by Group 22
4.18 Usual Time of Finishing Work, by Group 22
4.19 Percentage of Respondents who regularly work longer than their Contracted Hours, by Group 23
4.20 Reasons for Working Longer than Contacted Hours, by Group 23
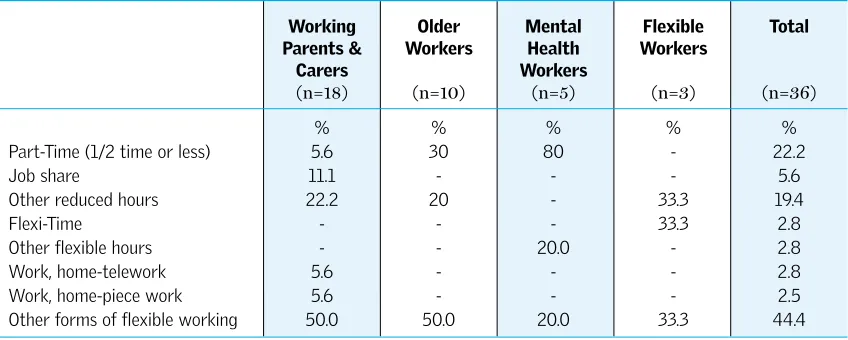
4.23 Other Flexible Working Arrangements Desired, by Group 25
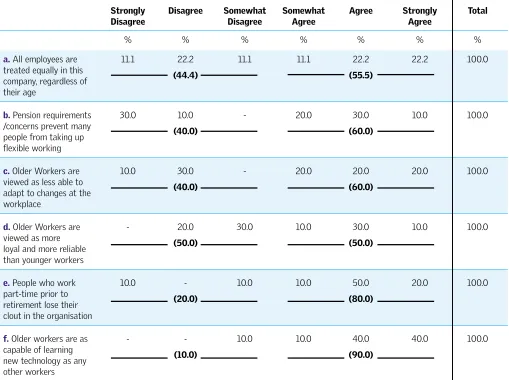
4.24 Older Workers’ Attitudes to Workplace Issues and Perceptions of Older Workers 29
4.25 Mental Health Workers’ Perceptions of Workplace Attitudes and Policies regarding Mental Health 30
4.26 Perception of How Well Supervisor Takes into Account the Work Needs of Respondent, by Group 32
4.27 Perception of How Well EmployerTakes into Account the Work Needs of Respondent, by Group 32
4.28 Perception of How Well Colleagues Take into Account the Work Needs of Respondent, by Group 33
4.29 Percentage of agreement/disagreement with “Men who work part-time/job share are viewed 34
as less serious about their career”
4.30 Percentage of agreement/disagreement with “Women who work part-time/job share are viewed 35
as less serious about their career”
4.31 Percentage of agreement/disagreement with “Men who work flexible hours are viewed as less 35
serious about their career”
4.32 Percentage of agreement/disagreement with “Women who work flexible hours are viewed as less 36
serious about their career”
4.33 Percentage of agreement/disagreement with “Working flexible hours is seen as a more suitable 36
option for women than for men”
4.34 Percentage of agreement/disagreement with “Working part-time is seen as a more suitable 37
option for women than for men”
4.35 Percentage of agreement/disagreement with “Other staff would often resent a colleague taking 37
flexible time”
4.36 Percentage of agreement/disagreement with “To get ahead, employees have to work over and 37
above normal hours”
4.37 Percentage of agreement/disagreement with “To be viewed favourably by management, employees 38
have to put their job ahead of family or personal life”
4.40 Comparison of Respondents with No Experience of Flexible Working (Pre-tests) 40 and those with Experience of Flexible Working (Once-offs) (N = 36)
4.41 Comparison of Respondents with no Experience of Flexible Working (Pre-tests) 41 and All Respondents with Experience of Flexible Working (Once-offs and Post-tests)
1.1 Background
The National Flexi-Work Partnership, a collaborative venture between the Centre for Gender and Women’s Studies, Trinity College Dublin, FÁS, the Irish Business and Employers’ Confederation (IBEC), the Irish Congress of Trade Unions (ICTU), Aware, and Age Action Ireland, carried out a series of flexible working pilot projects in order to encourage the retention in employment of groups of workers who have tradition-ally been excluded by virtue of inflexible working pat-terns as well as stigma. The primary purpose of the proj-ect was to examine the effproj-ects of flexible working on the work-life balance and well-being of workers. This was carried out in the context of a broader project on Work-Life Balance, funded by the European Social Fund through the EQUAL Community Initiative and admin-istered through the Department of Enterprise, Trade and Employment.
1
INTRODUCTION
The groups of workers targeted to take part in the pilot projects were: working parents and carers, older workers and people with mental health problems. Innovative flexible working pilot schemes were developed and implemented in a number of organisations that collab-orated in the Project. In addition, research on a “pre” and “post” basis was carried out to evaluate the schemes and the effects they had on the respondents’ ability to balance the demands of their work and personal life. The aim of these pilot projects was to examine empiri-cally the extent to which flexible working facilitated work-life balance and well-being among these often marginalised groups.
1.2 Rationale
The Forum on the Workplace of the Future has called for
a “focus upon specific groups in society whose labour power is, to date, underutilised”, in order to increase labour force participation (NCPP, 2005). The groups they refer to include: women, older workers, margin-alised people and workers from overseas.
In the same report, it was estimated that in Ireland, 40% of workers will be over the age of 45 by 2015. The number of young people entering the workplace is declining as the drop in birth rates witnessed in this country over the last thirty years or so begins to affect the working age popula-tion. The large numbers of educated young graduates entering employment will eventually begin to decline con-siderably. If economic growth is to be sustained and built upon, other sources of labour must be identified.
The labour force participation of under-utilised groups cannot be dictated by economic necessity alone. Equal opportunities and diversity must always underpin workplace practices, regardless of the status of the sup-ply of labour. Instead it should be recognised that creat-ing practical policies for equal opportunities and diver-sity in the workplace are beneficial to everyone. Employers will benefit as they begin to access the full pool of employees whom they have not been able to reach before. Staff turnover will also decline as policies for equal opportunities and diversity are implemented at a practical level in the organisation. The dividend for existing employees is a workplace that can adapt to their needs and for potential employees, access to employ-ment which had not been possible before.
Work and its function and meaning have long been the subject of psychological and social research. Fromm (1955) sees work as providing an opportunity for autonomy and self-expression. Jahoda (1982) suggests that, in addition to economic needs, employment meets many ‘latent functions’, e.g. interpersonal contact, time structure, activity, status, purposefulness and sense of control. He also identifies work as providing an oppor-tunity for: skill use, external goal and task demands, variety, environmental clarity, securing an income, physical security and valued position. Consequently the ability to access and retain employment is of critical importance, not only to an economy facing a potential labour shortage, but also to the happiness, welfare and confidence of individuals in society.
1.3 Work-life balance
Work-life balance has been defined by the National Framework Committee for Work-Life Balance Policies as a “balance between an individual’s work and their life out-side work”. They also state that, “that balance should be healthy, that personal fulfilment is important inside work and that satisfaction outside work may enhance employ-ees’ contribution to work (www.worklifebalance.ie).
According to the Quality of Life in Europe survey, carried
out in 28 countries, work-life balance is an increasingly important issue across Europe (European Foundation for the Improvement of Living and Working Conditions, 2004). The survey found that issues such as working conditions, time spent at work, life-long learn-ing, provision of services by the public sector (e.g., childcare) and pensions were all important factors which feed into the balance struck between an individ-ual’s work and personal life. The report by the Forum on the Workplace of the Future (NCPP, 2005) also cites work-life balance policies as being a key factor in improving the quality of working life for employees.
In their submission to the Forum, IBEC identified work-life balance as being the “biggest issue” in the Irish workplace in 10 years’ time. They call for the promotion of work-life balance within the context of diversity management so as not to stigmatise or adversely affect the careers of those who take up flexible arrangements (NCPP, 2005). In their submission to the Forum, the EQUAL Community Initiative indicated that employers who effectively meet the evolving work-life balance needs of employees will have “effected widespread cul-tural change and reorganisation of work”(ibid).
and McGee, 2003). Research carried out for the NCPP found that varying modes of flexible working are avail-able to different levels of workers, for example, with part-time work being more available to lower level workers and tele-working more available to more senior staff (O’Connell, Russell, Williams and Blackwell, 2004). One of the main reasons for the irregular spread of flex-ible working arrangements across the workforce is the limited awareness of the benefits of work-life balance policies and the fact that senior managers are often not sufficiently committed to their introduction (OECD, 2003). In addition, the idea of work-life balance is still often confused with ‘family-friendly’, and workers fre-quently believe that flexible working arrangements are only available to working parents. Every individual should have the right to request a flexible working arrangement, regardless of his or her family status.
Evidence from a survey carried out by the Forum of the Workplace of the Future (NCPP, 2005) suggests that Irish workers are experiencing increasing levels of pres-sure and stress. The number of households where all adults are working has increased sharply; the number of lone parents in the work force is growing; due to an aging population, it follows that more people are involved in caring for elderly relatives, and one in three people in the workplace is a working parent with a child under 15.
Flexible working as a workplace policy can have benefits for different groups of workers in different ways. Our project addresses the needs of three different target group: working parents and carers, older people, and people with mental health problems. We briefly describe below the needs of each of these groups in relation to work and work-life balance.
2.1 Needs of working parents and carers
2.1.1 Working parents & carers and employment
The last 20 years, including the arrival of the Celtic Tiger, have heralded huge societal and economic changes in Ireland. There have been major alterations in the com-position of the family, with the nuclear family no longer being classified as the norm. Co-habitation is increasing-ly common and lone parent families, usualincreasing-ly headed by women, make up 16% of families in Ireland (NCCP, 2005). The traditionally high levels of fertility have also decreased, affected by the availability of contraception, the decreasing influence of the Catholic Church, and changing social norms. Such changes have facilitated,
inter alia, a sharp increase in the numbers of women
participating in paid employment. As more women have entered the labour force, the interface of work and fam-ily/personal life has become increasingly important.
One in three people in today’s workplace are working parents with a child under 15 (NCCP, 2005). The work-force participation rate of mothers is now 47.8% (CSO, 2004). Almost 149,000 persons aged 15 years and over are carers, providing regular unpaid personal help to a friend or relative with a long-term illness, health prob-lem or disability (CSO, 2002). Sixty-one per cent of all carers are female and 85,000 carers are in paid employ-ment (ibid). The figures above highlight the large
num-bers of people with caring responsibilities who are either employees or potential employees.
2
SPECIFIC NEEDS
OF DIVERSE
GROUPS IN THE
WORKFORCE
2.1.2 Benefits of flexible working
Within the 25 – 34 age group, 43% of women hold a third-level qualification compared to 36% of men (CSO, 2003). However the workforce participation of women with third level skills is 13% lower than that of their male counterparts (OECD, 2002). The Lisbon Agenda targets for female participation in the labour force are 57% by the end of 2005 and 60% by the end of 2010 (CSO, 2004).
It is clear that there is a serious underutilisation of women’s high standards of education and skills. Certain barriers, both to accessing and maintaining employ-ment, must be removed if the objectives of the Lisbon Agenda are to be met. Workplace policy has not kept pace with nor is adequately responding to the work-life balance difficulties facing its employees and potential employees. The availability of flexible working arrange-ments is of central importance to working mothers when trying to maintain or access employment. The availability of such arrangements or lack thereof can be a critical factor in working mothers’ decisions to stay in or access employment and has a huge impact on the quality of their lives. It will also mean that employers will retain current staff and broaden the spectrum of potential employees vis à vis the availability of flexible
working arrangements.
Fathers should not be ignored when discussing the ben-efits of flexible working in facilitating work-life balance. In Ireland, there are few flexible working arrangements and work-life balance policies that are specifically intended for fathers, meaning that the Government, employers, and male workers do not encourage their use. McKeown, Ferguson and Rooney (1998) note, how-ever, that the international evidence on fathers’ involve-ment suggests that there has been some increase in par-ticipation in childcare and domestic activities. They suggest that the implications of their analysis is that:
“public policy should seek to create family-friendly measures, especially in the workplace, which maximise the choices men and women have to negotiate roles and responsibilities and will allow fathers as well as mothers the time and space for childcare.” (Ibid.).
Such policy should reverse some “workplace culture” which automatically expects male workers to prioritise work over family commitments. It would also facilitate a more egalitarian redistribution of childcare and domestic tasks in two parent households.
2.2 Working needs of older workers
2.2.1 Older workers and employment
The appearance of the Celtic Tiger in the mid-1990’s and the rapid economic growth that accompanied it contributed to a reversal of the earlier trend in the declining labour force participation of older people in Ireland, as the country faced an overall shortage of qual-ified workers. Indeed, Ireland is one of the few countries in Europe to have now reached the Stockholm target of 50% of older workers in employment (Age Action Ireland, 2004) compared to the EU average of 39% (NCPP, 2005).
In the context of the EU population as a whole, census reports show that Ireland has a relatively young tion. However the challenges which an ageing popula-tion presents will face Ireland in the next generapopula-tion as the demographic profile here falls into line with the EU average. The aging of the population (and as a result, the workforce) will present major issues, as increasing num-bers of active older people will demand new social struc-tures and opportunities. However this time lag affords us a period in which we can create clear-cut and coherent practice based on the principle of equality in relation to the retention of older workers in the workplace. In order to facilitate an increase in labour force participation, cer-tain barriers to employment faced by older workers must be removed. One of the most serious obstacles blocking older workers from taking up or maintaining their place in the workforce is age discrimination.
2.2.2 Age discrimination and stigmatisation
2.2.3 Benefits for older workers, society and the economy from the increased participation of older workers in the labour force
Meaningful work… is a central aspect of society, and is essential to the dignity and well being of individuals. The choices that we, as a society make with regard to workplace development in the coming years will have a lasting impact on individuals, families, enterprises and the on-going success of our economy (NCPP, 2005)
This statement by the NCCP indicates the importance of increasing the participation of older workers in the labour force. The individual worker, society as a whole and the economy, at both a micro and macro level, all benefit from the employment of older people. Increasing participation amongst this group represents a society that values and embraces the experiences of its older citizens. From the point of view of the individual worker, increased participation allows for the utilisation of skills and knowledge, which have been gained over the course of a lifetime. At a demographic and econom-ic level we must realise that as numbers of young people entering the labour market declines, other sources of labour supply will have to be identified if labour short-ages are not to become a critical constraint on growth (NCCP, 2005).
2.2.4 Flexible work arrangements – a practical mechanism for facilitating employment for older workers
In order to make use of this valuable resource, working conditions need to be adapted in order to utilise and facil-itate older workers. The National Flexi-work Partnership has identified the availability of flexible working arrange-ments to be a crucial factor in increasing the participation of older workers in employment. According to the Forum on the Workplace of the Future, improved flexibility in working hours aimed at enabling older workers to com-bine work and personal life is an essential pre-condition for maximising labour force participation by older work-ers who otherwise may not be favourably disposed to, and/or physically capable of, working full-time beyond their mid-sixties (NCPP, 2005).
2.3 Mental health issues and the workplace
2.3.1 Mental health and employment
Research has indicated that depression is the fourth lead-ing cause of disease worldwide (Usten, Ayuso-Mateos, Chatterji, Mathers and Murray, 2004). In Ireland, it has been estimated that 300,000 people suffer from depres-sion (McKeon, Healy, Bailey and Ward, 2000).
For people with mental health difficulties, work can hold paradoxes. Work and the stresses it encompasses, can exacerbate someone’s fragility, while at the same time it can provide all the factors – an opportunity for control, skill use, interpersonal contact, external goal and task demands, variety, environmental clarity, avail-ability of money, physical security and valued position that can contribute to a person’s recovery and reintegra-tion into normal life (Warr, 1987). There is also research evidence that work can be a protective factor (Brown & Harris, 1989). For people with mental health difficulties, particularly depression, being able to hold down a job provides objective evidence to their return to well being; thus being able to remain in employment has double significance. Several studies have suggested that the main benefit of employment to people with mental health issues may be affiliative rather than economic. Employment provides the opportunity of meeting this need in addition to a sense of fulfilment and identity. In an article on work and mental health rehabilitation, Foster (1999) puts forward the view that “opportunities for employment are crucial to rehabilitation”.
2.3.2 Stigmatisation and disclosure
The National Institute of Mental Health in England found that “people with mental health problems are less likely to be employed than any other group of disabled people”. It is little wonder then that disclosure and the perception of the stigmatisation that disclosing one’s mental illness may arouse, are of central importance in the employment of people with mental health problems.
2.3.3 Benefits for people with mental health problems from flexible working
fulfil-psychological support through the mechanism of flexible working. The operation of these schemes gives a message to the employee that the organisation values them, that the organisation believes that the person will get better and that, even at times when the person is not well, they can still make a contribution to the organisation.
2.4 Overall benefits for employers from flexible working
Flexible working is not only beneficial to many groups of workers, there are also advantages to employers from developing and implementing flexible working arrange-ments.
In an article on Workplace Stress in Ireland, Armstrong (2001) refers to the US National Institute for Occupational Safety and Health’s (NIOSH) finding that “policies benefiting worker health also benefit the bot-tom line”. In a tightening, aging Irish labour market, broadening the spectrum to identify potential employ-ees is of central importance for organisations and the economy in general. Thus a balanced work-life organi-sational culture is vital business.
Emmott and Hutchinson (1998) and Fynes, Morrissey, Roche, Whelan and Williams (1996) are quoted in Humphreys, Fleming and O’Donnell (2000) as having identified the following advantages to employers for providing flexible working arrangements to staff:
• ability to match work provisions more closely with customer/product demand
• reduced fixed costs, e.g. by the use of tele-working • improved recruitment and retention of employees • increased productivity and efficiency
• improved staff morale and loyalty • reduced stress and sick leave • reduced absenteeism
• access to a wider pool of potential employees
3.1 Background: The development of the pilot projects
The Work-Life Balance Project of the National Flexi-Work Partnership invited employers to collaborate in the Project. IBEC was instrumental in facilitating con-tact with employers. Those employers expressing an interest in participating were invited to join a Working Party of Employers. This Working Party met several times and then convened subgroups on special areas of interest: Working Parents and Carers, Older People and People with Mental Health Problems. These subgroups in turn discussed the kinds of flexible working that was already available in their organisations and what else might be possible. Organisations were invited to design innovative modes of flexible working for each of the tar-get groups and to host pilot projects to test the effective-ness of these innovative modes in their organisations.
Some of the organisations did create innovative modes of flexible working in response to the Project, while other companies were already at the ‘cutting edge’ in this area. They had a wide variety of innovative modes of flexible working patterns available to employees and there did not seem to be a need to devise new modes. It was the view of the partners in the National Flexi-Work Partnership and of the Social Partners in particular, that
3
RESEARCH DESIGN AND METHOD
it would also be valuable to capture information about the innovative modes of flexible working which were already out there and to date undocumented.
An example of a response tailored to the specific needs of their work force was developed by a company in the financial services sector. This organisation was relative-ly new and their young work force (average 25-35) needed different flexible arrangements. For example, they offered five days’ paid paternity leave and also up to three paid leave days per annum for fertility treatment. They found that there was an increasing number of working mothers availing of maternity leave and returning to work. As a response to the present Project, this company carried out a survey on the experience of these employees and adjusted their policies in response to the outcome of this survey.
There was also an added bonus for some employees – a group who often worked overtime but found them-selves unable to take time off in lieu because of the par-ticular demands of their business. The arrangement this company put in place was simple: employees could work up extra time during the week and take up to three and a half hours off on a Friday afternoon. This scheme ran during the months of June, July and August. Flexible Fridays were introduced in 2003 and continued in 2004 and 2005 because of the positive feedback from staff.
Two of the organisations involved in the Project, both with an older workforce, have designed and developed innovative phased retirement programmes for their employees. In one, a phased retirement scheme has been made available to staff on reaching 55 years of age. Depending on length of service, the scheme allows an employee up to four months away from the organisa-tion spread over the two years prior to retirement. Another organisation is offering a gradual retirement package of working part-time for two years prior to retirement. The employee’s pension contributions are paid in full so that upon retirement, the employee receives full pension benefit.
We also found that part-time working among managers, both male and female, was widespread in one company and many of these managers are included in our study. In addition, two of the NGOs participating in the Project provide part-time work for people with mental health problems and for older people under the FÁS Community Employment Scheme. These two pro-grammes are also evaluated in the study reported here.
In addition, we came across a number of other innova-tive ideas, some of which we were not able to evaluate specifically, but which are very much worth noting. These included term time working which was available for grandparents (including grandfathers) on the pro-duction line; tele-working at home one day a week and working in the office four days a week; and emergency child care purchased by the company in a nearby centre and available to parents when their primary childcare arrangement breaks down. We also came across a pat-tern of managers who had total time flexibility and who could work away from the office. This had the benefit of allowing them to meet child care needs on an ad hoc
basis (e.g., attend a child’s performance at school). The price for this flexibility was that the person was ‘on call’ at all hours and often put in a 50 hour week or more.
We found that in addition to flexible working arrange-ments options per se, companies that aim to be
‘employ-ers of choice’ are continuously fine-tuning their arrangements to meet their employees’ changing needs and are engaged in an ongoing dialogue with their staff to ascertain these needs and respond to them in an appropriate manner.
3.2 Overview of research design
The approach taken in the study involved the collection of both qualitative and quantitative data. The first part of the study involved a quasi-experimental procedure in which we gathered data before the flexible working and after in order to try to measure its effects. The second part of the study involved conducting two focus groups with two of the target groups in order to gain addition-al quaddition-alitative insights into the issues.
3.2.1 Pre-test/Post-test design
The aim in relation to the pre-test/post test design was to collect data at two points in time: 1) before the respondents began flexible working, in order to measure aspects of their work-life balance before the onset of the flexible working regime (the “pre-test”) and 2) then again after a significant period of time (approximately six months to one year) in order to assess the effects of the flexible working on the person’s work-life balance and overall well-being (the “post-test”).
While such purity of design can be obtained in experi-mental settings, it is difficult to achieve this degree of purity in the real world. In reality, what happened was that while we attempted to obtain the pre-test data before the flexible working began, this did not always occur. In some cases the respondents had started flexible working a couple of weeks or a month prior to the inter-view. In some cases it transpired that they had been on flexible working for a year or longer. In order to optimise the research design we decided to administer the post-test only to those who we had “caught” just before the flexible working or for those who had only been doing it for a very short time. These individuals (n=17) consti-tuted the “pre-test” group. An additional 19 who had been doing flexible working for a longer period were administered the pre-test questionnaire, but were not followed up. This group was called the “once-off ” group.
3.2.2 Focus groups
In addition, we carried out two focus groups. The first included a group of employees with mental health problems, in order to gain in-depth qualitative informa-tion from this group and to augment the limited num-ber of individual interviews with people in this group. The second focus group consisted of older women, most of whom were retired. This was carried out to gain addi-tional information about older people’s attitudes and to augment the individual interviews with older people. The focus groups generated purely qualitative data. Selected quotes from these group interviews are includ-ed in the qualitative comments throughout this report.
3.3 Sample
The total sample consisted of 52 people. Of these, 36 were interviewed individually. These included 18 work-ing parents and carers, 10 older workers, 5 employees with mental health problems (to be referred in the report as “mental health workers”) and 3 “flexible work-ers”, that is workers who worked flexibly, but did not belong to any of the other groups. Of these, 17 were interviewed both before and after the flexible working.
In addition, the sample included 16 people in two focus groups, the first consisting of seven employees with mental health problems (six women and one man), and the second consisting of nine older women, seven of whom were retired and two of whom were working part-time.
3.4 Instruments
Questionnaires were used to collect data in the individ-ual interviews. A basic questionnaire was designed with common questions including demographic characteris-tics of the respondent, commuting, caring responsibili-ties (for children, elderly and ill or disabled people), workplace characteristics, availability of various forms of flexible working, attitudes to flexible working, meas-ures of work-life balance, perceived attitudes of employ-er, supervisor and colleagues, and overall well-being.
The basic questionnaire was adapted to be appropriate to each of the groups studied: 1) working parents and carers; 2) older people; 3) people with mental health problems. In addition, separate sets of questions for designed for each of these groups.
A list of questions was used in the focus groups to elicit attitudes to work, work-life balance and flexible working.
3.5 Data collection procedures
Individual interviews were conducted on a one-to-one basis generally in the respondent’s place of employment, in a private room. Interviews took on average 45 minutes to complete. The pre-test interviews were conducted during the period August 2003 to January 2005 and the post-test interviews were conducted between November 2004 and June 2005. The minimum time which elapsed between a pre test and a post test was six months and the maximum was one year and six months.
The focus groups were held in May and June 2004. The focus group with people with mental health needs was held at Aware and the focus group with older people was held at Trinity College.
3.6 Data analysis
We were able to collect pre and post test data on 17 of the 36 respondents who were interviewed on an individ-ual basis. However, the remaining 19 had already begun the flexible working at the time of the pre-test interview. Since all 36 respondents were asked about their attitudes to flexible working, we focus in the Results section pri-marily on the pre-test data for all 36 respondents, with breakdowns by sub-group. We then present analyses of comparisons between the various groups (utilising t-tests) in order to examine the effects of flexible working on measures of work-life balance and well-being.
4.1 Background
4.1.1 Demographic characteristics of the sample
A total of 39% of the sample were male and 61% female (see Table 4.1). The gender breakdown of the sample as a whole was also true of the 18 working parents in the sample. Ten of the older workers (60%) were male and 40% were female. Of the five Mental Health Workers, 80% were female and 20% male; all of the three Flexible Workers were female.
Half (50%) of the Working Parents and Carers were in their thirties, the next largest group was in their forties (22%), and a further 16.7% were in their fifties. Very few (5.6%) were in their twenties (see Table 4.2). The age profile of the “Older Workers” was naturally older.
4
RESULTS
Ninety per cent were over 50, with 50% in their fifties and 40% in their sixties. The remaining 10% consisted of one respondent who was in his forties; he was includ-ed with the Older Workers, since he was involvinclud-ed in a phased retirement scheme.
[image:20.595.262.555.70.284.2]The Mental Health Workers were mainly in the age group 30-39 (40%). The remainder were older, with one
Table 4.2: Age profile of the sample, by group
Working Older Mental Flexible Total
Parents & Workers Health Workers
Carers Workers
(n=18) (n=10) (n=5) (n=3) (n=36)
% % % % %
20-29 years 5.6 - - - 2.8
30-39 years 50.0 - 40.0 100.0 38.9
40-49 years 22.2 10.0 20.0 - 16.7
50-59 years 16.7 50.0 20.0 - 25.0
60+ years 5.6 40.0 20.0 - 16.7
Total 100.0 100.0 100.0 100.0 100.0
Table 4.1: Gender breakdown of the sample, by group
Working Older Mental Flexible Total
Parents & Workers Health Workers
Carers Workers
(n=18) (n=10) (n=5) (n=3) (n=36)
% % % % %
Male 38.9 60.0 20.0 - 38.9
Female 61.1 40.0 80.0 100.0 61.1
[image:20.595.42.475.597.749.2]respondent in the forties age group (20%), one in the fifties (20%) and one in the sixties (20%). All of the “Flexible Workers” were in their thirties.
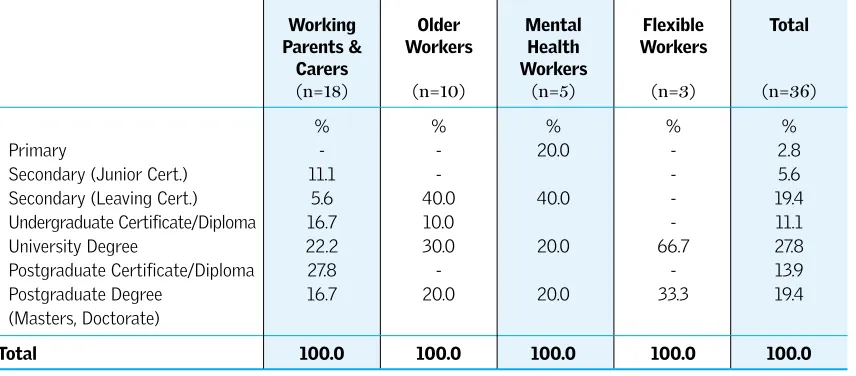
As can be seen in Table 4.3, it is evident that this is a well-educated group overall, with approximately 60% having a university degree or post-graduate degree. Only 8.4% had Junior Certificate or less and 19.4% had obtained the Leaving Certificate. Thus, just over a quar-ter of the sample (27.8%) had secondary education only, whereas the remaining 72.2% had some sort of third level education, ranging from a certificate or diploma (11.1%) or university degree (27.8%) to a post-graduate certificate or diploma (13.9%) or postpost-graduate degree (19.4%). A comparison of the different groups showed that this high level of education applied to all of them, with at least 60% of each group having a third level qualification. The one exception to this was the Mental Health group, of whom a slightly smaller pro-portion (40%) had third level qualifications.
4.1.2 Caring arrangements
All of the respondents were asked to give details on their caring commitments of children, older people and ill/dis-abled people in order to get a picture of the difficulties they faced in balancing their work and personal lives.
[image:21.595.129.557.413.601.2]It was found that two-thirds of the respondents had car-ing commitments for children. Almost 90% of the Working Parents and Carers had caring commitments for children (see Table 4.4). Forty-four percent had responsibility for one child, 33.3% responsibility for two children and 11.1% had responsibility for four chil-dren. The children of Working Parents and Carers ranged from infants to over 18s; 36.6% had one or two children aged 0-2, 25% had one or two children aged 3-5, and 25% had one or two children aged 6-12. Just under a fifth had one or more children aged 18 or over living with them.
Table 4.3: Highest Educational Qualification, by Group
Working Older Mental Flexible Total
Parents & Workers Health Workers
Carers Workers
(n=18) (n=10) (n=5) (n=3) (n=36)
% % % % %
Primary - - 20.0 - 2.8
Secondary (Junior Cert.) 11.1 - - 5.6
Secondary (Leaving Cert.) 5.6 40.0 40.0 - 19.4
Undergraduate Certificate/Diploma 16.7 10.0 - 11.1
University Degree 22.2 30.0 20.0 66.7 27.8
Postgraduate Certificate/Diploma 27.8 - - 13.9
Postgraduate Degree 16.7 20.0 20.0 33.3 19.4
(Masters, Doctorate)
Total 100.0 100.0 100.0 100.0 100.0
Table 4.4: Number of children for whom respondents have caring responsibilities, by group
Working Older Mental Flexible Total
Parents & Workers Health Workers
Carers Workers
(n=18) (n=10) (n=5) (n=3) (n=36)
% % % % %
0 11.1 50.0 80.0 100.0 38.9
1 44.4 20.0 20.0 - 30.6
2 33.3 30.0 - - 25 .0
4 11.1 - - - 5.6
[image:21.595.128.550.640.781.2]The difficulty in balancing their working hours with their childcare arrangements was one of the biggest problems faced by working parents. The majority of the parents (93.3%) reported that they were at least some-what satisfied with the childcare arrangements they cur-rently had (46.7% were very satisfied), while just one was dissatisfied. However, a few had to use a number of different methods of childcare to cover the time they were in work, or were travelling to work. For example, one respondent had an arrangement with a friend who also had young children, whereby she would mind both sets of children one day a week, and the friend would mind them another day. She then employed a childmin-der to care for her children another day during the week, and one of her parents minded them the other two days.
Both parents with preschool children and children of school-going age reported that they felt stressed trying to ensure that they left work on time every evening in order to pick up their children from the crèche or child-minder’s. As Working Parents often had no childcare arrangement for emergency situations, they often felt guilty having to refuse to work late. The pressure associ-ated with childcare arrangements was another reason why many chose to change their working hours or the way their working hours were organised.
It appears that the traditional division of labour oper-ates within at least some of the respondents’ families, as many of the males do not seem to have the same level of caring commitments as their wives:
“…I’m very satisfied with my childcare arrangements – my wife is at home full-time.”
Male Working Parent, Professional in his forties
“…I’d bring my daughter to school if my wife was unavailable.”
Male Working Parent, Professional in his fifties
In contrast, many of the female Working Parents seemed to have the bulk of responsibility in arranging childcare for their children:
“…I leave home at 6 am and drive into Dublin, where I leave my daughter with a friend, who’ll mind her until 8am and then bring her into the crèche. It means that I can leave work early and pick her up in the crèche before 6pm.”
Fifty percent of the Older Workers had responsibility for children. These tended to be aged 6-12 or 18+. Several of the Older Workers reported that they carried out a wide range of caring activities for school-going chil-dren, grandchilchil-dren, elderly parents or parents-in law and relatives, partners or siblings with disabilities. However, none saw themselves as being a primary carer.
Again, it was often the females among the two groups who were more heavily involved in caring activities than their male counterparts.
“…I look after my grandchild one day a week; they live out of town. It takes ages to get there so it was really difficult for us before.”
Female Older Worker, Executive in her fifties
“My daughter is a single mum, so my wife and I help out a lot.”
Male Older Worker, Manager in his sixties
Some of the Older Workers had children still at school and were grateful for the additional free time they had as a result of flexible working.
“…We married late so we have young children. It’s nice to have more time with the youngest. I now see what I missed with the others.”
Male Older Worker, Middle Manager in his fifties
Twenty per cent of those with mental health needs had childcare responsibilities. As with the older workers, while none of the Mental Health Workers reported hav-ing primary carhav-ing responsibilities, they still had some caring demands on their time, and similarly, older chil-dren require a certain level of care.
“…I chose flexible hours. I didn’t want work all the time, even though my kids were 20 to 24, they still needed me. Older children are very demanding - you have to be there for them.”
Female Mental Health Worker, Mental Health Focus Group
Respondents who have caring arrangements other than for their own children also tend to be female, and faced similar problems. One Carer indicates that, in taking on the responsibility for her mother’s needs, she is sacrific-ing her advancement up the career ladder, at least for the time being:
“…My working part-time is the only option. My mother has always had someone with her that she knows, which is why I go up to her. My main concern at the moment is my mother, not my career.”
Female Carer, Professional in her thirties
With an increasingly ageing population, Older Workers, although classified as ‘old’ themselves, are often involved in the care of elderly parents.
“…My wife’s mother lives with us. She does not like to be left alone at all. It is very trying for my wife so we are able to share this.”
Male Older Worker, Senior Manager in his fifties
Sometimes a respondent’s partner, while not disabled, needed a lot of care – someone to take them to hospital visits and therapeutic centres.
“…It’s great to have the time for this without juggling my work time”.
Male Older Worker, Senior Professional in his sixties
The respondents also spoke about vulnerable family members who, although they lived independently, relied on their support.
“…I tidy the place up for him once a week. I drop in on him every couple of days. All that’s not as pressured now.”
Male Older Worker, Senior Professional in his fifties
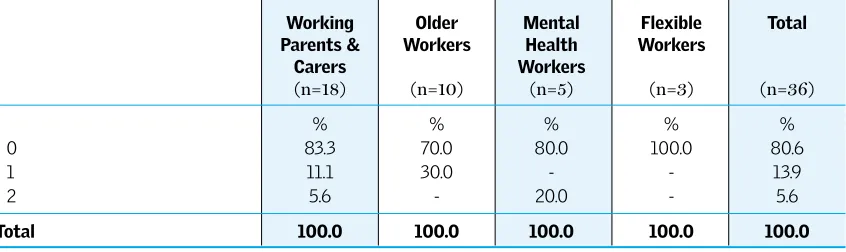
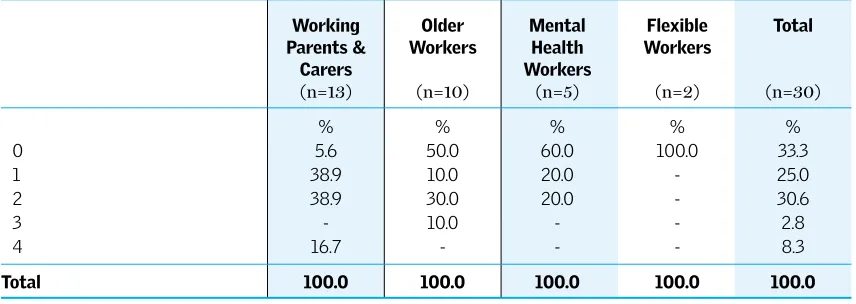
[image:23.595.130.553.512.638.2]If one looks at the total caring responsibilities of the respondents, as shown in Table 4.7, it may be seen that two-thirds of the sample (66.7%) have caring responsi-bilities for one or more persons. One quarter of the sample had responsibilities to care for one person, 30.6% had responsibilities to care for two people, 2.8% had responsibilities to care for three people and 8.3% had responsibilities to care for four people. These work-ers with care responsibilities are in three of the four groups of workers in our sample: Working Parents and Carers, Older Workers and Mental Health Workers. It is clear that these people need flexible working in order to meet their caring responsibilities.
Table 4.5: Number of elderly people for whom respondents have caring responsibilities, by group
Working Older Mental Flexible Total
Parents & Workers Health Workers
Carers Workers
(n=18) (n=10) (n=5) (n=3) (n=36)
% % % % %
0 83.3 70.0 80.0 100.0 80.6
1 11.1 30.0 - - 13.9
2 5.6 - 20.0 - 5.6
Total 100.0 100.0 100.0 100.0 100.0
Table 4.6: Number of ill /disabled relatives for whom respondents have caring responsibilities, by group
Working Older Mental Flexible Total
Parents & Workers Health Workers
Carers Workers
(n=18) (n=10) (n=5) (n=3) (n=36)
% % % % %
0 83.3 100.0 100.0 100.0 91.7
1 16.7 - - - 8.3
[image:23.595.127.550.683.795.2]4.1.3 Commuting
Cross-cultural research has demonstrated that one of the key factors contributing to work-life balance is com-muting (Fine-Davis, Fagnani, Giovannini, Hojgaard and Clarke, 2004). Long commutes can be a stress factor and short commutes can contribute to work-life balance and quality of life. In the present sample it was found that the most common form of transport for getting to work was the car. Three-quarters of the sample took a car to work (see Table 4.8). The remainder used buses (16.7%) and trains (22.2%) (Dart, Luas, etc.). Car usage was highest among the Working Parents and Carers (94.4%), and next highest among Older Workers (80%). Flexible Workers were equally likely to use cars or trains. Mental Health Workers were most likely to use the bus and next most likely to use trains.
Among the entire sample, not a single respondent report-ed using a bicycle, motorcycle or walking. While the high usage of cars corroborates national patterns, it surpasses them. The CSO found that over half of Irish people in employment drove a car to work in the first quarter of 2000 (CSO, 2000). In a study of working parents in
Dublin, 70.1% were found to use a car to get to work (less than in this sample where it is 94.4%). That study showed that 20.4% of working parents used buses and trains, which is similar to the figure obtained in the present study. However, in that study 3.2% used bicycles and motorcycles and 12.8% walked (Fine-Davis et al., 2004).
One respondent in the present study explains why alter-native means of transport to the car create difficulties:
“…Living closer to the job would be a less stressful alternative. Near where I live, there’s a lack of road space for buses and the bus stop is very far from my work.”
Male Carer, Maintenance Staff in his thirties
[image:24.595.42.470.442.594.2]The respondents in the present study reported that it took on average 49 minutes to get to work. This was highest among the Flexible Workers, who reported it took them 55 minutes, and next highest among the Working Parents and Carers, for whom the commute to work took on average 51 minutes. The issue of the long commute is particularly relevant to younger workers who have been forced to move outside Dublin to buy a house, due to the rise in house prices. The commute to
Table 4.7: Total number of people for whom respondents have caring responsibilities
Working Older Mental Flexible Total
Parents & Workers Health Workers
Carers Workers
(n=13) (n=10) (n=5) (n=2) (n=30)
% % % % %
0 5.6 50.0 60.0 100.0 33.3
1 38.9 10.0 20.0 - 25.0
2 38.9 30.0 20.0 - 30.6
3 - 10.0 - - 2.8
4 16.7 - - - 8.3
Total 100.0 100.0 100.0 100.0 100.0
Table 4.8: Type of transport used to travel to work, by group
Working Older Mental Flexible Total
Parents & Workers Health Workers
Carers Workers
(n=18) (n=10) (n=5) (n=3) (n=36)
% % % % %
Car 94.4 80.0 - 66.7 75.0
Train (DART, Luas) 11.1 10.0 20.0 66.7 16.7
Bus 11.2 20.0 80.0 - 22.2
[image:24.595.42.480.635.780.2]-work, while still long, was less for Older Workers and Mental Health Workers, ranging from 44.5 - 46 minutes on aver-age. The length of the commute varied widely – from 15 minutes to 120 minutes, with the median commute being 40 minutes.
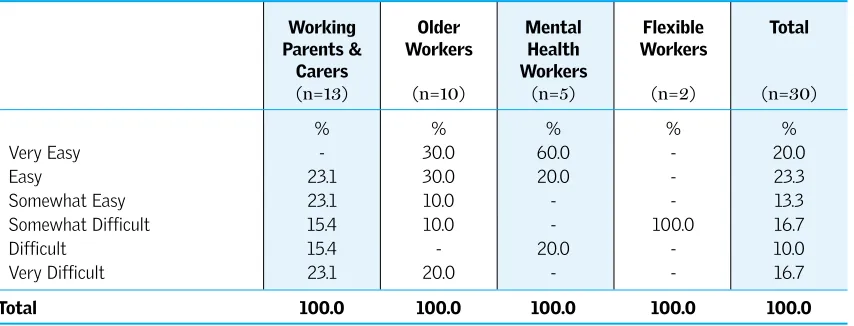
Respondents varied greatly in their assessment of how easy or difficult they found the commute to work: 56.6% reported that it was easy to one degree or another, with 20% saying it was ‘very easy’, 23.3% saying it was ‘easy’, and 13.3% saying it was ‘somewhat easy’ (see Table 4.9). On the other hand, almost half said that it was at least some-what difficult: 16.7% finding it ‘somesome-what difficult’, 10% finding it ‘difficult’ and 16.7% finding it ‘very difficult.’
The ease vs. difficulty of the commute varied by group. The Working Parents and Carers were more likely to find it difficult, with 53.9% saying it was difficult to one degree or another (23.1% found it ‘very difficult’). Older Workers and Mental Health Workers were less likely to find the commute to work difficult; 70% of Older Workers and 80% of Mental Health Workers said their commute was easy.
Throughout the course of the interviews, it emerged that commuting was one of the biggest problems faced by many Working Parents and Carers:
“…With commuting, it’s an eleven-hour day.”
Female Working Parent, Administrative Staff in her fifties
“…The commute is horrible. I need the car.”
Female Working Parent, Manager in her thirties
Some of the Working Parents and Carers were able to use flexible working to resolve the commuting issue. One respondent says that she would prefer to get a job nearer to where she lives, just outside Dublin, but being able to change her work schedule has made her com-mute a good deal less stressful. Another respondent also feels that her company’s flexibility, including allowing her to work from home if needed, has allowed her to stay in her job.
“…I leave work early and work an extra hour at home. It’s too long a commute otherwise.”
Female Working Parent, Administrator in her forties
Many changed their work schedules in order to over-come the long time that they were forced to spend sit-ting in their cars.
“…My flexible hours suit me, because it means I can go into work early and get out before the traffic starts in the evenings.”
Male Working Parent, Professional in his forties
[image:25.595.129.556.299.462.2]In contrast, the issue of commuting was perhaps not as critical for Older Workers or Mental Health Workers as it was for the Working Parents and Carers. This may be because, being older, they had been able to buy homes near their work, making the actual commuting itself somewhat easier. However, even some of those who reported the actual journey as ‘easy’ or ‘somewhat easy’ sometimes described the experience itself as ‘stressful’.
Table 4.9: Ease/difficulty of commuting to work, by group
Working Older Mental Flexible Total
Parents & Workers Health Workers
Carers Workers
(n=13) (n=10) (n=5) (n=2) (n=30)
% % % % %
Very Easy - 30.0 60.0 - 20.0
Easy 23.1 30.0 20.0 - 23.3
Somewhat Easy 23.1 10.0 - - 13.3
Somewhat Difficult 15.4 10.0 - 100.0 16.7
Difficult 15.4 - 20.0 - 10.0
Very Difficult 23.1 20.0 - - 16.7
“…I found the commute quite stressful when I was working full time and under time pressure - another anxiety I don’t have to worry about now”.
Female Mental Health Worker, Executive in her thirties
While it was seen above that there was variability in terms of how “easy or difficult” people found their com-mute to work, when respondents were asked how “stressful or unstressful” their commute to work was, this appeared to elicit a somewhat different dimension. It was found that among Working Parents and Carers, as well as the Mental Health Workers, the commute to work was stressful for a significant proportion of them, 61.6% of the Working Parents and Carers and 60% of Mental Health Workers (see Table 4.10). Indeed, among all workers, 46.7% found the commute to work stressful to one degree or another.
4.1.4 Work characteristics of the sample
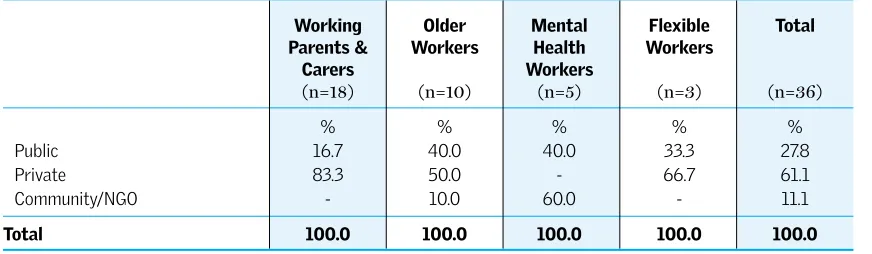
Just under two-thirds (61.1%) of the sample were employed in the private sector, just over a quarter (27.8%) in the public sector and the remainder (11.1%) in community organisations or non-governmental organisations (NGOs) (see Table 4.11). Working Parents and Carers and Flexible Workers were more likely to be employed in the private sector. Mental Health Workers were more likely to be employed in the public sector (40%) or by NGOs (60%). Older Workers were fairly equally distributed between the private sector (50%) and the public sector (40%), with a minority working for NGOs.
[image:26.595.42.466.402.565.2]Most of the respondents had worked for their present employer for a long time. Just over 60% (61.1%) had been with them for seven years or longer (see Table 4.12). A quarter (25%) had been with their present
Table 4.11: Sector of employment, by group
Working Older Mental Flexible Total
Parents & Workers Health Workers
Carers Workers
(n=18) (n=10) (n=5) (n=3) (n=36)
% % % % %
Public 16.7 40.0 40.0 33.3 27.8
Private 83.3 50.0 - 66.7 61.1
Community/NGO - 10.0 60.0 - 11.1
[image:26.595.41.477.605.732.2]Total 100.0 100.0 100.0 100.0 100.0
Table 4.10: Perceptions of stressfulness of commute to work, by group
Working Older Mental Flexible Total
Parents & Workers Health Workers
Carers Workers
(n=18) (n=10) (n=5) (n=3) (n=36)
% % % % %
Very Unstressful - 20.0 20.0 - 10.0
Unstressful 30.8 40.0 - - 26.7
Somewhat Unstressful 7.7 20.0 20.0 50.0 16.7
Somewhat Stressful 23.1 - 20.0 50.0 16.7
Stressful 30.8 - 40.0 - 20.0
Very Stressful 7.7 20.0 - - 10.0
employer for 3-6 years and the remainder (13.9%) had been with them for only 1-2 years. Not surprisingly, the Older Workers had been with their employers for the longest time; 90% had been with them for seven years or more. However the Working Parents and Carers, most of whom it will be recalled were in their thirties, also had a record of long and stable employment with their current employer, with 55.6% of them having worked for them seven years or more and 38.9% having worked there for 3-6 years. The Flexible Workers had all been with their current employer for at least 3-4 years. Mental Health Workers were divided, with 60% having been with their current employer for 1-2 years and 40% there for seven years or longer. This reflects the fact that three of the respondents in this group were employed in an NGO on a Community Employment Scheme. Such schemes are generally time delimited and by their nature do not involve long term employment.
As can be seen in Table 4.13, a very high proportion of the workers were on permanent contracts (86.1%). This was true of all of the Working Parents and Carers and Flexible Workers. A high proportion of the Older Workers (80%) were on permanent contracts and the
remainder on temporary contracts. Mental Health Workers were notable in that only 40% were on perma-nent contracts and the majority were on temporary contracts. This again reflects the nature of the Community Employment Scheme.
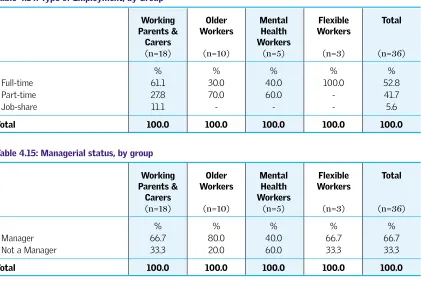
It may be seen that slightly over half of the sample (52.8%) worked full-time and the remainder worked part-time (41.7%) or job-shared (5.6%) (see Table 4.14). All of the Flexible Workers were working full-time, while 61.1% of the Working Parents and Carers were. The remainder of the Working Parents and Carers either worked part-time (27.8%) or job-shared (11.1%). The Older Workers and Mental Health Workers were more likely to work part-time (70% of the Older Workers and 60% of the Mental Health Workers) and the remainder of each group worked full-time.
Given the relatively high proportion of the sample working part-time and job-sharing (47.3% in total), it is interesting to note that quite a high proportion were managers. As may be seen in Table 4.15 below, 64% overall were managers and 36% were non-managers. The majority of the Older Workers (80%) were
man-Table 4.12: Length of time worked in organisation, by group
Working Older Mental Flexible Total
Parents & Workers Health Workers
Carers Workers
(n=18) (n=10) (n=5) (n=3) (n=36)
% % % % %
1-2 years 5.6 10.0 60.0 - 13.9
3-4 years 22.2 - - 66.7 16.7
5-6 years 16.7 - - - 8.3
7+ years 55.6 90.0 40.0 33.3 61.1
Total 100.0 100.0 100.0 100.0 100.0
Table 4.13: Type of contract, by group
Working Older Mental Flexible Total
Parents & Workers Health Workers
Carers Workers
(n=18) (n=10) (n=5) (n=3) (n=36)
% % % % %
Permanent 100.0 80.0 40.0 100.0 86.1
Temporary - 20.0 60.0 - 13.9
agers, as were 67% of the working parents. Amongst the Mental Health Workers, 40% were managers. Of the Flexible Workers, two-thirds were managers.
The high representation of managers in the sample is due to several factors. Firstly, it was one of the main goals of the research to evaluate part-time work and flexible work among managers. Given the widely held belief that managers must work full-time, and indeed are often expected to work overtime, one of the main aims of this research was to test how effectively man-agers could work if they were working part-time or flex-ible hours. Also, the companies who participated in the research tended to provide the names of personnel in management for the research, even though respondents in all grades were requested. It was noted in the course of the research that flexible working was less available, for example, on production lines in some of the compa-nies which collaborated.
One quarter of the total sample was contracted to work less than 20 hours a week (see Table 4.16). Just under a
third (30.6%) were supposed to work 20-34.9 hours, exactly a third (33.3%) 35-37.9 hours and 11.1% 38 or more hours per week. This corresponds to their report above of working full-time or part-time. Thus, 55.6% worked under 35 hours per week and 44.4% worked 35 hours or more.
As can be seen in Table 4.17, respondents in both the Older Workers and Mental Health Workers groups were more likely to start work later than Working Parents and Carers. It may be seen that the Working Parents and Carers tended to start work the earliest, with over 55% starting at 8 a.m. or earlier. Given that many may have had to drop children off at the crèche before work and then go on to work is indicative of the very early start many of this group had to their working day.
[image:28.595.47.468.445.726.2]In contrast, the Mental Health Workers tended to start later in the day. This may relate to the structure of the Community Employment Scheme, in which 60% of them were involved. However, it also relates to the fact that people with depression often have difficulty getting started in the morning and the flexibility to have a later
Table 4.14: Type of Employment, by Group
Working Older Mental Flexible Total
Parents & Workers Health Workers
Carers Workers
(n=18) (n=10) (n=5) (n=3) (n=36)
% % % % %
Full-time 61.1 30.0 40.0 100.0 52.8
Part-time 27.8 70.0 60.0 - 41.7
Job-share 11.1 - - - 5.6
Total 100.0 100.0 100.0 100.0 100.0
Table 4.15: Managerial status, by group
Working Older Mental Flexible Total
Parents & Workers Health Workers
Carers Workers
(n=18) (n=10) (n=5) (n=3) (n=36)
% % % % %
Manager 66.7 80.0 40.0 66.7 66.7
Not a Manager 33.3 20.0 60.0 33.3 33.3
start can be the very thing that enables them to remain in the workforce.
As can be seen in Table 4.18, there was wide variability in the usual time of finishing work. This was as early as 12:15 pm and as late as 7 pm. Most of the people fin-ished work some time between 4:30 p.m. and 6 p.m. (64%); however, almost 20% finished work later than 6 p.m.
Over half of the respondents (55.6%) reported that they regularly worked longer than their contracted hours (see Table 4.19). Almost half of all respondents who worked overtime (47.2%) stated that the main reason for this was that they had too much work to carry out in their normal working hours, prompting one respondent to remark that the distribution of work within his department needed to be revised, as he had more work than he could cope with, which meant he needed to
Table 4.16: Number of hours contracted to work per week, by group
Working Older Mental Flexible Total
Parents & Workers Health Workers
Carers Workers
(n=18) (n=10) (n=5) (n=3) (n=36)
% % % % %
Less than 20 hrs 27.8 10.0 60.0 - 25.0
20 to 34.9 hrs 22.2 50.0 20.0 33.3 30.6
35 to 37.9 hrs 33.3 30.0 20.0 66.7 33.3
38 or more hrs 16.7 10.0 - - 11.1
Total 100.0 100.0 100.0 100.0 100.0
Table 4.17: Usual time of starting work, by group
Working Older Mental Flexible Total
Parents & Workers Health Workers
Carers Workers
(n=13) (n=10) (n=5) (n=2) (n=30)
% % % % %
Between 6.30am and 7.59am 27.8 20.0 - - 19.4
8.00am 27.8 20.0 - 33.3 22.2
8.01am to 8.59am 27.8 10.0 20.0 33.3 22.2
9.00am to 9.59am 11.1 40.0 20.0 33.3 22.2
10.00am or after 5.6 10.0 60.0 - 13.9
Total 100.0 100.0 100.0 100.0 100.0
Table 4.18: Usual time of finishing work, by group
Working Older Mental Flexible Total
Parents & Workers Health Workers
Carers Workers
(n=18) (n=10) (n=5) (n=3) (n=36)
% % % % %
Before 4.30pm 22.2 10.0 20.0 - 16.7
4.30pm to 4.59pm 22.2 20.0 - 33.3 19.4
5.00pm 27.8 30.0 40.0 - 27.8
5.01pm to 5.59pm 11.1 20.0 40.0 - 16.7
6.00pm to 7.00pm 16.7 20.0 - 66.7 19.4
work longer hours to ensure all his work was done. However, a small number of respondents who worked overtime felt pressure to work additional hours (see Table 4.20).
A number of respondents referred to the presence of a ‘long hours culture’ or ‘organisational culture’ within their workplace, where employees were rewarded for working extra hours. In some of the companies, work-ing long hours were considered the norm, whether or not respondents were happy with this:
“…It’s taken for granted that you will put in the extra hours. It’s assumed and expected of you.”
Female Flexible Worker, Consultant in her thirties
In addition, some respondents were unhappy being tied to set hours, but feel that it was not the responsibility of their employer to accommodate them:
“…The day is long – I could do with a little bit more flexibility. I’d love to leave at five o’clock, but that would cause problems for my employer.”
Female Working Parent, Administrative Staff in her fifties
4.2 Flexible working
4.2.1 Awareness of statutory and non-statutory entitlements
One of the key factors behind the successful implemen-tation of flexible working arrangements is the extent to which employees are familiar with their availability. Respondents were asked whether various flexible work-ing arrangements, both statutory and non-statutory, were available to them and also whether or not they availed of them. Overall, respondents were well aware of the various arrangements available to them, although a small number were uncertain about some of their enti-tlements, illustrating that companies need to make a better effort to ensure their employees are aware of their
Table 4.19: Percentage of respondents who regularly work longer than their contracted hours, by group
Working Older Mental Flexible Total
Parents & Workers Health Workers
Carers Workers
(n=18) (n=10) (n=5) (n=3) (n=36)
% % % % %
Yes 55.6 50.0 40.0 100.0 55.6
No 44.4 50.0 60.0 - 44.4
Total 100.0 100.0 100.0 100.0 100.0
Table 4.20: Reasons for working longer than contracted hours, by group
Working Older Mental Flexible Total
Parents & Workers Health Workers
Carers Workers
(n=18) (n=10) (n=5) (n=3) (n=36)
% % % % %
Demands of the work 50.0 40.0 40.0 66.7 47.2
Part of contract 5.6 - - 33.3 5.6
Shortage of staff - - - 33.3 2.8
Machine breakdowns - - - -
-To get more overtime - - - -
-To get extra leave - - - 33.3 2.9
Part of organisational culture 5.6 10.0 - - 5.6
Other 16.7 20.0 - - 13.9