Master thesis
Health Sciences
Creating
a fair workload for nurses in
the Acute Medical Unit of Rijnstate
Arnhem
L. Nieuwlaar (s1706020)
06-10-2017
Prof. Dr. W.H. van Harten (First supervisor)
Dr. D. Demirtas (Second supervisor) Dr. P. E. Joustra (External supervisor) Master Health Science (Optimising of healthcare processes) Faculty of Science and Technology
University of Twente P.O. Box 217 7500 AE Enschede The Netherlands
ii
Summary
Rijnstate Hospital Arnhem has an Acute Medical Unit (AMU). The AMU is a department for patients who were transferred from the emergency room or the outpatient clinic. The patients can be admitted to several medical specialties. A patient stays maximum 48 hours in the department, whereafter the patient is transferred to the specialty department or discharged to home. The patients in the AMU have different levels of fitness.
Research problem
The Acute Medical Unit in Rijnstate is noticing several problems having an impact on the nursing workload, namely an unpredictable fluctuation in the acuity of patients, as well as an increased number of patients in the geriatric unit or with psychiatric problems. One way to create a balanced workload is the use of an intensity of care model. Therefore the research objective of this thesis is: To improve
the alignment of the workload for nurses in the Acute Medical Unit, by taking into account the optimal
‘nurse-intensity of care’ ratio for acute patients. An intensity of care model is used to create a tool that
can establish a more balanced workload for the nurses. Moreover, the tool can be used to schedule nurses in advance and to consider whether the department is in need of a float nurse.
Approach
The study has been divided into two parts; in the first part the model is developed, and in the second part the model is tested. The context analysis, observation, literature study and benchmark lead to the model ‘Jones Dependency Tool’ for the intensity of care. In this tool, the nurse classified the patients in four categories based on 12 variables in six domains. The results from this model are used to determine a relationship between the patients’ intensity of care and the nurses’ workload. First was tried to make a multiple linear regression model for the decision of the need for a float nurse. The workload can depend on intensity of care, number of admissions, number of discharges, number of patients with a length of stay over 48 hours and number of medical specialties involved in a shift. When there was not a possible regression model, the analysis of the workload was further expanded for making a nurse staffing advice.
Results
iii are not as how they were experienced in practice. There were more patients with a high intensity of care in the department during the measurement period, and the workload was also higher than was measured.
For the nurse staffing was it not achievable to make a multiple linear regression model with the independent variables. The workload was further analysed. The results from this analyses were a high workload for the medical specialty Pulmonology. A significant finding was that half of the nurses always have a lower or higher workload than the average workload in that shift. This finding can be a possible explanation why a regression model cannot be built. The nurse staffing was finally based on solving problems in the system around the AMU to create a fair workload for nurses. Solutions on long term can be a relocation of the AMU near the ER, not exceed the LOS of 48 hours, create career paths for new nurses and use an app or scanner for the double check instead of a second nurse.
Conclusion
The intensity of care model is useful on the AMU, despite the fact that no relationship has been found with the workload. The workload can reduce if the solution are implemented in the AMU.
iv
Samenvatting
Het ziekenhuis Rijnstate in Arnhem heeft een Acute Opname Afdeling (AOA) tot de beschikking. Deze afdeling is voor patiënten die via de spoedeisende hulp of polikliniek opgenomen dienen te worden in het ziekenhuis. De patiënten kunnen voor verschillende specialismes zijn opgenomen. Een patiënt mag maximum 48 uur op de afdeling verblijven waarna de patiënt overgeplaatst wordt naar de specialisme afdeling of ontslagen naar huis. De patiënten in de AOA hebben verschillende levels van zorg nodig.
Onderzoeksprobleem
De Acute Opname Afdeling in Rijnstate heeft verschillende problemen opgemerkt die van invloed zijn op de werkdruk van de verpleging, namelijk de onvoorspelbare fluctuatie in de zorgzwaarte van patiënten, toenemend aantal patiënten voor de Geriatrie of met psychische problemen. Om een eerlijk verdeelde werkdruk te creëren op de afdeling kan het gebruik van een zorgzwaartemodel uitkomst bieden. Daarom is het onderzoeksdoel van deze thesis: Het verbeteren van de werkdruk voor
verpleging in de Acute Opname Afdeling bij het in acht nemen van een optimaal
verpleging-zorgzwaarte ratio voor de acute patiënten. Een verpleging-zorgzwaartemodel wordt gebruikt als hulpmiddel om
een eerlijk verdeelde werkdruk tot stand te brengen. Bovendien, kan dit hulpmiddel worden gebruikt om van tevoren de verpleging in te roosteren en te beslissen of een flexibele verpleegkundige nodig is.
Aanpak
Dit onderzoek is in twee gedeeltes verdeeld; in het eerste deel wordt een model ontworpen en in het tweede deel wordt dat model getest. De analyse van de huidige situatie, observatie, literatuurstudie en benchmark heeft geleid tot het zorgzwaartemodel ‘Jones Dependency Tool’. Met deze tool kunnen verpleegkundige patiënten classificeren in vier categorieën, gebaseerd op 12 variabelen in zes domeinen. De resultaten van dit model worden gebruikt om een relatie te bepalen tussen de intensiteit van patiënten en de werkdruk van verpleging. Eerst was geprobeerd om een meervoudige lineaire regressie model te maken voor de besluitvorming van een flexibele verpleegkundige. De werkdruk kan afhangen van de volgende onafhankelijke variabelen: zorgzwaarte van patiënten, aantal opgenomen en ontslagen patiënten in de dienst, aantal patiënten met een langere ligduur dan 48 uur en het aantal specialismes. Als er geen regressie model mogelijk is, zal de analyse van de werkdruk verder worden uitgebreid om toch een advies te geven over verpleegkundige inzet.
Resultaten
v verpleging en de zorgzwaarte van het model kwamen goed overeen (een correlatie van 0.718) net als de zorgzwaartes van patiënten die meerdere keren waren geclassificeerd (correlatie van 0.606). In de testfase was de zorgzwaarte van de patiënten laag (categorie 1 of 2). Echter de relaties die gevonden zijn in de pilot fase zijn niet zoals in de praktijk wordt ervaren. Tijdens de pilot fase waren er meer patiënten die een hoge zorgzwaarte hadden en verpleging met een hoge werkdruk maar zijn deze patiënten niet ingevuld op de scoringsformulier.
Voor de inzet van verpleging was het niet mogelijk om een meervoudige lineaire regressie model te maken met de onafhankelijke variabelen. Daarom was de werkdruk verder geanalyseerd. De resultaten van deze analyse was dat een hoge werkdruk waren ontstaan op de dinsdagen en voor specialismes was dat voor de longgeneeskunde patiënten. Een belangrijke bevinding was dat de helft van de verpleging altijd hoger of lager werkdruk heeft dan de gemiddelde werkdruk van die dienst. Deze bevinding kan een mogelijke verklaring zijn waarom een regressie model niet gemaakt kan worden. Het verpleegkundige inzet is gebaseerd op het oplossen van problemen in het systeem rond de AOA en daardoor een goede werkdruk te creëren voor de verpleging. De oplossing op langer termijn kunnen zijn: AOA richting de SEH te verhuizen, de ligduur van 48 uur niet overschrijden, loopbaanpaden creëren voor nieuwe verpleegkundigen en gebruik maken van een app of scanner om de tweede verpleegkundige te kunnen vervangen.
Conclusie
De intensiteit van zorg model is bruikbaar op de AOA, ondanks dat er nog geen relatie is gevonden met de werkdruk. De werkdruk kan worden verlaagd als alle of aantal van de oplossingen worden toegepast in de AOA.
vi
Acronyms
ADL Activities of Daily Living
AMU Acute Medical Unit
CLA Collective Labour Agreement
EHR Electronic Health Record
FIM Functional Independence Measure
IV Intravenous
JDT Jones Dependency Tool
LPN Licensed Practical Nurse
LOS Length of stay
MST Medisch Spectrum Twente
NA Nurses’ Aides
NPR Nurse-patient ratio
PCDM Patient Care Delivery Model
PCS Patient Classification System
vii
Preface
In front of you lays my thesis with the title ‘Creating a fair workload for nurses in the Acute Medical Unit of Rijnstate Arnhem’. This thesis completes my Master program Health Sciences at the University of Twente, specialisation Optimising healthcare processes. This research is performed for the Acute Medical Unit in Rijnstate Hospital. I have had the opportunity to investigate the workload of the nurses by using an intensity of care model. It was a great pleasure to perform my research at such a relatively new department of the hospital.
Along these lines, I would like to thank all the nurses of the Acute Medical Unit for completing the scoring cards. I would also like to thank Paul Joustra, my supervisor from Rijnstate for his effort to give me valuable feedback and guidance. Thirdly, I would like to thank Wim van Harten, my first supervisor of the University of Twente and CEO of Rijnstate and Derya Demirtas my second supervisor of University of Twente for all the feedback moments and guidance throughout the entire process of writing this thesis. I want to thank the manager of the AMU Yolanda van der Wal and Jildou Smilde for their effort to give me the insights of the processes in the AMU and to guide me. Last but not least, I would like to thank my family and friends for their wise counsels and kind words.
I hope you will enjoy reading this thesis.
viii
Table of contents
SUMMARY ... II
SAMENVATTING ... IV
ACRONYMS ... VI
PREFACE ... VII
1. INTRODUCTION... 1
1.1 RIJNSTATE IN THE ARNHEM ... 2
1.2 ACUTE MEDICAL UNIT ... 2
1.3 RESEARCH PROBLEM ... 3
1.4 RESEARCH OBJECTIVE AND SCOPE ... 4
1.5 RESEARCH QUESTIONS... 4
2. CONTEXT ANALYSIS ... 7
2.1 GENERAL INFORMATION ... 7
2.1.1 Acute Medical Unit in Rijnstate ... 8
2.2 NURSES ... 9
2.3 PATIENTS ... 10
2.3.1 Length of stay ... 11
2.3.2 Number of patients ... 15
2.3.3 Admitted patients ... 21
2.3.4 Discharged patients ... 24
2.4 SCHEDULING NURSES ... 25
2.4.1 Shifts ... 25
2.4.2 Float nurse ... 26
2.5 OBSERVATION ... 27
2.5.1 Structure of the observation... 27
2.5.2 Observation in the department ... 28
2.6 CONCLUSION ... 30
3. LITERATURE STUDY ... 32
3.1 GENERAL INTENSITY OF CARE MODEL ... 33
3.1.1 Patient classification system ... 33
3.1.2 Assigning nurses to patients... 35
3.1.3 Nurses’ workload ... 35
3.1.4 Length of stay ... 36
ix
3.3 ACUTE MEDICAL UNIT ... 37
3.3.1 Intensity of care models ... 37
3.3.2 Nurses’ workload ... 38
3.3.3 Forecast acute patients ... 39
3.4 SCHEDULING NURSES ... 39
3.4.1 Staffing levels ... 39
3.4.2 Float nurses ... 40
3.5 Conclusion ... 40
4. BENCHMARK ... 41
4.1 BENCHMARKING PROCESS ... 41
4.1.1 Planning phase ... 41
4.1.2 Deployment phase ... 43
4.1.3 Improvement phase ... 47
4.2 CONCLUSION ... 50
5. MODEL ... 51
5.1 THE COLLECTED INFORMATION FOR THE MODEL ... 51
5.2 INTENSITY OF CARE MODEL IN THE ACUTE MEDICAL UNIT ... 52
5.2.1 Variables ... 52
5.2.2 Requirements of the model ... 52
5.2.3 Models from literature ... 53
5.3 NURSE STAFFING ... 54
5.3.1 Variables ... 54
5.3.2 Requirements of the model ... 55
5.4 FINAL MODEL ... 55
5.4.1 Intensity of care model... 55
5.4.2 Nurse staffing ... 57
5.4.3 Assumptions ... 57
5.5 CONCLUSION ... 58
6. EXPERIMENTAL DESIGN ... 59
6.1 INTENSITY OF CARE ... 59
6.1.1 Measurement period ... 59
6.1.2 Validation and reliability of the model ... 61
6.2 NURSE STAFFING ADVICE ... 62
6.2.1 Validation and reliability of the nurse staffing model ... 64
x
7. RESULTS... 66
7.1 RESULTS FROM THE MODELS ... 66
7.1.1 Intensity of care ... 67
7.1.2 Workload ... 72
7.2 NURSE STAFFING ... 80
7.3 CONCLUSION ... 83
8. CONCLUSION AND RECOMMENDATION ... 85
8.1 CONCLUSION ... 85
8.2 DISCUSSION ... 85
8.2.1 Intensity of care ... 86
8.2.2 Nurse staffing ... 87
8.2.3 Limitations ... 89
8.3 RECOMMENDATION ... 90
8.4 FURTHER RESEARCH ... 91
REFERENCES ... 93
APPENDIX A. OBSERVATION LOG ... 97
APPENDIX B. DATA OF OBSERVATION ... 98
APPENDIX C. SEARCH STRATEGY ... 104
APPENDIX D. INTERVIEW SCHEME FOR BENCHMARK ... 107
APPENDIX E. SCORING CARD FOR INTENSITY OF CARE AND WORKLOAD ... 111
APPENDIX F. SPSS RESULTS FOR INTENSITY OF CARE AND WORKLOAD ... 112
1
1.
Introduction
In healthcare, it is important to provide a high quality of care. Considering the changing healthcare system, particularly in view of the rise of new technologies, the ageing population and the complexity of the diseases, it is necessary to pay attention to the provision of effective care. Thus the aim is to improve the quality of care1. The quality of care is typically said to depend on six factors, namely safety,
effectiveness, efficiency, patient-centredness, timeliness, and equity2.
In the Netherlands, care is split into two sections: acute care and elective care3. In acute care,
treatment must commence as soon as possible, while considering the correct diagnosis3. In the last
decade, professionals in the acute care chain have experienced an increased workload, caused by the ageing population and the changes in the healthcare system4. Because of the ageing population,
hospitals in the acute care chain have experienced an increase in admissions. Moreover, the patients have more severe diseases than they had in previous decades, they also have more multiple comorbidities4.
Both acute care and elective care can be described by means of the Patient Care Delivery Model (PCDM). This model illustrates how aspects of care are interrelated5,6. It focuses on the input,
throughput, output and outcome of care. Examples of aspects that can influence healthcare are the characteristics of the patient, the nurse, and the health care system5,6. Patients who for example
require complex care increase the workload of nurses. Another example which can negatively influence the workload of the nurses is a significant proportion of low-skilled nurses or outsourced nurses who interrupted the continuity of the department5,6.
Given that a significant proportion of the healthcare professionals is nursing staff, it is important that the nurses perceive the workload during their shifts as fair. Although many nurses are working in hospitals, a shortage of full-time nursing staff in the Netherlands is expected by 20207. The staff
shortage will lead to increased workload of the working nurses.
Nurses typically have a maximum number of patients that they can take care of during a shift. The maximum capacity depends on the patients’ needs for care and the hospital. The aim is to schedule nurses by the correct nurse-to-patient ratio (NPR)8, so that costs are as low as possible, yet quality is
guaranteed. It is essential to determine the right nurse-patient ratio: a low NPR has proven to lead to a higher mortality rate, a higher chance of complications, errors, and lower job satisfaction8. With a
2 tasks are left unfinished, which can lead to unsafe situations9. In turn, unsafe situations lead to a lower
quality of care2. However, a high NPR is not desirable either. A high NPR leads to an increase in costs
for the hospital because more nurses are needed for the same number of patients10. Advantages of
the higher nurse-patient ratio are a higher quality of care and lower mortality rates11. The average NPR
for a hospital specialising in acute care is around 1:5 – a ratio of one nurse for five patients12.
1.1
Rijnstate in the Arnhem
Rijnstate provides top quality clinical care in the regions Arnhem, Rheden and Liemers. It has four hospitals in Arnhem, Zevenaar, Velp, and Arnhem-Zuid. Rijnstate has over 4,000 employees, 287 medical specialists with 28 special fields, and 887 beds. The hospital provides medical care for up to nearly 450,000 residents. Every year around 33,500 admissions, 31,500 day treatments and over half a million outpatient clinic visits take place.
1.2
Acute Medical Unit
Rijnstate Hospital in Arnhem provides top quality clinical care in multiple departments and outpatient clinics. One of the departments is the Acute Medical Unit (AMU), which was established in 2014. The AMU is a unit for patients from the emergency department or outpatient clinic who need acute care for up to a maximum of 48 hours. Some patients are excluded from the AMU, such as pregnant women, children under the age of 18, patients in the intensive care unit, patients requiring coronary care, patients that have suffered a stroke, and psychiatric patients. When the patient has stayed in the AMU for 48 hours of care, the patient is either discharged to a subsequent department for follow-up care or is sent home.
3
1.3
Research problem
The AMU struggles with several bottlenecks, among others the fluctuation of the patients’ intensity of care, which influences the nursing workload. The fluctuation of patients is examined with historical data on patterns. The data are classified into medical specialties and analysed to give insight in the number of patients and nurses. These data allow to display the number of patients for any random day in any random month. As mentioned in section 1.2, not all factors that influence the acute care were taken into account in the analysis of the data. Therefore, it is difficult to foresee the required medical specialties and the patients’ intensity of the care.
In the present situation, nurses are assigned to patients according to the required intensity of care at the start of the shift. The standard ratio of nurses to the intensity of care of patients is unknown. However, at the beginning of the nurses’ shift the NPR is around the 1:6 for the number of nurses assigned, in relation to the intensity of care of the patients. The nurse in charge of the previous shift assigns the nurses to the patients who are admitted to the department, or who are expected to be admitted during the shift. The unpredictable patients’ intensity of care expected to be admitted in the department is problematic.
The number of patients in the medical specialty Geriatrics has increased considerably. These types of patients need more care than patients of other medical specialties13,14. This is equally true for acutely
ill patients with psychiatric problems. Currently, the need of more care for these types of patients is not being taken into account in the model that assigns nurses to patients. As a result, nurses are confronted with a high workload13.
The three bottlenecks mentioned in the three paragraphs above lead to the following problems: the unknown number of patients who will be admitted during a shift, the allocation of the float nurses at the beginning of the shift, and the scheduling of nurses in advance. A fair workload is between 1 and 3 on a scale of 5, whereas an unfair workload scores 4 or 5. These bottlenecks and problems of an unfair workload can be placed in the framework developed by Hans et al.15 on resource capacity
planning for tactical and operational levels. The unfair workload and the float nurses lead to problems on operational levels, both offline and online. The scheduling of nurses poses a problem at a tactical level. In the current situation, the decision to establish the need for a float nurse at the beginning of the shift has not yet been implemented.
4
1.4
Research objective and scope
The problem described in section 1.3 leads to the following main research objective:
To improve the alignment of the workload for nurses in the Acute Medical Unit, by taking into account
the optimal ‘nurse-intensity of care’ ratio for acute patients.
The present situation of patients in the department and their complexity of care is analysed to obtain information about the characteristics of the patients. An intensity of care model is used to create a tool that can establish a more balanced workload for the nurses. Moreover, the tool can be used to schedule nurses in advance and to consider whether the departments are in need of a float nurse. For the tool to be effective, it has to be objective and unambiguous. The tool is thus tested in the AMU. The AMU will be benchmarked with other Acute Medical Units in the Netherlands.
The research objective is supplemented with sub-questions that will be answered in the subsequent chapters. The research question and the sub-questions of each chapter are discussed in section 1.5.
1.5
Research questions
The research objective as formulated in section 1.4 is achieved when the following research questions and the subsequent sub-questions have been answered.
Chapter 2: Context analysis
Research question: What is the current situation of the nurses and the patients in the department?
Sub-questions:
- What is the skill mix of the nurses in the Acute Medical Unit in Rijnstate Hospital?
- How are the nurses scheduled in the department?
- How does the department currently handle the fluctuations of the number of patients?
o Are ad hoc decisions made for hiring personnel?
o Are there restrictions on how many staff can be hired?
- What was the length of stay (LOS) of patients over the last two years?
- What are the requirements and restrictions for the deployment of a float nurse?
5 patients in different medical specialties over the last two years and on the bed occupancy during that period.
Chapter 3: Literature study
Research question: What models are offered in the literature for the intensity of care and the allocation
of nurses to patients? Sub-questions:
- What is the ‘standard’ nurse-patient ratio for all of the Acute Medical Units?
- Which intensity of care models are already known in the literature?
- What type of scheduling is used in the models presented in the literature?
- Which factors are important to predict the number of acute patients?
In this chapter, a literature study is conducted in order to establish an overview of the information about the intensity of care models in healthcare, and the manner in which the patients are categorised according to the levels of care. Moreover, the literature study serves to collect information about the scheduling of nurses.
Chapter 4: Benchmark
Research question: How does the performance of the Acute Medical Unit in Rijnstate compare to other
similar Acute Medical Units in hospitals in the Netherlands?
Sub-questions:
- Which intensity of care model do other AMUs in hospitals in the Netherlands use?
- Which factors are important according to other AMUs for the implementation of an intensity
of care model in the department?
In this chapter, the AMU in Rijnstate is benchmarked with similar hospitals in the Netherlands to establish how the AMU in Rijnstate performs. The benchmark is finalised by considering the steps of benchmarking that have been derived from the reviewed literature.
Chapter 5: Models
Research question: Which intensity of care models are applicable to the AMU?
Sub-questions:
- How can the model be used to establish a balanced workload for the nurses?
- What for nurse staffing models are useful for the AMU?
6 On the basis of this analysis, the best model is chosen. A model is preferres as the model is be able to create a balanced workload, schedule the nurses in advance, and decide whether there is a need for a float nurse.
Chapter 6: Experimental design
Research question: How does the model perform in the AMU?
Sub-questions:
- Which approaches can be used to test the model?
- How can the model be used to schedule the nurses?
- How can the model help to decide whether a float nurse is required at the beginning of a shift?
In this chapter, the approach to testing the model is explained, followed by the use of the intensity of care model for the decision of a float nurse. The model inputs and the validation of the model are also described.
Chapter 7: Results
Research question: What are the results of the implementation of the Jones Dependency Tool in combination with the nurse staffing model?
Sub-questions:
- Does the model result in a fair workload for the nurses?
- Is the model useful to schedule the nurses in advance?
- Does the model help managers to decide on the need for a float nurse at the beginning of a shift?
The model has to be implemented in the department. This chapter will describe and clarify the results obtained through the implementation of the model with regard to the balanced workload for nurses, the scheduling of nurses in advance and making decisions on the need for a float.
Chapter 8: Conclusion and recommendations
Research question: What is the conclusion of this study with recommendations?
7
2.
Context analysis
This chapter defines the context of the study at hand. The goal is to obtain more insight into the procedures of the AMU in Rijnstate. The chapter considers the research question: What is the current
situation of the nurses and the patients in the department?
In order to answer this question, information on both the nurses and patients is discussed. Particular attention is paid to the nurses’ skill mix and the manner of scheduling. Moreover, the data of patients in the AMU are analysed, to define a basis for the development of the model. The focus of the analysis is on the LOS of patients in different medical specialties over the past two years and on the bed occupancy during that period.
2.1
General information
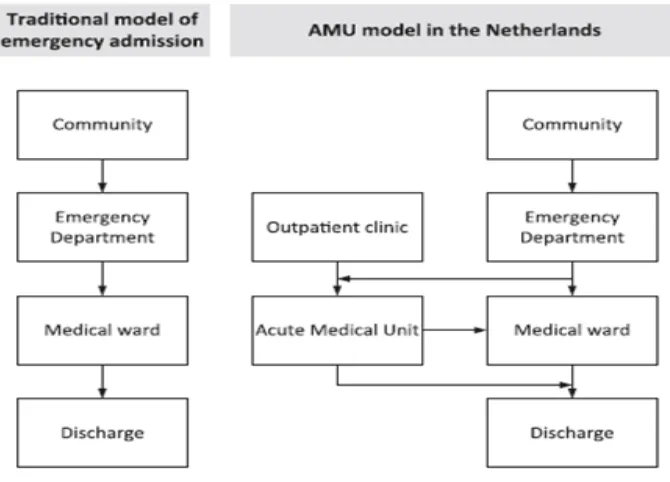
[image:17.595.129.464.474.715.2]The AMU is an extra department for patients from the emergency department or the outpatient clinic. Figure 1 shows a flow chart of the admissions of patients before and with AMU. The AMUs in the Netherlands differ in naming, location (near the emergency department or not), maximum LOS and number of beds, nurses, and physicians. These variations made it difficult to create a common benchmark.
8 In most cases, the emergency physicians are responsible for the department. The personnel of the AMU works in multidisciplinary teams focusing on acute diagnostics and treatments. These teams, consisting of highly educated professionals, can handle a high turnover in patients and yet maintain a high quality of care for the acute patients16.
2.1.1 Acute Medical Unit in Rijnstate
At the start in April 2014 the AMU had a capacity of 38 beds. In November 2015 the number of beds was increased to 56. The beds are for admitted patients who were discharged from the emergency department or the outpatient clinic. The directive is that patients stay in the AMU department for a maximum of 48 hours. The department is divided into three wards and is located on the seventh floor. The emergency department, radiology and operating theatres are located on the first floor. An ideal AMU is located close to the emergency department. When the AMU is located far from the emergency department, the patient flow from the emergency department to the AMU is smaller, which results in a full emergency department.
The performance of the AMU depends on the hospital as a whole. If the other departments in the hospital are reaching full capacity, the AMU cannot transfer patients to these departments. The patients remain in the AMU, with the result that the AMU reaches full capacity. When the AMU is full, the patients from the emergency department cannot be forwarded to the AMU. These emergency patients were admitted to the specialist departments, but they do not have sufficient personnel to admit patients. Fifteen percent of all patients were directly admitted to the specialist departments. The reasons why patients could not be admitted to the AMU were: a ward of the AMU converted into an influenza ward (patients stay longer and occupy beds for the patients from the emergency room); in summer 2016 the AMU has to close 12 beds for a department that was relocated (the relocated department take this beds over for taking care of their patients); the Pulmonology department has too many patients so patients destined for that department in the AMU could not be transferred to the Pulmonology department (and thus occupied beds for patients from the emergency room).
The department is full when all 56 beds are occupied. In some cases, the manager of the department decides to close some beds during a shift due to the shortage of nurses. During that shift, the nurse in charge may increase the number of available beds if the intensity of care allows it. In the following sub-chapters, the bottlenecks from section 1.3 will be illustrated by means of graphs and tables.
9 patients. These decisions involved the following periods:
Augustus 2016; 12 beds for relocation of a department February 17 to April 13, 2015; influenza ward
February 23 to April 8, 2016; influenza ward
December 19, 2016 to March 23, 2017; influenza ward
The patients in the influenza ward stayed longer and thereby occupied beds that would normally have been available to patients from the emergency room or the outpatient department. In the periods in which an influenza ward was in place, the patient flow within the department was lower, and the average LOS was higher.
2.2
Nurses
Information about nurses was acquired from the database of the hospital. The data illustrate a skill mix of the nurses that can be sorted into three categories: registered nurses (RN), licensed practical nurses (LPN) and nurses’ aides (NA).
During the past two years, the AMU was party to a total of 116 employment contracts, of which 79 contracts were for nurses and eleven for NAs. The majority of the nurses started with a contract of indefinite duration. Fifteen contracts were zero-hour contracts, with a maximum of 36 hours. There were 23 qualified RNs and 29 LPNs. The nurses and NAs have a contract of 0 to 1 FTE. The data show a total FTE of 68.85. The department needs 39.5 FTE nurses a week.
In total, nurses were absent 140 times in the period between January 1, 2015 and December 31, 2016. The causes can be divided into ‘illness’, ‘illness due to pregnancy’, and ‘maternity leave’. Table 1 provides an overview of the absences in 2015 and 2016. The high absence due to illness in 2016 was caused by the fact that one nurse was ill three times for a total period of 291 days. When this person is not taken into account, the average number of absent days is 8 in 2016 in comparison to 6.4 in 2015.
Table 1. Absenteeism of employees in 2015 and 2016
Absenteeism 2015 (cases of sick leave)
2015 (number of
days)
2016 (cases of sick leave)
2016 (number of
days)
Ill 58 369 74 861
Ill due to pregnancy
1 158 2 42
Maternity leave 2 230 3 250
10 days was calculated as of the day that the nurse first reported his or her illness. The table shows many days of absence in March. However, the number of reported sick leave cases was low, which illustrates that the nurses were ill for a longer period. The same can be said for April. In November the number of absences was high, with the highest number of reported cases of sick leave for that period. This means that the nurses who were ill were absent for a shorter period than during the other two months. The reason for the high number of days in March is the employee mentioned above, who was absent for 291 days in total. This employee reported the illness in March.
Table 2. Absenteeism per month
Month Cases of sick leave Number of days
Jan 21 109
Feb 12 107
Mar 9 325
Apr 9 186
May 10 167
Jun 5 127
Jul 6 157
Aug 11 145
Sep 9 159
Oct 13 101
Nov 14 201
Dec 21 126
Grand total 140 1910
2.3
Patients
This paragraph discusses the data on patients in the years 2015 and 2016, as derived from the hospital’s database. The patterns were analysed in accordance with the following variables17,18:
- LOS
- Average number of patients in a day
- Average number of patients per medical specialty in a day - Mortality rate
- Number of beds
- (Average) number of admitted patients - Discharge of patients
- Arrival pattern of patients per medical specialty
11 these patients, the column with the patient number was deleted, so only the admitted mutation number was left for the patient. Five columns were created in the data file, so a new patient number and the LOS per patient could be determined. In the end, 18,944 patients passed through the AMU in 2015 and 2016. These patients had a total of 40826 admitted mutations, which means that some patients had multiple changes. A change can be a change in bed, medical specialty, or ward. The patient number was established by looking at the mutation number. If the mutation number was the same as above, the patient number remained the same. For every mutation, the LOS was calculated by subtracting the end date and time from the start date and time. Thereafter the LOS per patient number was summed up.
2.3.1 Length of stay
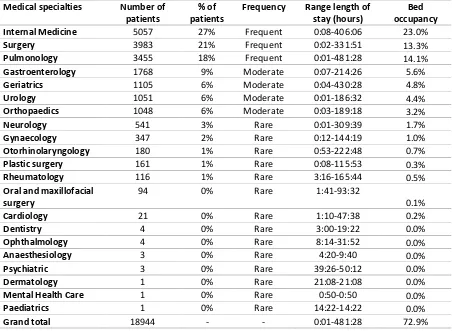
For the purpose of gaining insight into the patients’ LOS, data were analysed on the minimum LOS and the maximum LOS of the AMU patients for each of the medical specialty. Table 3 displays the results of this analysis. The medical specialties are categorised into three levels of LOS, based on percentage: where the number of patients accounts for 18% of the total number of patients or more in the AMU, the category is labelled as ‘frequent’. Percentages ranging between 5 to 18% are labelled as ‘moderate’, and percentages of 5% or less are labelled as ‘rare’19. Table 3 illustrates that the units
Internal Medicine, Surgery and Pulmonology have the highest frequency. The patients of these medical specialties account for almost 70% of the total number of patients in the AMU. The remaining 30% is primarily made up of the four medical specialties with a more moderate frequency.
Where the table shows a low minimum LOS, this can be explained by patients changing from one medical specialty to another. Eighty-five patients (0.45% of all patients) were admitted for less than one hour. From these patients, 94% stayed longer in a department in the hospital. The other 6% were discharged from the hospital at the same time that they were discharged from the AMU. The high maximum LOS is the result of patients who were admitted to the ward equipped for influenza patients. These influenza patients were not transferred to other departments until they were cured.
12 Table 3. Per medical specialty the number of patients and length of stay
Medical specialties Number of patients
% of patients
Frequency Range length of stay (hours)
Bed occupancy Internal Medicine 5057 27% Frequent 0:08-406:06 23.0%
Surgery 3983 21% Frequent 0:02-331:51 13.3%
Pulmonology 3455 18% Frequent 0:01-481:28 14.1%
Gastroenterology 1768 9% Moderate 0:07-214:26 5.6%
Geriatrics 1105 6% Moderate 0:04-430:28 4.8%
Urology 1051 6% Moderate 0:01-186:32 4.4%
Orthopaedics 1048 6% Moderate 0:03-189:18 3.2%
Neurology 541 3% Rare 0:01-309:39 1.7%
Gynaecology 347 2% Rare 0:12-144:19 1.0%
Otorhinolaryngology 180 1% Rare 0:53-222:48 0.7%
Plastic surgery 161 1% Rare 0:08-115:53 0.3%
Rheumatology 116 1% Rare 3:16-165:44 0.5%
Oral and maxillofacial surgery
94 0% Rare 1:41-93:32
0.1%
Cardiology 21 0% Rare 1:10-47:38 0.2%
Dentistry 4 0% Rare 3:00-19:22 0.0%
Ophthalmology 4 0% Rare 8:14-31:52 0.0%
Anaesthesiology 3 0% Rare 4:20-9:40 0.0%
Psychiatric 3 0% Rare 39:26-50:12 0.0%
Dermatology 1 0% Rare 21:08-21:08 0.0%
Mental Health Care 1 0% Rare 0:50-0:50 0.0%
Paediatrics 1 0% Rare 14:22-14:22 0.0%
Grand total 18944 - - 0:01-481:28 72.9%
Figure 2 shows a histogram depicting the length of stay for the period of 2015-2016. In 83% of the cases, the patients’ stay did not exceed the arranged time of 48 hours. When a patient stays longer than 48 hours, in 45% of the cases the patients’ stay in the department was longer than 72 hours. This can be explained by the patients staying in the influenza ward during three extended periods of time in 2015-2016, as mentioned in section 2.1.1.
Figure 2. Histogram length of stay with a range of six hours
0 1000 2000 3000 4000 5000
0-6 6-12 12-18 18-24 24-30 30-36 36-42 42-48 48-54 54-60 60-66 66-72 >72
Fr
e
q
u
e
n
cy
Range (hours)
13 There are three peaks in the histogram in Figure 2. In the first two peaks, the medical specialty Internal Medicine, Pulmonology and Surgery were responsible for around 75% of the patients. In the last peak, 2,078 patients stayed in the AMU for more than 60 hours. That peak is caused by the medical specialties Internal Medicine, Pulmonology and Surgery (83%). Most of the 2,078 patients stayed between 60 and 99 hours (73%).
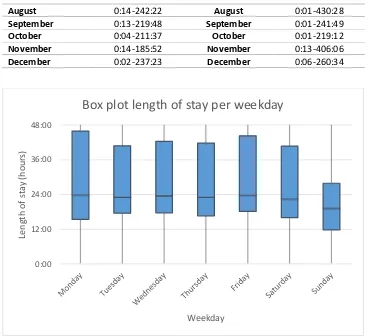
[image:23.595.78.517.349.597.2]Figure 3 reflects the LOS clustered per month. The average LOS of every month is around 24 hours. The maximum values fall outside the chart, therefore Table 4 was created. The ranges of LOS are displayed in Table 4, which allows us to identify the maximum LOS. The highest LOS was during the period in which there was an influenza ward. Moreover, the table shows that there was a high LOS in August 2016. This can be explained by high number of patients in the medical specialty Internal Medicine in that month. As a result, the patients staying in the AMU could not be transferred to the department of Internal Medicine and had to prolong their stay in the AMU.
Figure 3. Boxplot length of stay per month
Table 4. Range of length of stay in hours per month per year per patient per medical specialty
Month 2015 Range (min-max LOS in hours)
Month 2016 Range (min-max LOS in hours) January 0:08-309:39 January 0:02-237:23
February 0:42-324:14 February 0:03-329:57
March 0:20-481:28 March 0:16-274:20
April 0:25-187:40 April 0:04-265:36
May 0:08-232:24 May 0:05-262:37
June 1:01-203:14 June 0:07-256:14
July 0:17-214:26 July 0:06-258:31
0:00 12:00 24:00 36:00 48:00
Jan Feb Mar AprMay Jun Jul Aug Sep Oct Nov Dec Jan Feb Mar AprMay Jun Jul Aug Sep Oct Nov Dec
Leng
th
o
f
st
ay
(h
o
u
rs
)
Month 2015 and 2016
14
August 0:14-242:22 August 0:01-430:28
September 0:13-219:48 September 0:01-241:49
October 0:04-211:37 October 0:01-219:12
November 0:14-185:52 November 0:13-406:06
[image:24.595.114.482.67.403.2]December 0:02-237:23 December 0:06-260:34
Figure 4. Box plot length of stay per weekday for the day on which a patient is admitted
The boxplot in Figure 4 reflects the LOS per weekday. The boxplot shows that 50% of the patients admitted on a Monday stay in the AMU for 24 hours. When a patient is admitted on a Sunday, their stay in the AMU is shorter as compared to other days. A patient that has been admitted to the AMU on Monday has a 25% chance of staying 48 hours or more in the AMU. On the other days, 75% of the patients were discharged within less than 48 hours.
Table 5 displays the range of the minimal and maximal LOS. The range of maximum hours varies considerably (265-481 hours). The weekends and Mondays saw the shortest stays, whereas the longest stays were noticed on the other weekdays. The patients admitted on Mondays, Thursdays, Saturdays or Sundays were not admitted to the influenza ward or in the summer period. On the other days, the patients were admitted in one of these two periods. The reason for the shorter stays is the same as explained for Table 3. When the patients with an LOS of one hour or lower were excluded, the minimum hours range between 1:01-1:14 hours.
0:00 12:00 24:00 36:00 48:00
Leng
th
o
f
st
ay
(h
o
u
rs
)
Weekday
15 Table 5. The range of length of stay per weekday for the day on which a patient is admitted
Weekday Range of length of stay (min-max in hours) Monday 0:06-329:57
Tuesday 0:01-430:28
Wednesday 0:07-406:06
Thursday 0:01-302:13
Friday 0:04-481:28
Saturday 0:01-300:28
Sunday 0:02-265:36
2.3.2 Number of patients
The number of patients is calculated by the Excel function countif. First the number of patients is counted for the date and hour in the column date of admissions. The second step is the same but is counted in the column date of discharge. From the first step, the second step is subtracted to calculate the number of patients for every hour on each day in the years 2015 and 2016.
As shown in Figure 5, the average number of patients on a day varies. The maximum number of beds is 56, yet an average occupancy of 56 beds per day is never reached. This does not mean, however, that the ward was never full. In Figure 6 the maximum number of patients per day is shown. The average number of patients is between 14 and 50, while the maximum number of patients is between 19-56.
The variation in the number of patients is high. Figure 5 and Figure 6 both reflect a wave pattern. In the first months of 2015, the number of beds was lower than in the months that followed. The number of patients changes gradually. When the department has a certain number of admitted patients during a certain period of time, this number varies little during the days that follow.
In 2015, the variation in the number of patients remained stable in comparison to the period between November 2015 and December 2016. Between November 2015 and December 2016 there was a high fluctuation of patients. Large numbers of patients were seen between January 2015 and April 2015, in November 2015, between March 2016 and April 2016, in September 2016 and in December 2016.
16 is discharged on 2 January at 14:30, the patient is counted at 14:00, and if a patient is admitted on 2 January at 14:40 the patient is also counted at 14:00 hour. Thus, the patients were counted double but there was only one bed occupied.
Figure 5. Average number of patients per day
10 15 20 25 30 35 40 45 50 55 1 -J an -1 5 1 -F e b -1 5 1 -M ar -1 5 1 -Ap r-1 5 1 -M ay -1 5 1-Ju n -15 1 -J u l-15 1-Au g-15 1 -S e p -1 5 1-O ct -15 1 -No v-1 5 1-D e c-15 1 -J an -1 6 1 -F e b -1 6 1 -M ar -1 6 1-Ap r-16 1 -M ay -1 6 1-Ju n -16 1 -J u l-16 1 -Au g-1 6 1 -S e p -1 6 1 -O ct-1 6 1 -No v-1 6 1 -D e c-1 6 N u mb er o f p at ien ts Date
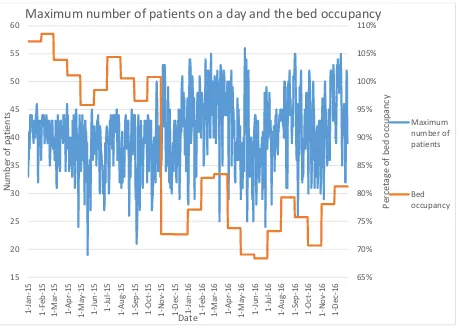
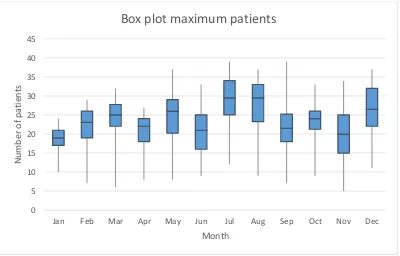
17 Figure 6. The maximum number of patients a day and the average bed occupancy per month
Figure 7 and Figure 8 show the box plots of the maximum number of patients per month and day of the week.It is remarkable that the months in which the average number of patients was the lowest had the maximum number of patients in a day. Most months reflect a wide range with regard to the maximum number of patients. The median of the months has a range of 38-44.5. In the periods in which there was a low number of patients on average, a high number of patients was measured on some individual days. This explains why the range of the month July is wide and has the highest median of all months.
65% 70% 75% 80% 85% 90% 95% 100% 105% 110% 15 20 25 30 35 40 45 50 55 60 1 -J an -1 5 1 -F e b -1 5 1 -M ar -1 5 1 -Ap r-1 5 1 -M ay -1 5 1 -J u n -1 5 1 -J u l-15 1 -Au g-1 5 1 -S e p -1 5 1-O ct -15 1-N o v-15 1 -D e c-1 5 1 -J an -1 6 1 -F e b -1 6 1 -M ar -1 6 1 -Ap r-1 6 1 -M ay -1 6 1 -J u n -1 6 1 -J u l-16 1-Au g-16 1-Se p -16 1 -O ct-1 6 1 -No v-1 6 1 -D e c-1 6 P er cet ag e o f b ed o cc u p an cy N u mb er o f p at ien ts Date
Maximum number of patients on a day and the bed occupancy
Maximum number of patients
18 Figure 7. Box plot maximum number of patients clustered per month
[image:28.595.110.486.481.702.2]Figure 8 shows the box plot depicting the maximum number of patients per weekday. The number of patients is the highest on Tuesdays and Fridays; Sundays and Mondays have the lowest number of patients. The number of patients fluctuates heavily throughout the week. However, the number of nurses does not fluctuate. The number of nurses is scheduled according to a basic shift schedule, which is presented in Table 11.
Figure 8. Box plot maximum number of patients clustered per day
0 5 10 15 20 25 30 35 40 45
Jan Feb Mar Apr May Jun Jul Aug Sep Oct Nov Dec
N
u
mb
er
o
f
p
at
ien
ts
Month
Box plot maximum patients
0 5 10 15 20 25 30 35 40 45
Monday Tuesday Wednesday Thursday Friday Saturday Sunday
N
u
mb
er
o
f
p
at
ien
ts
Day
19 For every day and hour of the day, the patterns have been determined. Figure 9 illustrates the number of patients per hour. For every day the highest number of patients on the ward was measured at 11:00. After 11:00, the number of patients decreased, until an increase occurred around 16:00. On Sundays and Mondays, the lowest number of patients was measured between 0:00 and 11:00. This accounts for a difference of approximately 500 patients when compared to the other days. Tuesdays almost consistently had the highest number of patients every hour, compared to the other days of the week. In contrast, on Sunday the number of patients per hour was almost always the lowest.
Figure 9. Number of patients per hour per day
Table 6 reflects the daily average number of patients staying in the department per month, divided over the years 2015 and 2016. This number ranges between 34 to 104, with an average of 70 patients on a day. Where the average number of patients is higher than the maximum number of beds, many patients were discharged on the same day. Although the number of beds was lower in 2015, many patients were still discharged. In the winter months, the number of patients was higher than in the other months. The number of patients was lower in summer.
Table 6. Minimum, maximum, and average number of patients on a day in the department per month for two years
Month 2015
Average number of patients (minimum-maximum)
Month 2016 Average number of patients (minimum-maximum) Jan 72 (52-85) Jan 75 (47-104)
Feb 70 (54-81) Feb 81 (60-101)
Mar 71 (54-86) Mar 81 (47-100)
Apr 68 (47-84) Apr 71 (52-89)
20
Jun 66 (46-82) Jun 65 (37-89)
Jul 65 (50-79) Jul 67 (46-87)
Aug 63 (44-86) Aug 71 (44-93)
Sep 63 (38-83) Sep 73 (51-95)
Oct 67 (37-97) Oct 68 (43-92)
Nov 68 (48-99) Nov 72 (50-89)
Dec 70 (52-95) Dec 75 (52-96)
Total 67 (34-99) Total 72 (37-104)
Specialist fields
Table 7 shows the percentage of admitted patients per day, divided by specialist field. The table shows that there is a peak of admitted patients on Fridays, although only for the field of Geriatrics has its highest number of admitted patients of the week on Fridays. With regard to the other specialties, the peak is spread throughout the week.
Table 7. Percentage admitted patients per medical specialty on a day in the week
Medical specialties Monday Tuesday Wednesday Thursday Friday Saturday Sunday Internal Medicine 31% 28% 29% 29% 30% 28% 26%
Surgery 22% 23% 23% 21% 23% 24% 27%
Pulmonology 21% 21% 20% 20% 18% 20% 18%
Gastroenterology 8% 11% 10% 12% 11% 9% 9%
Geriatrics 6% 7% 6% 6% 7% 6% 5%
Urology 7% 5% 6% 6% 6% 7% 8%
Orthopaedics 5% 5% 6% 6% 6% 6% 6%
Total 12% 15% 14% 13% 25% 14% 6%
Mortality rate
The analysed data show that the mortality rate was low during the period between January 1, 2015 and December 31, 2016. On average, the AMU had a mortality rate of 0.45%. This mortality rate does not influence the nurses’ workload and, has therefore not been included in the analysis.
Number of beds
Figure 10 shows the maximum number of occupied beds per day. Approximately a third of the days reflect a maximum of 41 to 45 occupied beds. This is followed by an occupancy of 36-40 beds.
21 Figure 10. Histogram for the maximum number of occupied beds per day for two years
2.3.3 Admitted patients
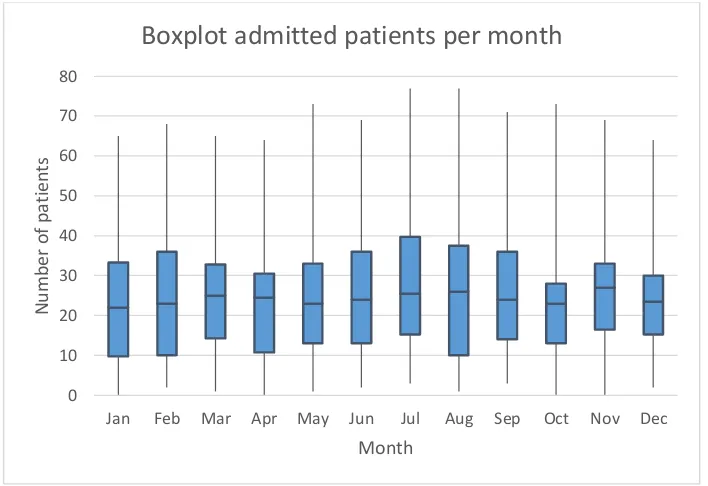
[image:31.595.128.471.408.627.2]The number of admitted patients in 2015 and 2016 was analysed; Figure 11, Figure 12 and Figure 13 reflect the results of this analysis. The range of admitted patients in Figure 11 lies between 0 and 77 per day. For both years, the distribution of the admitted number of patients is almost the same. A maximum of four patients more were admitted in 2016 as compared to 2015. The median, first and third quartile reflect a difference of one patient for both years. It can be concluded that, on average, 24 patients were admitted per day on average in both 2015 and 2016.
Figure 11. Box plot of the number of admitted patients per year
Figure 12 displays the number of patients admitted per month. The averages of the number of admitted patients on a day per month are close, with a range of 22 to 27 patients. The months of July, August and November reflect the highest average of admitted patients, whereas January, February, May and October account for the lowest number of patients on average. The maximum number of admitted patients were measured for July and August. This is remarkable, because the number of patients during these two months was low, as shown in Figure 5. This implies that both months had a
-50 50 150 250
0-10 11-15 16-20 21-25 26-30 31-35 36-40 41-45 46-50 51-55 56
Fr
e
q
u
e
n
cy
Range for occupied beds
Histogram maximum occupied beds
0 10 20 30 40 50 60 70 80
2015 2016
N
umbe
r
o
f
admi
tt
e
d
pat
ie
nts
Year
22 high turnover.
Figure 12. Box plot of the admitted patients per month
Figure 13 illustrates the number of admitted patients per day. The highest number was measured on Thursdays and Fridays. The average number of admitted patients was ranged between 22.5 and 26. It is remarkable that the average number of admitted patients on Sundays was one of the highest. Sundays had the smallest range of admitted patients, from which it can be concluded that the lowest number of patients was admitted on that day. When the number of admitted patients is allocated to the specialist fields surgical and internal medicine, internal medicine always had more patients. The surgical units have received between 43% and 50% of the patients, and internal medicine logically received between 50% and 57% of the patients.
0 10 20 30 40 50 60 70 80
Jan Feb Mar Apr May Jun Jul Aug Sep Oct Nov Dec
N
u
mb
er
o
f
p
at
ien
ts
Month
23 Figure 13. Box plot of admitted patients per day
Table 8 shows where the patients came from, prior to being admitted to the AMU. The majority of the patients was transferred from the emergency department, followed by a much smaller number of patients that came from home and a number of patients coming from an outpatient clinic or other departments in the hospital. The remainder of the prior locations of patients is so small that they have not been included in the analysis.
Table 8. Origin of patients
Origin of the patients % of patients
Emergency department 86.79%
Home 8.91%
Outpatient/department hospital 2.93%
Nursing home 1.11%
General hospital 0.10%
Mental Health Care 0.07%
Rehabilitation centre 0.04%
Academic hospital 0.04%
Other institutions 0.02%
When patients is admitted to the AMU, they most often belong to medical specialty Internal Medicine. The number of admitted patients per medical specialty per month is shown in Table 9. For every medical specialty, the highest number of patients has been highlighted in red. The peaks within the year differ per medical specialty. Internal medicine, Pulmonology, Geriatrics, Urology and
0 10 20 30 40 50 60 70 80
Monday Tuesday Wednesday Thursday Friday Saturday Sunday
N
u
mb
er
o
f
p
at
ien
ts
Day
24 Orthopaedics have the highest number of patients in winter, whereas Surgery and Gastroenterology have the highest number of patients in spring.
Table 9. Admitted number of patients per month for frequent and moderate medical specialties
Month Internal Medicine
Surgery Pulmonology Gastro-enterology
Geriatrics Urology Ortho-paedics Jan 478 300 344 155 103 101 74
Feb 365 277 369 142 85 72 60
Mar 436 346 365 160 90 107 85
Apr 408 332 297 149 122 98 76
May 412 365 262 165 77 92 83
Jun 390 377 243 143 88 88 91
Jul 410 344 189 164 93 84 98
Aug 423 345 198 144 69 63 97
Sep 418 353 233 154 82 90 83
Oct 439 355 290 132 104 104 91
Nov 419 343 292 125 89 68 99
Dec 431 323 322 139 111 73 92
Grand Total
5029 4060 3404 1772 1113 1040 1029
2.3.4 Discharged patients
Figure 14 illustrates the distribution of discharged patients among the total number of patients per day in percent. On 600 of the 731 days the number of discharged patients was higher than 41% of all patients. This implies a high turnover of patients in the department.
Figure 14. Percentage of discharged patients among all patients on a day
In Table 10 the destination of the patients after discharge from the department is shown per medical specialty. In the majority of the cases, the patients were either transferred to another department in
0 50 100 150 200 250
Fr
e
q
u
e
n
cy
Percentage discharged patients
25 the hospital or sent home. When a patient is transferred to another department, there is little work for the nurses to do. If, however, the patient goes home and is in need of home care, the nurse is responsible for the arrangement thereof. When a patient has been discharged and goes to another institution or nursing home, it is the nurse’s responsibility to arrange for the transport of the patient.
Table 10. Patients’ destination after discharge from AMU
Destination after discharge AMU Surgery patients Gastro-enterology patients Geriatrics patients Internal Medicine patients Pulmonology patients Ortho-paedics patients Urology patients
Department 78.5% 76.4% 84.6% 77.1% 79.8% 85.5% 69.6%
Home 21.0% 23.0% 4.6% 21.6% 19.7% 13.1% 29.4%
Other institution
0.3% 0.3% 5.8% 0.8% 0.3% 0.9%
Nursing home
0.1% 0.1% 4.9% 0.1% 0.1% 0.8% 0.1%
Discharged against advice
0.1% 0.1% 0.1% 0.0% 0.5%
Adapted home
0.1% 0.1% 0.1% 0.1%
Passed away 0.1% 0.1% 0.2% 0.1%
The conclusion that can be drawn based on the analysis of the abovementioned variables is presented in section 2.6.
2.4
Scheduling nurses
The data show that the nurses were commonly scheduled two months in advance. This type of scheduling is done out of tactical considerations. On the operational level, decisions were made with regard to the employment of float nurses, nurses’ overtime, and the need for nurses from other departments.
2.4.1 Shifts
26 working hours, in comparison to the number of hours that would have been worked if the same number of nurses had been scheduled for all days of the week (10-10-6 nurses).
Table 11. Basic shift schedule
Period Day Day shift Late shift Night shift January 2015 until November 2015 Monday-Sunday 7 7 5
December 2015 until May 2016 Monday-Sunday 11 11 6
June 2016 until December 2016
Tuesday-Friday 10 10 6
Saturday 10 9 6
Sunday 9 9 6
Monday 9 10 6
The nurses’ schedules are accessible two months in advance. This corresponds to the requirements posed by the Collective Labour Agreement (CLA). These requirements, in combination with long periods of absenteeism and the outflow of nurses, make it difficult to schedule the nurses in such a way that sufficient nurses are available to provide the best quality of care.
The scheduling of the nurses cannot take fluctuations in the number of patients into. Moreover, the number of nurses fluctuates due to illness. Adjusting the number of nurses to the number of patients does not always result in creating a fair workload for the nurses. Nurses’ schedules are influenced by patients’ intensity of care, the presence of an influenza ward, staff shortages, the system of the AMU, and the location of the AMU in the hospital. The location of the AMU in Rijnstate is not ideal; it is far from the emergency room. Therefore the physicians are delayed in visiting the patients. If the system does not work well, the physicians are delayed or an influenza ward is present, the AMU cannot perform as it should. The AMU may do everything within its power, despite that not be working as it should. This is caused by the rest of the hospital. If the rest of the hospital is not functioning well, the nurses in the AMU experience an increased workload. Due to all influencing factors outside of the AMU, the correct number of nurses is difficult to justify.
The nurses are scheduled based on their experience and not on their education. If possible, there is always a nurse with extensive experience present during in the night shift. Furthermore, a charge nurse is always present during the day and late shifts. Not all nurses are charge nurses; only those capable of coordinating and working as a nurse at the same time are given this title.
2.4.2 Float nurse
In accordance with the CLA for hospitals20, it is not possible to schedule a float nurse at the start of a
27 in the hospital that hires out nurses to the departments. The three nurses are scheduled based on their availability and the need of the respective department.
Nurses from other departments can be deployed by the AMU when there is a shortage of nurses on a given shift. The team manager makes this decision. In the majority of the cases it is not possible to deploy nurses from other departments. As mentioned previously, it is also not possible to hire float nurses from Select on such short notice. When the department is confronted with a shortage of nurses, the charge nurse may be employed to take care of the patients. If there are few patients the nurses may take leave from work, in consultation with their colleagues. In a situation where there are few patients, AMU nurses can also be deployed to other departments.
2.5
Observation
This part describes the observation, during which the activities of the nurses were noted. Subsequently, the results of the observation are discussed.
2.5.1 Structure of the observation
The observation was used to decide on the intensity of care21. The activities of the nurses and the
amount of time accorded thereto were recorded. Furthermore, the nurses were asked which factors and activities contribute to a high workload, and about the workload they experience22.
Every five minutes the activities of a nurse was observed. In case the nurse performed multiple activities concurrently, every activity was noted as a single activity17,21,23. Prior to the start of the
observation, an overview of the main activities was entered into a logbook, which was concurrently updated with the additional observed activities23. Table 12 provides a description of the main activities.
The observation furthermore consisted of retrieving information on the skills and work experience of nurses24, the time, the shift, the diagnosis codes of the patients in the rooms, the acuity level in every
room, the nurse - intensity of care ratio, and the number of occupied beds17,25.
Table 12. Overview nurses’ activities
Code log Activity Description of the activity
1 Activities of daily living Bathing and showering, assisted personal hygiene, assisted dressing
2 Medication Preparation of medication, application of medication (oral/injection/infusion), documentation of medication
3 Nursing activities Maintenance of tubes/drains/catheter, inhalation therapy, collecting of specimen for investigation, conversations with
patients
28
5 Documentation Documentation in computer to update patient report, to record handover of patient to a physician/colleague and
telephone conversations
6 Handover Handover over a patient to a physician/colleague, telephone conversations
7 Patient flow Admission, transfer or discharge of a patient
8 Indirect care Contacting family, making appointments for the patient
9 Pause To eat, drink or go to the bathroom
10 Waste Solve errors by colleagues/physicians, supply of equipment
After two days and two late shifts (four observations) a sufficient amount of information was obtained to start with the development of the model on the intensity of care for acute patients. The observations were then brought to an end.
2.5.2 Observation in the department
Appendix A shows the observation log. The data retrieved by means of the observations are reflected in Appendix B. It follows from Table 13 that the most important activities consist of documentation, medication, and handing over the patients. The patient flow is one of the most time-consuming activities. When a patient is admitted to the AMU, the nurses needed approximately half an hour to complete the admission of the patient.
The activities can be divided into two types of care: direct and indirect care. Direct care can concurrently be subdivided into medication, nursing activities, observation/monitoring, and activities of daily living. In total, direct care accounts for a total of 42% of the activities. Indirect care can be subdivided into documentation, handover, contacting family, and patient flow, and accounting for a total of 53% of the activities. Indirect care is an important factor in the high workload of the nurses26.
Decreasing the amount of time spent on indirect care allows nurses to spend more time on the direct care that patients require. The other 5% of activities is for pauses and waste. The patients who required more care were mostly from the medical specialty Geriatrics and those with psychiatric comorbidity. When a patient needs medication multiple times a day, this influences the intensity of care. Other factors that influence the intensity of care are the patients’ dependency on a nurse regarding to mobility or ADL, multiple remeasuring of patients’ vital functions, or multiple observations of the patients.
Table 13. Overview activities of the observations
Activities
Average percentage
Percentage range Documentation 29.61% 24-40%
Medication 15.78% 13-18%