University of Warwick institutional repository: http://go.warwick.ac.uk/wrap This paper is made available online in accordance with publisher policies. Please scroll down to view the document itself. Please refer to the repository record for this item and our policy information available from the repository home page for further information.
To see the final version of this paper please visit the publisher’s website. Access to the published version may require a subscription.
Author(s): C A Hawley, A B Ward, A R Magnay, J Long
Article Title: Outcomes following childhood head injury: a population study Year of publication: 2004
JNNP2003020651 revised 18sept 2003textand tables
Title:
OUTCOMES FOLLOWING CHILDHOOD HEAD INJURY – A
POPULATION STUDY
Authors: Carol A. Hawley
Principal Research Fellow
Centre for Health Services Studies University of Warwick
Coventry, UK
Anthony B. Ward
Consultant in Rehabilitation Medicine North Staffordshire Rehabilitation Centre The Haywood, High Lane, Burslem Stoke-on-Trent, Staffordshire, ST6 7AG Andrew R. Magnay
Consultant in Paediatric Intensive Care Paediatric Intensive Care Unit
City General Hospital, Newcastle Road Stoke-on-Trent, Staffordshire, ST4 6QG Julie Long
Brain Injury Nurse (at time of study) North Staffordshire Rehabilitation Centre The Haywood, High Lane, Burslem Stoke-on-Trent, Staffordshire, ST6 7AG
Correspondence to: Carol Hawley
Principal Research Fellow
Centre for Health Services Studies
University of Warwick
Coventry CV4 7AL
Tel. 02476 522459 Fax: 02476 524963
Email: c.a.hawley@warwick.ac.uk
Website: www.warwick.ac.uk
Abstract
Objectives: To identify outcomes following head injury (HI) amongst a population of children admitted to one hospital centre and compare outcomes between different severity groups.
Methods:
A postal follow-up of children admitted with HI to one NHS Trust, between 1992-1998, was carried out. Children were aged 5-15 years at injury (mean 9.8), followed-up at a mean of 2.2 years post-injury. Parents of 526 injured children (419 mild, 58 moderate, 49 severe) and 45 controls completed questionnaires. Outcomes were assessed using the King’s Outcome Scale for Childhood Head Injury (KOSCHI).
Results:
Conclusions:
Children admitted with mild HI may be at risk of poor outcomes, but often do not receive routine hospital follow-up. A postal questionnaire combined with the KOSCHI to assess outcomes after HI may be used to identify children who would benefit from clinical assessment. Further research is needed to identify factors which place children with mild HI at risk of late morbidity.
Introduction
Head injury (HI) is a leading cause of mortality or permanent disability in children and adolescents.[1-3] In the United Kingdom it has been estimated that each year,
approximately 3000 children acquire significant new neurological or cognitive disability as a result of HI.[4] Head injury has been the subject of a recent UK Government
Enquiry,[5] which called for research on the incidence of HI and subsequent disability, to help inform planning for community-based health care.
For children, a head injury can lead to persistent cognitive and neurobehavioural deficits, intellectual, academic and personality adjustment problems,[6-10] and family stress.[11-13] Children with head injuries may present with a variety of prolonged difficulties and problems, all of which may interact in a complex manner.[14] Even mild HI may lead to persistent cognitive and behavioural deficits.[15,16,17]
The current study was designed to carry out a postal follow-up of all children admitted with a head injury to a single hospital centre serving one health region. The aim was to compare outcomes between different severity groups using the KOSCHI.
Method
The population forming the study group was identified utilising a comprehensive Head Injury Register of all children admitted to North Staffordshire Hospital NHS Trust with a head injury. The Register is maintained by a dedicated head injury nurse and linked to the Trauma Centre. Patients were identified retrospectively from November 1992–
December 1997, and prospectively from January to December 1998. During this period, there were 986 children on the register, of these 12 (1.2%) died as a result of the HI. In 1998 a postal questionnaire was sent to the parents of all 974 surviving children aged 5-15 years at injury. All children had been discharged from acute hospital care.
Questionnaires were completed by 526 parents, the children of 523 respondents were living in the community at the time of the survey.
For all surviving children, injury severity was determined by Glasgow Coma Scale (GCS)[20] scores and/or duration of loss of consciousness, using the classification of mild, moderate or severe head injury defined by the British Society of Rehabilitation Medicine(Table 1).[21] In North Staffordshire GCS is reliably recorded as it is used routinely in an major longitudinal study on trauma.
A control group was identified by interviewing a sub-group of 97 questionnaire
respondents (49 mild HI, 19 moderate, and 29 severe). The family was asked to identify a child without history of head injury, and the same age and sex as the injured child to act as a control. Forty-five control children participated in the study, none had a history of head injury, nor any neurological abnormality. Parents of control children completed the same checklist of current symptoms as parents of the HI group.
Measures
Questionnaire Content
A list of symptoms was devised using commonly reported problems identified from the literature and the King’s HI outpatient follow-up checklist.[19] The questionnaire explored changes in the child post HI, and covered mobility, behaviour, personality, mood, depression, anxiety, memory, attention, communication, comprehension, sleep pattern, nightmares, headaches, sensory difficulties, epilepsy, other injuries (e.g.
orthopaedic), return to school, learning difficulties, special educational needs status and school-related problems.
Questionnaires were sent to parents/guardians together with a letter explaining the study and inviting them to discuss issues raised by the survey with a head injury nurse. Four weeks later, non-responders were sent a second letter and another copy of the
Measurement of Outcome
Outcomes were calculated using KOSCHI scores derived from questionnaire responses. All questionnaires were scored, without knowledge of injury severity, by one team
member (CH), experienced in using the KOSCHI and a participant in the KOSCHI inter-rater reliability exercise.[19] The KOSCHI (Table 2) contains five main categories: 1 = death, 2 = vegetative, 3 = severe disability, 4 = moderate disability, and 5 = good recovery. Categories 3, 4 and 5 are sub-divided into a) more deficits and b) fewer deficits.
Table 2 about here
The Townsend Deprivation Index was used to measure social deprivation, using
postcodes.[22] The higher the positive score the more deprived an area and the higher the negative score the more prosperous. For the UK, the average score is zero, for North Staffordshire the average score is -0.49.
Statistical analyses were carried out using SPSS Version 9.0. Categorical data were analysed using Chi-squared tests, the Chi-squared test for trend was used to determine whether there was a linear trend across severity groups. Normally distributed
continuous data was analysed using the t-test.
Forty-eight envelopes were returned as undeliverable (addressee untraceable). Of the 926 presumed valid addresses, completed questionnaires were returned by 526
families, an overall response rate of 56.8%, averaged over 6 years of recruitment between 1992 and 1998. Response rates for different severity groups were: mild = 55.6% (419 returned/753 sent); moderate = 57.4% (58 returned/101 sent); severe = 68.1% (49 returned/72 sent). Within 2 years of injury the overall response rate was 62.8% (218 returned/347 sent), representing 173 (62.8%) mild, 23 (62.2%) moderate, and 22 (68.8%) severe.
In order to ensure that responders were representative of all children admitted to North Staffordshire NHS Trust with HI, patient characteristics of questionnaire responders were compared with those of non-responders. There were no statistically significant differences between groups. Responders were virtually identical to non-responders for sex (male: responders 70%, non-responders 67%), injury severity (responders: 80% mild,11% moderate,9% severe; non-responders: 83% mild,11% moderate,6% severe), age at injury (mean of 9.8 years: both groups), ethnicity (97% white: both groups), time since injury (mean no. years post-injury: responders 2.1, non-responders 2.5) and social deprivation (Townsend means: responders: +1.0, non-responders: +1.4).
Participants
20.2%) to 6 years post injury (57, 10.8%), with a mean of 2.2 years (SD=1.7). Characteristics of participants are shown in table 3.
Table 3 about here
The mean Townsend deprivation score for families in the HI group was +0.69 (SD=2.9). This was compared to the mean score (-0.49) for the general population of North
Staffordshire using the one-sample t-test. The difference was significant (p=0.001, t=9.08, 95%CI: 0.92 to 1.44). The majority of families lived in areas with positive scores (60.6%); 62 families (10.9%) lived in considerably deprived areas (scores of ≥+3.55), whereas 95 families (19.2%) lived in the most affluent areas (scores of ≤ –2.4). In the control group the mean Townsend deprivation score was -0.103 (SD=2.6). Townsend scores were compared for the control and HI groups using the independent samples t-test, there was no significant difference between groups (p=0.114, t=1.58, 95%CI: -0.19 to 1.76).
Other Injuries
There were no significant differences between groups. The incidence of epilepsy amongst children in the UK as a whole is 0.7-0.8%.[23]
Hospital follow-up post injury
Thirty percent (158) of the study group were followed-up by the admitting hospital after the head injury. In the mild group, 91 children (21.7%) were followed-up, however many of these appointments were due to accompanying other injuries. Half of the moderate group (29, 50.9%), and 38 of the severe group (77.6%) had a follow-up appointment. There was a significant linear trend across severity groups (p=0.0001, X2=71.37, df=1).
Only 40 children (7.6%) received any form of therapy following their head injury: 14 mild (3.3%), 8 moderate (14%), and 14 severe (36.7%). There was a significant linear trend across severity groups (p=0.0001, X2=71.25, df=1). Questionnaire respondents were invited to discuss issues raised by the questionnaire with a head injury nurse. One third of parents (182, 34.6%) accepted this offer: 131 (31.2%) in the mild group, 23 (40.4%) moderate, and 28 (57.1%) severe. There was a significant linear trend across severity groups (p=0.0001, X2=13.69, df=1).
Return to school and identification of special needs
teachers knew of the child’s head injury in only 209 cases (39.8%), (140(33.4%) mild, 32(55.2%) moderate, and 37(77.1%) severe). There was a significant linear trend across severity groups (p=0.0001, X2=40.62, df=1).
Following the HI, special educational needs (SENs) were identified for 40 children (7.6%): 23 mild (5.5%), 2 moderate (3.4%), and 15 severe (31.3%). There was a significant linear trend across severity groups (p=0.0001, X2=28.44, df=1). However, according to parents, SENs were actually provided for only 26 children (65%): 15 mild (3.6%), 2 moderate (3.4%) and 9 severe (18.8%), also showing a significant linear trend across groups (p=0.0001, X2=19.0, df=1).
At follow-up, 98 children (18.7%) were currently having difficulties with school work and there was a significant linear trend across severity groups: 65 mild (15.5%), 16 moderate (27.6%), and 17 severe (35.4%) (p=0.0001, X2=14.5, df=1). Since the HI, 96 children (18.3%) had been disciplined by the school for problem behaviour (71 mild (16.9%), 14 moderate (24.1%), 11 severe (22.9%)). Twenty-seven (5.1%) had been excluded from school (21 mild (5%), 3 moderate (5.2%), 3 severe (6.3%)). There were no significant differences between groups.
Current symptoms
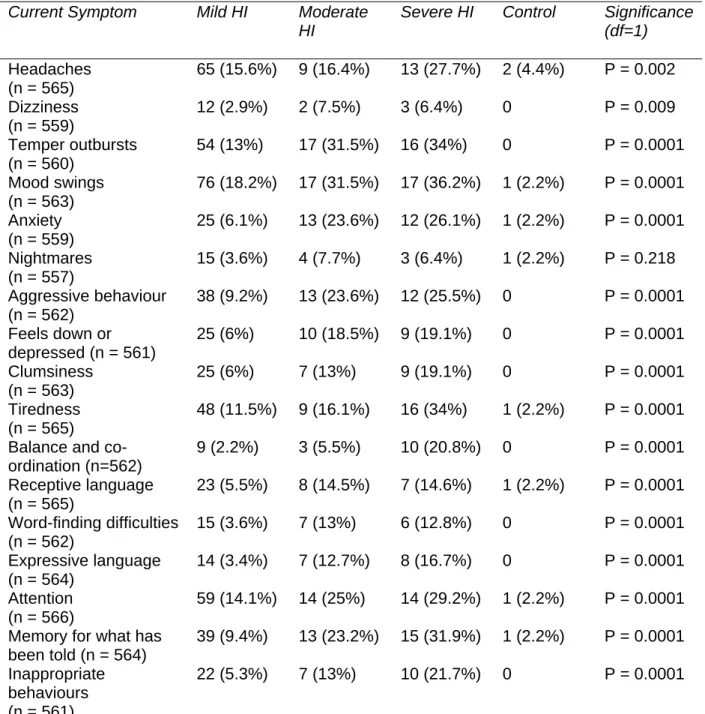
The questionnaire contained a list of symptoms and problems associated with head injury. Parents were asked if, during the past few weeks, their child had experienced any of the symptoms ‘not at all’, ‘occasionally’, or ‘frequently’. Children with mild,
moderate and severe HI and control children were compared using the Chi-squared test for trend (table 4). There was a significant trend across severity groups for all symptoms except nightmares. Children in the moderate and severe groups experienced most symptoms significantly more frequently than those in the mild group. Only two control children experienced any symptoms frequently.
Table 4 about here.
Current reported symptoms were compared for children ≤1 year post-injury and >1 year post-injury at follow-up. There were few significant differences in the frequency of reporting. Recently injured children in the mild group experienced more nightmares (p=0.008), in the moderate group they experienced more nightmares and tiredness (p=0.005). In the severe group, a higher proportion of those ≤1 year post-injury experienced all symptoms more frequently, but significant differences were found for only headaches (recent injuries:54.5%, less recent injuries:18.9% (p=0.05)) and clumsiness (recent injuries:45.5%, less recent injuries:10.8% (p=0.02)).
KOSCHI Outcomes
was associated with worse outcomes (p=0.0001, X2=61.64, df=4). There was also a significant trend across severity groups (p=0.0001, X2=37.66, df=1). When compared over the 6 sub-categories, most children in the mild group scored at 4B or 5A, most of the moderate group scored between 4A and 5A, and most of the severe group scored at 4A or 4B (p=0.0001, X2=87.22, df=10).
Table 5 about here.
Outcomes for children followed-up within one year of injury were also analysed (table 5). There were significant differences between severity groups for the 3 main categories (p=0.0001, X2=26.71, df=4) and 6 sub-categories (p=0.0001, X2=31.57, df=10). A higher proportion of children in the moderate and severe groups had slightly worse outcomes at
≤1 year post-injury than the group as a whole. However, no significant differences in
outcome were observed for children ≤1 year post-injury compared to children >1 year post-injury.
KOSCHI scores were compared for children who, according to parental report, had or had not received follow-up after hospital discharge. There were significant differences between outcome groups (p=0.006, X2=10.37, df=2). In the moderate disability group 64% had no follow-up, and in the good recovery group 76% had no follow-up.
For the mild HI group (n=419), KOSCHI outcomes were analysed according to whether or not the child sustained a skull fracture. Moderate disability was observed for 50.8% (30) of the 59 children with skull fracture and 41.5% (147) of the 354 without (data was missing for 6). The difference was not significant (p=0.18, X2=1.79, df=1).
KOSCHI outcomes were analysed according to Townsend deprivation scores (n=495) using the independent-samples t-test. Children with good recovery (KOSCHI 5A/5B, n=252), were compared with children with moderate/severe disability (KOSCHI 3A-4B, n=243). A significant relationship was observed between social deprivation and
outcomes (p=0.001, t= -3.27, 95%CI: -1.4 to –0.3).
Discussion
The postal survey revealed a large group of children with residual symptoms following HI, even up to six years post-injury. According to their parents, 148 children had a changed personality following the HI. As a result of the HI, almost half the study group had moderate disability according to the KOSCHI. Of these, one third of the severe group and one quarter of the moderate group had overt problems requiring assistance or supervision. Severe disability was rare, and 270 children (51%) had made a good
recovery, yet two-thirds of these had some residual symptomatology. The profile of questionnaire responders was virtually identical to that of non-responders. Furthermore, half the responders had children with few or no residual problems indicating that the sample is probably representative of the whole population of head-injured children admitted to hospital in North Staffordshire.
had physical problems. In this group, the classification of ‘moderate disability’ was usually applied to children with learning, behavioural or neurological sequelae affecting function. Children with severe behavioural problems or learning difficulties requiring supervision or help were placed in category 4A, even though the child was otherwise independent. Children with frequent temper tantrums, mood swings, aggressive
behaviours, communication or concentration problems and mild learning difficulties were placed in 4B. Half the study group had made a good recovery, but only 97 (18.4%) made a full recovery with no discernable sequelae. The most usual reason for placing a child in category 5A (good but not full recovery) was the presence of headaches not interfering with functioning.
The relatively high proportion (43%) of children with mild HI but moderate disability was surprising. Furthermore, evidence of skull fracture was not associated with worse outcomes. The majority of children with mild HI had made a good functional recovery, but had difficulties which interfered with their daily lives, such as temper outbursts, mood swings, memory problems and learning difficulties. The authors of the KOSCHI
emphasise that relatively minor residual deficits are potentially more destructive to children than to adults, and the scale acknowledges this by identifying sequelae which may interfere with their school and social functioning.[19]
The literature is inconclusive regarding the impact of mild HI on outcome, largely
A relationship was observed between social deprivation and outcomes, children from deprived areas were significantly less likely to achieve a good recovery. Other investigators have observed an association between outcome and parental socioeconomic status and deprivation.[13,28,29]
Cognitive and behavioural problems were frequently reported by our study group, even several years post injury, a finding consistent with that of other
investigators.[17,30,31,32] Although data on the frequency of symptoms were reliant upon parental report and thus subjective, it has been argued that parents are more likely to under-report than exaggerate symptoms.[17] In our study, the mild HI group
experienced many symptoms ‘occasionally’ as often as the moderate and severe groups; however, for most symptoms, children in the moderate and severe groups experienced them ‘frequently’, far more often. We observed a significant linear trend across severity groups: increased injury severity was associated with increased symptom reporting.
framework for identification and provision of SENs has accepted limitations and the system is currently under review.[35] The KOSCHI takes account of educational and behavioural difficulties, and may provide a means of identifying those children at risk of school underachievement, so that extra support can be arranged.
Conclusions
References
1 Kraus JF, Rock A, Hemyari P. Brain injuries among infants, children, adolescents, and young adults. American Journal of Diseases in Children 1990;144:684-691.
2 Guyer B, Ellers B. Childhood injuries in the United States. American Journal of Diseases in Children 1990;144:649-652.
3 Snow JH, Hooper SR. Pediatric Traumatic Brain Injury. California: Sage Publications, 1994.
4 Sharples PM. Head injury in children. In: Little and Ward Platt, eds. Injury inthe young. Cambridge: Cambridge University Press, 1998:151-75.
5 House of Commons Select Committee on Health. Third report: Head Injury: Rehabilitation. London: HM Stationery Office, 2001.
6 Ewing-Cobbs L, Miner ME, Fletcher JM et al. Intellectual, motor, and language sequelae following closed head injury in infants and preschoolers. Journal of Pediatric Psychology 1989;14:531-537.
7 Klonoff H, Clark C, Klonoff PS. Long-term outcome of head injuries: a 23 year follow up study of children with head injuries. Journal ofNeurology, Neurosurgery and Psychiatry 1993;56:410-415.
8 Ewing-Cobbs, L, Thompson, NM, Miner, ME et al. Gunshot wounds to the brain in children and adolescents: age and neurobehavioural development. Neurosurgery
1994;35:225-233.
9 Parmelee DX. Neuropsychiatric sequelae of traumatic brain injury in children and adolescents. Psychiatric Medicine 1989;7(1):11-16.
10 Fletcher JM, Ewing-Cobbs L, Miner ME, Levin HS, Eisenberg HM. Behavioural changes after closed head injury in children. Journal of Consulting and Clinical
Psychology 1990;58:93-98.
11 Rivara JB, Fay GC, Jaffe KM, Polissar NL, Shurtleff HA, Martin KM. Predictors of family functioning one year following traumatic brain injury in children. Archives of
Physical Medicine andRehabilitation 1992;73:899-910.
12 Rivara JB, Jaffe KM, Fay GC, et al. Family functioning and injury severity as predictors of child functioning one year following traumatic brain injury. Archives of Physical Medicine and Rehabilitation 1993;74:1947-1955.
13 Rivara JB, Jaffe KM, Polissar NL, Fay GC, Martin KM, Shurtleff HA, Liao S. Family functioning and children's academic performance and behaviour problems in the year following traumatic brain injury. Archives of Physical Medicine and Rehabilitation 1994;75:369-379.
15 Cicerone KD, Smith LC, Ellmo W, Mangel HR, Nelson P, Chase RF, Kalmar K. Neuropsychological rehabilitation of mild traumatic brain injury. Brain Injury
1996;10(4):277-286.
16 Roberts MA, Manshadi FF, Bushnell DL, Hines ME. Neurobehavioural
dysfunction following mild traumatic brain injury in childhood: a case report with positive findings on positron emission tomography (PET). Brain Injury 1995;9(5):427-436.
17 Klonoff H, Clark C, Klonoff PS. Outcome of head injuries from childhood to adulthood: a twenty-three-year follow-up study. In: Broman SH and Michel ME eds. Traumatic Head Injury in Children. New York. Oxford University Press, 1995:219-234. 18 Jennett B, Bond M. Assessment of outcome after severe brain damage. A practical scale. Lancet 1975;1:480-4.
19 Crouchman M, Rossiter L, Colaco T, Forsyth R. A practical outcome scale for paediatric head injury. Arch Dis Child 2001;84:120-4.
20 Teasdale G, Jennett B. Assessment of coma and impaired consciousness: a practical scale. Lancet 1974;2:81-83.
21 British Society of Rehabilitation Medicine. Rehabilitation after Traumatic Brain Injury. A Working Party Report of the British Society of Rehabilitation Medicine. London, 1998.
22 Townsend P, Phillimore P, Beattie A. Inequalities in health in the Northern region. Newcastle upon Tyne: Northern Regional Health Authority and University of Bristol, 1986.
23 Nash J, Appleton R, Rowland B, Saltmarsh J and Sellars J. Immediate medical and nursing needs. In: Appleton R and Baldwin T, eds. Management of Brain-injured Children. Oxford: Oxford University Press, 1998. 43-70.
24 Homer CJ, Kleinman L. American Academy of Pediatrics: Technical report: Minor head injury in children. Pediatrics 1999;104(6):1-7.
25 Tellier A, Della Mavla LC, Cwinn A, Grahovac S, Morrish W, Brennan-Barnes M. Mild head injury: a misnomer. Brain Injury 1999;13(7):463-75.
26 McKinlay A, Dalrymple-Alford JC, Horwood LJ, Fergusson DM. Long term psychosocial outcomes after mild head injury in early childhood. Journal ofNeurology, Neurosurgery and Psychiatry 2002;73:281-288.
27 Kay A, Teasdale G. Head injury in the United Kingdom. World Journal of Surgery 2001;25(9):1210-20.
28 Chadwick O, Rutter M, Brown G, Thompson J, Shaffer D. Intellectual
29 Max JE, Roberts MA, Koele SL, Lindgreen SD, Robin DA, Arndt S, Smith WL, Sato Y. Cognitive outcome in children and adolescents following severe traumatic brain injury: Influence of psychosocial, psychiatric and injury-related variables. Journal of the International Neuropsychological Society 1999;5:58-68.
30 Chadwick O, Rutter M, Brown G, Shaffer D, Traub M. A prospective study of children with head injuries: II. Cognitive sequelae. Psychological Medicine 1981;11 :49-61.
31 Scott-Jupp R, Marlow N, Seddon N, Rosenbloom L. Rehabilitation and outcome after severe head injury. Archives of Disease in Childhood 1992;67:222-226.
32 Donders J, Ballard E. Psychological adjustment characteristics of children before and after moderate to severe traumatic brain injury. J Head Trauma Rehabilitation 1996;11(3):67-73.
33 Jones A, Johnson D. A study of the educational provision for head-injured children. British Journal of Special Education 1994;21(3):113-117.
Table 1: Definitions of Injury Severity
Severity of Traumatic Brain Injury
Definition
Mild An injury causing unconsciousness for less than 15 minutes and a GCS after initial resuscitation of 13-15
Moderate An injury causing unconsciousness for more than 15 minutes and a GCS after initial resuscitation of 9-12
Table 2 KOSCHI category definitions
Category Definition
1 Death
2 Vegetative Breathes spontaneously. No evidence of verbal or non-verbal communication or response to commands.
3 Severe disability A Conscious, totally dependent. May be able to communicate. Requires specialised
educational/rehabilitation setting.
Severe disability B Limited self-care abilities and predominantly dependent. May have meaningful
communication. Requires specialised educational/rehabilitation setting.
4 Moderate disability A Mostly independent for daily living, but needs a degree of supervision/help for physical or behavioural problems. Has overt problems. May be in specialised rehabilitation/educational setting or in mainstream school requiring special needs assistance. His behavioural problems may have caused him to be disciplined or excluded from school.
Moderate disability B Age-appropriately independent for daily living, but with neurological sequelae frequently affecting his daily life, including behavioural and learning difficulties. He may also have frequent headaches. Likely to be in mainstream school with or without special needs assistance.
5 Good recovery A Appears to have made a full functional recovery, but has residual pathology attributable to head injury. He may suffer headaches which do not affect his school or social life, and may occasionally have some of the problems listed on the head injury checklist.
Table 3 Characteristics of the study group
Variable Mild HI
n = 419
Moderate HI
n = 58
Severe HI n= 49
Control n = 45
Gender: number male (%) 292 (69.7%) 47 (81%) 29 (59.2%) 27 (60%) Age at injury (years)
Mean Median SD Range 9.6 9.0 3.08 5-15 10.12 11.0 3.0 5-15 11.24 11.0 3.16 5-15 NA
Age at time of follow-up (years) Mean Median SD Range 12.31 12.0 3.52 5-21 12.81 13.0 3.46 7-21 13.76 13.0 3.52 7-21 11.91 12.0 2.89 5-17 Years between injury and
follow-up Mean Median SD Range 2.23 2.0 1.64 0-5 2.29 2.0 1.77 0-5 1.86 2.0 1.51 0-5 NA
Ethnicity: number white (%) 397 (94.7%) 58 (100%) 47 (95.9%) 44 (97.8%)
Mechanism of injury N/A
Fall (%) 193 (46.1%) 16 (27.6%) 4 (8.2%)
RTA pedestrian (%) 48 (11.5%) 15 (25.9%) 29 (59.2%) RTA in vehicle (%) 8 (1.9%) 4 (6.9%) 8 (16.3%) RTA cyclist (%) 22 (5.3%) 4 (6.9%) 6 (12.2%) Fall from bicycle (%) 44 (10.5%) 3 (5.2%) 0
Assault (%) 20 (4.8%) 4 (6.9%) 0
Hit by object 60 (14.3%) 3 (5.2%) 1 (2.%)
Sport 17 (4.1%) 5 (8.6%) 0
Other 7 (1.7%) 4 (6.9%) 1 (2%)
Table 4 Current symptoms frequently experienced by the child, as reported by parents
(Not all parents answered every question, the total number of respondents is shown for each question.)
Current Symptom Mild HI Moderate
HI
Severe HI Control Significance
(df=1)
Headaches (n = 565)
65 (15.6%) 9 (16.4%) 13 (27.7%) 2 (4.4%) P = 0.002
Dizziness (n = 559)
12 (2.9%) 2 (7.5%) 3 (6.4%) 0 P = 0.009
Temper outbursts (n = 560)
54 (13%) 17 (31.5%) 16 (34%) 0 P = 0.0001
Mood swings (n = 563)
76 (18.2%) 17 (31.5%) 17 (36.2%) 1 (2.2%) P = 0.0001
Anxiety (n = 559)
25 (6.1%) 13 (23.6%) 12 (26.1%) 1 (2.2%) P = 0.0001
Nightmares (n = 557)
15 (3.6%) 4 (7.7%) 3 (6.4%) 1 (2.2%) P = 0.218
Aggressive behaviour (n = 562)
38 (9.2%) 13 (23.6%) 12 (25.5%) 0 P = 0.0001
Feels down or depressed (n = 561)
25 (6%) 10 (18.5%) 9 (19.1%) 0 P = 0.0001
Clumsiness (n = 563)
25 (6%) 7 (13%) 9 (19.1%) 0 P = 0.0001
Tiredness (n = 565)
48 (11.5%) 9 (16.1%) 16 (34%) 1 (2.2%) P = 0.0001
Balance and co-ordination (n=562)
9 (2.2%) 3 (5.5%) 10 (20.8%) 0 P = 0.0001
Receptive language (n = 565)
23 (5.5%) 8 (14.5%) 7 (14.6%) 1 (2.2%) P = 0.0001
Word-finding difficulties (n = 562)
15 (3.6%) 7 (13%) 6 (12.8%) 0 P = 0.0001
Expressive language (n = 564)
14 (3.4%) 7 (12.7%) 8 (16.7%) 0 P = 0.0001
Attention (n = 566)
59 (14.1%) 14 (25%) 14 (29.2%) 1 (2.2%) P = 0.0001
Memory for what has been told (n = 564)
39 (9.4%) 13 (23.2%) 15 (31.9%) 1 (2.2%) P = 0.0001
Inappropriate behaviours (n = 561)
Table 5 KOSCHI scores by injury severity and time since injury
KOSCHI Score All Mild HI (n = 419)
All
Moderate HI (n = 58)
All Severe HI
(n = 49)
Mild HI
≤ 1 year post HI (n = 79)
Moderate HI
≤ 1 year post HI (n = 15)
Severe HI
≤ 1 year post HI (n = 12)
3 Severe Disability
0 0 4 (8.2%) 0 0 2 (16.7%)
3A 0 0 1 (2.0%) 0 0 1 (8.3%)
3B 0 0 3 (6.1%) 0 0 1 (8.3%)
4 Moderate Disability
181 (43.2%) 37 (63.8%) 34 (69.4%) 33 (41.8%) 12 (80%) 8 (66.7%)
4A 34 (8.1%) 15 (25.9%) 17 (34.7%) 10 (12.7%) 5 (33.3%) 5 (41.7%) 4B 147 (35.1%) 22 (37.9%) 17 (34.7%) 23 (29.1%) 7 (46.7%) 3 (25%)
5 Good Recovery
238 (56.8%) 21 (36.2%) 11 (22.4%) 46 (58.2%) 3 (20%) 2 (16.7%)
5A 149 (35.6%) 15 (25.9%) 9 (18.4%) 29 (36.7%) 3 (20%) 2 (16.7%) 5B 89 (21.2%) 6 (10.3%) 2 (4.1%) 17 (21.5%) 0 0