Marloes Taken
1
stsupervisor: F. Sieverink MSc.
2
ndsupervisor: Prof. dr. J.E.W.C. van Gemert-Pijnen
Enschede, 1
thDecember 2017
Faculty of Behavioural Management and Social Sciences
, University of Twente
of personal health records in chronic care
Combining quantitative and qualitative data
1
ABSTRACT
Background:
Nowadays, eHealth is expected to play an important role in supporting patients with chronic conditions in their self-management. However, in recent evaluations only the effects of eHealth technologies are measured by performing RCTs. Consequently, it remains unknown why these effects occur and what are the reasons behind the use an non-use of eHealth technologies. Therefore, there is a need for eHealth evaluations that goes beyond measuring the effects. The eCCM which is a framework for developing effective eHealth solution for chronic care is expected to support these evaluations.
Objective:
The aims of this study is to evaluate how PHRs for the chronic conditions: T2DM, COPD and CHF are used to support self-management for patients and the daily care routines for healthcare professionals and to come up with recommendations to make the PHRs for chronic conditions more persuasive.
Methods:
A mixed methods design was used to combine quantitative and qualitative research methods. The quantitative research data (log data) were used to gain more understanding of the usage of PHRs and to identify predictors for long-term usage. By using qualitative data from different sources (e.g. usability tests, interviews etc.) it was possible to identify the experiences of the potential end users and their healthcare professionals about the usage and implementation of the e-Vita platform. Subsequently, the qualitative data enabled the researchers to investigate to what extent the PHRs fits the components of the eCCM.
Results:
A fast declining trend is shown for the amount of sessions that is performed on the PHRs. However, patients with more sessions more intensively used the different feature which especially applies for the PHRs were intended usage is pursued. Besides, it was found that the feedback loop presented in the eCCM, required for interactions between the healthcare professionals and patients to provide tailored self-management solutions was completely lacking in the studied PHRs. Additionally, is was found that those who visited all main features of a PHR have a higher probably to become long-term users.
Conclusion:
2
Content
ABSTRACT ... 1
1. Introduction ... 3
1.1 Chronic conditions in the Netherlands ... 3
1.2 eHealth ... 3
1.3 Self-management ... 4
1.4 The eHealth enhanced Chronic Care Model (eCCM) ... 6
1.5 Barriers for using eHealth technologies ... 7
1.6 Evaluating eHealth technologies ... 8
1.7 Persuasive eHealth technologies... 10
1.8 Casus: personal health record e-Vita & research questions ... 11
2. Methods ... 12
2.1 Web-based PHR e-Vita ... 12
2.2 Design: mixed methods approach ... 13
3. Results ... 19
3.1 Log data analysis of the web-based PHR e-Vita ... 19
3.2 Qualitative data analysis of the web-based PHR e-Vita ... 25
4. Discussion ... 28
4.1 Comparing the different e-Vita platforms ... 28
4.2 The usage and experiences of PHRs in chronic care ... 28
4.3 Using the mixed methods approach and eCCM model as evaluation approach ... 30
4.4 Strengths & limitations ... 30
4.5 Recommendations for improving PHRs in the future ... 32
4.6 Future research of PHRs ... 33
5. Conclusion ... 34
References ... 35
Appendix A: Screenshots of the web-based PHR ‘e-Vita diabetes 1.2’ and ‘e-Vita CHF’ ... 39
3
1. Introduction
1.1 Chronic conditions in the Netherlands
Due to declining birth rates and longer life expectancies, the proportion of older people in our society is growing (1, 2). This causes an increase in the number of people with age-related illnesses, including chronic conditions (2, 3). Chronic conditions have a big impact on the individuals, since chronic conditions are lifelong and cannot be cured. Often, chronic conditions have a course that varies over time. Furthermore, there are some common challenges concerning chronic conditions, which include recognizing symptoms and taking appropriate actions, using medications effectively, managing complex health behaviours, developing strategies to deal with the psychological consequences and interacting with the healthcare system (4).
At the moment, it is getting more common that older people are living longer despite they are having a disease. Consequently, more diseases are becoming chronically. This is a result of the improved healthcare services, increased access to health education, and economic growth (5, 6). This increase in life expectancy brings its own challenges which places a burden on the healthcare system (5). For example, more healthcare professionals will be needed to assist all patient with chronic conditions. At the same time, there is an imminent shortage of professional healthcare workers to support a larger group of older patients, who have longer life expectancies than in the past (6).This will result in a decreasing number of professionals available for face-to-face contact to assist chronically ill patients in managing their disease. Furthermore, the changing and growing request for care for patients with chronic conditions is causing increasing healthcare costs in the Netherlands (6).
The chronic conditions: Type 2 Diabetes Mellitus (T2DM), Chronic Heart Failure (CHF) and Chronic Obstructive Pulmonary Disease (COPD) are highly prevalent in the Netherlands (7). In 2015, around 1 million patients are diagnosed with T2DM, 227.30 with CHF and 607.300 with COPD (8-10). Moreover, it is expected that through aging these prevalence’s will rise (11). For T2DM it is expected that in 2025, 1.4 million patients will be diagnosed with this chronic condition (12). The causes and prognoses of these chronic conditions are mainly influenced by lifestyle factors. The most important risk factors for developing T2DM are obesity and physical inactivity (13). For CHF examples of risk factors are: bad eating behaviour, consuming too much alcohol, smoking and physical inactivity (14). At last, the leading cause of COPD is smoking (15, 16). It can be concluded that for all these chronic conditions a healthy lifestyle is important in order to reliever complains and to prevent a bad prognosis of the disease. However, the rising number of patients with chronic conditions and the increasing burden on the healthcare system will therefore be a challenge in the near future and requires innovative solutions to support the chronically ill and their healthcare professionals (6). Currently, one of these innovative solutions is the introduction of eHealth.
1.2 eHealth
4 domotics, which are electronic tools which can be used at home such as sensors for fall prevention (18). Furthermore, the first “e” in eHealth does not only stand for “electronic”, but also implies a number of other “e’s”, which together describes the goals of the eHealth solutions (19). One of the goals is efficiency, which aims to decrease the costs in healthcare. This can for example be enhanced by more patient involvement, which results in fewer duplicative and unnecessary therapeutic operations. Other goals of eHealth technologies are: enhancing the quality of healthcare, creating evidence-based eHealth interventions, stimulating empowerment among patients and encouraging new relationships between patients and healthcare professionals (19). However, the main goal of introducing eHealth is to encourage patient-centred care: “providing care that is respectful of and
responsive to individual patients preferences, needs and values and ensuring that patients value guide
all clinical decisions” (20). Subsequently, eHealth solutions improves the quality of care, which is an
advantage for both the patients and the healthcare professionals (21). For example, because of eHealth, it will be possible to easily share data between healthcare professionals. This ensures that all healthcare professionals will be working with the most updated health data.
Factors that drive the eHealth market include: the pressure to decrease healthcare costs and the rising number of people with age-related diseases including chronic conditions (6, 19). Whereas, there are also some factors which inhibit the implementation of eHealth solutions such as: financial incentives for implementing the eHealth solution, difficulties with adopting the eHealth solution in daily practice and complexity of the systems (22).
1.3 Self-management
Moreover, eHealth is expected to play an important role in supporting patients with chronic conditions in their self-management. In the literature self-management is defined as the individual ability to participate in the management of their own health status (6, 23). For patients with chronic conditions, self-management is an essential component to enhance a positive prognosis of the disease and achieve a sufficient quality of life (4, 24). The basic principle underlying self-management is that behavioural change cannot succeed without the patient taking responsibilities. Patients with chronic conditions have to make many decision in order to manage their disease (23). For example, patients make decisions about medicine use, the level of exercise and other lifestyle behaviours. From this perspective, in the Netherlands there has recently been a strong emphasize on self-management among the healthcare for patients with chronic conditions (6). By developing self-management skills, patients become more aware of and gain more insight in their own health values and lifestyle behaviours. For example, by keeping track of their blood pressure or nutrition intake.
5 In addition, the study of Huygens, et al. identified differences between patients with diabetes, COPD and cardiovascular conditions in their willingness to use self-management interventions (23). Findings from this study revealed that patients with diabetes reported the most benefits and willingness to use self-management interventions, followed by patients with COPD. This may be caused by the fact that many people with diabetes are already familiar with self-monitoring applications for measuring their blood glucose levels. Besides, most diabetes patients are aware that their eating behaviour, weight and medication intake directly influenced their health. For patients with a cardiovascular condition their disease had lesser impact on their life. Therefore, they have fewer needs for self-management support (23).
The systematic review of Hunt et al., which is conducted to evaluate the eHealth solutions which are used to facilitate diabetes self-management, found that the eHealth solutions nowadays used by diabetic patients had positive impacts on daily diabetes self-management activities (25). These activities included: blood glucose monitoring, exercising, healthy eating, taking medication, monitoring for complications, and problem-solving. The increased use of diabetes-related eHealth solutions indicates that people living with diabetes are interested in using these solutions to improve their self-management and diabetes outcomes (25). However, eHealth solutions for diabetes patients to provide education and real-time feedback needs to be developed (25). For patients with COPD, researchers show that eHealth self-management solutions may contribute to a better quality of life and to a reduction in health care consumption, as well as health care costs (26). For CHF patients, systematic reviews shows success in improving symptom monitoring by eHealth solutions (27). Nevertheless, for the eHealth solutions directed to CHF and COPD patients there is a gap in the research. There are no evidence based results about which component or activities of these eHealth solutions are drivers for positive health outcomes (27).
1.3.1 Personal health records (PHRs)
At this moment, Personal Health Records (PHRs) are one of the innovative eHealth solutions which play an increasing role in the support of self-management for chronic care (28). Tang et al. defined a PHR as: “an electronic application through which individuals can access, manage and share their health
information in a private, secure and confidential environment” (29). PHRs have the potential to support patient centred care by giving patients access to their medical records and other relevant information. Thus assisting patients in managing their own health (30). The PHRs are accessible for the patients, their healthcare professionals and also for authorized third parties. PHRs differ from electronic health records (EHRs) in that EHRs, which includes all medical data regarding one person, are only accessible for the healthcare professionals (29). However, the PHR can be a part of the EHR that provides access to relevant medical information for the patient.
The following functions are commonly included in PHRs to support self-management (30, 31):
• Monitoring: insight in and possibility to record personal health values and lifestyle behaviour.
• Goal-setting/coaching: setting personalized health-related goals, while the PHR or healthcare professionals gives feedback.
6
• Patient-provider communication: giving patients and healthcare professionals the opportunity to easily contact each other to discuss medical and lifestyle issues.
• Peer support : sharing experiences with others who have the same chronic condition.
The deployment of the PHR can have many potential benefits for both patients and healthcare professionals. First, the PHRs support patient empowerment, which includes increased feeling of responsibility for health and selfcare, better treatment compliance, improved participation in decision making and increasing knowledge about their disease (32). The second benefit is the gain in health and quality of life. PHRs offers patients access to a large amount of health information, which they can use to improve their health and it will learn them how to deal with their chronic condition (29). Furthermore, the quality of care will increase, for example by improved relationships between patients and healthcare professionals, due to increased possibilities for online communication and more flexible access to services (e.g. laboratory results) (32). Finally, a benefit of the PHRs is the decrease in burden of care due to fewer unnecessary consultations, reduced waiting lists and lower healthcare costs (32). However, in the article of Price et al., researchers found that not all health conditions are sensitive to benefit from electronic PHRs. Conditions with evidence based benefits from PHRs tended to be chronic conditions such as T2DM, CHF or COPD (33). This can be explained by the fact that these chronic conditions cannot be cured, but they can be self-managed in order to maintain an acceptable quality of life. For curable disorders (e.g. anemia) eHealth solutions are of lesser value, since such disorders are not lifelong and are to a lesser extent influenced by lifestyle factors.
1.4 The eHealth enhanced Chronic Care Model (eCCM)
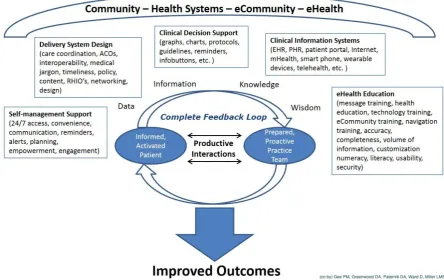
According to the chronic care model (CCM), self-management is just one of the components which is needed to achieve effective chronic healthcare. The CCM, developed by the MacColl Institute for Healthcare Innovation at Group Health Cooperative, is a framework for the development and improvement of care for patients with chronic conditions (34). The model included six interdependent components which are: community resources, health system support, self-management support, delivery system design, clinical decision support, and clinical information systems. For an effective chronic healthcare it is required to include all these components.
‘Self-management support’ can be provided by giving patients the information, confidence and skills for managing their own chronic condition (34). The component ‘delivery system design’ is important to assure effective and efficient clinical care. Besides, ‘decision support’ promotes clinical care with the most current and relevant evidence based guidelines. Finally, the model emphasized the role of ‘clinicalinformation systems’ which is needed to provide healthcare professionals and the patients access to data, information, and knowledge needed to improve health. Besides, a key factor of the CCM is the productive interactions between the informed, activated patients and the prepared, proactive healthcare professionals with the aim to improve health outcomes (34).
7 the eCCM. In addition, a complete feedback loop (CFL) is required in eHealth technologies (35). In the eCCM this feedback loop contain the terms: ‘data’, ‘information’, ‘knowledge’, and ‘wisdom’. The first step in the feedback loop is gathering information about the health status of the patients. Secondly, interpretation of the information takes place using previously established knowledge and or wisdom about how to support self-management to patient with chronic conditions.
Figure 1. Ehealth enhanced Chronic Care Model (eCCM). Source: Gee et al. (35).
1.5 Barriers for using eHealth technologies
Although, the potential benefits of PHRs have been shown in the current literature, many solutions still fail in their adoption and face high non-adherence rates (36-38). Many, people stop using the eHealth technology or do not use the technology as intended (39).
For eHealth technologies to be used, it should be financially feasible. Often, there are no obvious financial benefits for the healthcare systems and it is not clear enough who is responsible, the community or the patients themselves, for the finance required for developing and implementing the eHealth technologies. This is why a lack of finical incentives often hinders the implementation (22, 36). Furthermore, there is often a lack of clarity about legal issues, for example: who is ultimately responsible if the technology provides a wrong explanation of a health value or what if the security of personal health data is insufficient? (40). In addition, many eHealth technologies are developed according to different standards. This makes it difficult or even impossible to communicate information from one system to another (40).
8 study of Harvey et al., who reported that motivation is an essential component in order to engage with an eHealth intervention (36).
Besides, the literature study from Kelders et al. shows that an eHealth technology will be rejected if patients do not recognize the added value (relative advantage) of the technology or if using the technology caused difficulties (complexity) (37). In addition, the feeling that regular healthcare services are sufficient and the association of eHealth with a high degree of dependency or ill health are found to be reasons for not using eHealth technologies (23). Another study concluded that for eHealth technologies to be beneficial, the observed benefits such as reduced medication intake, should exceed the negative consequences. These negative consequences included for example: frequently taking action to deal with the disease and reminding patients about having a chronic condition. Furthermore, it is found that when patients already have an (social) environment, which offers them sufficient knowledge and support, they will less likely use an eHealth technology for self-management (23).
1.6 Evaluating eHealth technologies
Despite the identified barriers for using eHealth technologies, the number of eHealth technologies in healthcare is growing and there is still insufficient understanding of how and why such interventions do or do not work (41). There is still a large gap between the expected and demonstrated benefits of eHealth technologies (18).
Up to now, evaluation research in the field of eHealth is dominated by the traditional concept of medical research where randomized controlled trials (RCTs) are the gold standard (21). These trials are useful for randomizing those who will receive an intervention and those who will receive usual care and subsequently compare the outcomes (21). When eHealth technologies are evaluated with RCTS, usually it is investigated whether the technology has an effect on health outcomes. The main parameters for this are quality of life, clinical values and changes in behaviour/lifestyle. Up to now, most evaluations of eHealth technologies mainly focused on the effectiveness of the technology, without explaining why a particular outcome occurred. Knowing why such outcomes occurred, gives opportunities to promote or change the features of an eHealth technology that work or do not work. Although this kind of trials have proven to be very useful in determining the outcomes, researchers agree that RCTs are not optimally suitable for the evaluation of eHealth technologies.
9 At last, by only looking at the effects with the use of RCTs, it will remain unknown how or what parts of the technology contributed to these effects. It is therefore necessary, that evaluations of eHealth solutions should not only focus on clinical outcomes but also should take into account the context in which the technology is used. Therefore, an evaluation methodology is needed that goes beyond a baseline and follow-up measurement of health outcomes. Therefore, more research should be directed towards the factors that provide insight into the usage of and the reasons behind use and non-use of eHealth technologies (44, 45).
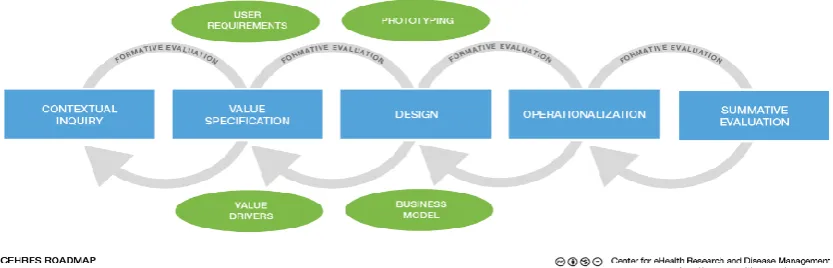
Recently, van Gemert-Pijnen et al. designed a framework for the development and evaluation of eHealth technologies (21). This framework is the Center for eHealth research (CeHRes) roadmap, shown in figure 2. The main goal of the CeHRes roadmap is providing a framework to explore and test how an eHealth technology can be optimally suited to the end users and implemented in practice (21). The CeHRes roadmap consists of five different phases: the contextual inquiry, value specification, design, operationalization and summative evaluation. In every phase specific components, needed for the development of an eHealth technology, are evaluated in order to collect input for improvements. In the contextual inquiry phase the key-stakeholders and the context of current situation is mapped. During the value specification phase the wishes of the different stakeholder have to be identified and requirements to design the eHealth technologies have to be created. In the design phase prototypes of the technology are developed and afterwards the usability is evaluated. In the operationalization phase, the main goals is to make sure that eHealth technologies are implemented and used in practice. At last, in the summative evaluation phase evaluations are conducted to measure the effects of the implemented technology on health and healthcare. Except measuring impact (behavioural, clinical and organizational outcomes) the summative evaluation also focuses on uptake, which is the examination of usage behaviour. In other words, there is an evaluation of how people have been using the technology in practice and how the use is related to the found effects. This is an important phase to promote in upcoming evaluations, since nowadays most evaluations of PHRs only investigated clinical outcome values. Besides, the formative evaluations (Figure 2.) between phases aimed to check whether the goals of the phases have been reached.
[image:10.595.80.497.540.674.2]The CeHRes roadmap is based on a holistic approach, which takes into account the users, technology and the context (18). Furthermore, the framework includes iterative cycles for eHealth development and a continuous evaluation process. The latter is required from the first development phase on; because eHealth technologies evolve constantly and not everything is known from the start. The
10 CeHRes roadmap has consistent principles with the ‘agile science approach’, introduced by Hekler et al., which also intended that the development and evaluations of an intervention have to occur in parallel and iterative cycles until the solution has been optimized and is ready for practice (43). This continues analysis includes that many evaluations should take place during the whole process of the development and implementation. The iterative process builds on identifying useful elements of the technology that can be used in practice. However, via the ‘agile science approach’ also ineffective elements can be identified, which can be improved or can be eliminated from the intervention (46). Additionally, findings about which factors work or did not work in an intervention, can also be used in the development of new technologies.
1.7 Persuasive eHealth technologies
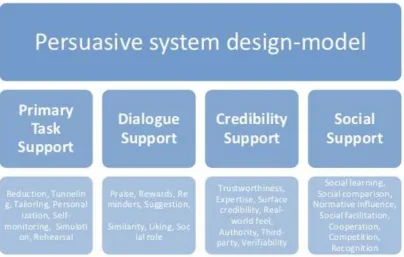
[image:11.595.81.486.441.698.2]Technologies, especially interactive technologies, can persuade people to do the right thing at the right moment (21). Therefore, to improve the evaluated components of an eHealth intervention, designers focus on developing persuasive technologies. A persuasive technology is broadly defined as “a technology which is designed to change attitudes or behaviors of the users through persuasion and social influence, but not under compulsion” (47). These persuasive technologies are rather new in the health care domain (21). Persuasive eHealth technologies can for example be designed to motivate patients to engage in self-management. The persuasive system design (PSD)-model (figure 3), developed by Harri Oinas-Kukkonnen and colleagues, provides ideas and tools to design persuasive eHealth technologies by using persuasive system design elements (48). These persuasive elements ensures that the technology supports users to change their behavior. These elements (figure 3) can be divided in four different categories: primary task support, dialogue support, credibility support and social support. (48).
11
1.8 Casus: personal health record e-Vita & research questions
One of the promising eHealth interventions which is recently developed to support self-management for chronically ill patients is the web-based PHR e-Vita. The e-Vita platform aims to improve the quality of chronic disease management, by helping patients to manage and control their chronic condition. The web-based PHR e-Vita is deployed for the chronic conditions: T2DM, CHF and COPD. Up to now, the evaluations of the PHRs so far only assesses the effectiveness through RCTs (6, 49, 50). The lack of insight in how or which parts of the PHRs influenced the usage of the e-Vita platform, refers to the “black box phenomenon” (21, 50). The e-Vita platform can be seen as a black box and it is unknown what happens inside. Therefore, there is a need for an evaluation approach that goes beyond the measurements of the effects by means of performing RCTs. For current research the e-Vita platform is used as casus to investigate the usage of PHRs.
To open the black box of the PHRs, it is of added value to identify: how and to what extent features of PHRs are used and what are the reasons behind the use and non-use. It is important to take into account that complex eHealth technologies, such as the PHR, do not consist of just one single process. Therefore, a holistic approach is required which takes into account the context, technology and the users. Besides, a couple of previous research studies identified usage patterns of web-based interventions which can predict long-term usage (38, 44, 45). Subsequently, it seems useful to explore if for the explored PHRs also long-term usage could be predicted. If usage behavior of the PHR could be predicted, it becomes possible to screen for more efficient patterns. Consequently, the PHRs can be adjusted to these findings or intervene when it is predicted that participants are at risk to drop-out. The following research questions are developed to gain insight in the usage and reasons behind the use of PHRs, to search for possible predictors for long-term usage and to come up with recommendations to improve the PHRs to support self-management.
How are PHRs for the chronic conditions: T2DM, COPD and CHF used to support self-management for patients and the daily care routines for healthcare professionals?
Sub-questions:
➢ To what extent do the experiences of potential end users and their healthcare professionals, with regard to the implementation of the PHR e-Vita, match the components of the eCCM?
➢ To what extent can long-term usage of PHRs be predicted?
12
2. Methods
2.1 Web-based PHR e-Vita
e-Vita, was a web-based personal health record which was developed for supporting self-management among patients with chronic conditions in primary and secondary care. The PHR e-Vita was an initiative of the Dutch Foundation Care within reach (in Dutch: Zorg Binnen Bereik), a partnership between Philips and Achmea. The aim of the PHRs was to support patient-centeredness in order to help the patients to manage and control their chronic condition and consequently improve the quality of chronic disease management.
The PHR e-Vita was developed for the chronic conditions T2DM, CHF and COPD. E-vita for T2DM was developed for usage in primary care, which is provided by the general practitioner (GP). For T2DM there were already 2 versions of e-Vita conducted. The ‘e-Vita diabetes 2.0’ was a revised version of ‘e-Vita diabetes 1.2’. ‘E-vita for CHF’ was deployed for usage in secondary care, which means in hospitals or outpatient clinics. The e-Vita for CHF was connected to the ‘Motiva’ telehealth system, which registered real-time measurements from the patients and sent this to the heart failure (HF) nurses. Patients were expected to measure their own weight, blood pressure and heart rate with supplied equipment every day. Also, via ‘Motiva’ these data was presented in e-Vita. Lastly, the e-Vita platform for COPD was intended for usage in domestic and primary care. In ‘e-Vita COPD’ patients were asked to fill in some questionnaires on fixed time points. According to van Gemert-Pijnen et al, a web-based intervention can be seen as the whole of the content, system and services it provides(18). Therefore, the web-based PHR e-Vita is described with the help of these categories.
2.1.1 Content
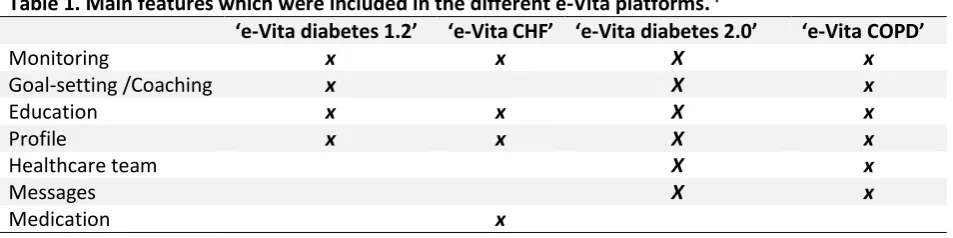
[image:13.595.72.549.541.660.2]Table 1. shows the main features included in the different e-Vita platforms. Screenshots of these features were attached in appendix A and B. In appendix A, the features included in ‘e-Vita diabetes 1.2’ and ‘e-Vita CHF’ are shown. Appendix B, included features of ‘e-Vita diabetes 2.0’ and ‘e-Vita COPD’.The main feature profile was only logged for ‘e-Vita diabetes 1.2’ and ‘e-Vita CHF’. Therefore, log data analysis not include the usage of the profile on the other two e-Vita platforms.
Table 1. Main features which were included in the different e-Vita platforms. I
‘e-Vita diabetes 1.2’ ‘e-Vita CHF’ ‘e-Vita diabetes 2.0’ ‘e-Vita COPD’
Monitoring x x X x
Goal-setting /Coaching x X x
Education x x X x
Profile x x X x
Healthcare team X x
Messages X x
Medication x
A short description of the main features on the different e-Vita platforms:
• Monitoring: insight in data of annual checks and monitoring own health values (e.g. weight).
• Goal-settings/coaching: patients can set personal health-related goals to actively engage in improving their health.
• Education: included education related to their chronic condition (e.g. how to change lifestyle).
13
• Healthcare team: contact details of healthcare professionals and possibility to send messages.
• Messages: inbox for receiving messages.
• Medication: medication usage.
2.1.2 System
The participants in the RCTs for measuring the effects of the PHRs e-Vita had, via an user name and password, free access to the e-Vita platform. Ones participants had logged in, the home-page screen appeared. From there all main features of the e-Vita platform are accessible. Communication on the PHR e-Vita was in both directions, from the patients to the healthcare professionals, but also from the healthcare professionals to the patients. The indirect communication takes place via e-mail messages. Besides, for ‘e-Vita diabetes 1.2’ and ‘e-Vita CHF’ a helpdesk service was available, which occasionally sent reminders via the email to remind the participants of using the e-Vita platform.
2.1.3 Service
Clicking on one of the main features or performing a related action were all described as features of the PHRs. On the PHRs a variety of actions can be performed. The actions related to the monitoring feature consisted of reviewing data of annual checks, or get insight in own measured health values (e.g. blood pressure). For the goal-setting/coaching feature the actions consisted of adding a wish or goal and evaluating the actions with the help of a coach. An action on the medication feature included adding which medication patients used and entering starting and stopping moment of usage. For the education feature these actions consisted of assessing extra information related to someone’s chronic conditions or lifestyle behaviour (e.g. dealing with stress). Moreover, for ‘e-Vita diabetes 2.0’ and ‘e -Via COPD’ there was also an feature included to communicate with the relevant healthcare professionals and on all e-Vita platforms a profile feature was available were personal data can be adjusted.
Furthermore, there was also an action called extra information. Via the I icon button (shown in appendix A) the users could gain explanations about the different functions in e-Vita. In addition, the participants in the RCTs for ‘e-Vita diabetes 2.0’ and ‘e-Vita COPD’ received a training session. These trainings sessions consisted of an interdisciplinary groups training that informed the participants about the possibilities to increase their self-management by the web-based PHR e-Vita.
2.2 Design: mixed methods approach
The 4 different e-Vita platforms (‘e-Vita diabetes 1.2’, ‘e-Vita CHF’, ‘e-Vita diabetes 2.0’ and ‘e-Vita COPD’) were studied in the past three years and a lot of data among patients and healthcare professionals, regarding the usage of and the experiences with the PHRs was gathered. These data included for instance: usage data (log data), data of usability testing and data of interviews. According to the CeHRes roadmap, in the current study a backward summative evaluation was performed to understand the usage of the in practice investigated PHR e-Vita. As well as a forward summative evaluation to identify possibilities to make the PHR e-Vita more persuasive according to both the patients and healthcare professionals.
14 methods approach (38, 45). The use of mixed methods as a research design in the health science domain enable researchers to better understand complex systems and provides a framework for carrying out both quantitative and qualitative approaches within a single research study (52). The mixed methods approach included more than simply collecting both quantitative and qualitative data, the data will be mixed in the evaluation phase of the research process (53). The mixed methods approach was a cyclic evaluation instead of a before and after design such as in RCTs (18).
The favored design of the mixed methods approach will depend on the research question, but in most cases researchers choose between either collecting quantitative and qualitative data simultaneously, termed a parallel design, or collecting data in phases – a sequential design (54). For the current study a parallel mixed methods design will be used. In this type of design the qualitative and quantitative data are collected in parallel, analyzed separately, and then synthesized. This design gives equal priority to the quantitative and qualitative data. The parallel design seemed the most suitable, since both the quantitative and qualitative data was already collected.
The underlying logic of mixing was that researchers were in this way able to gain increased insight in the usage of an eHealth technology and to compensate for the weaknesses of one data collection method via the strengths of the other. As an example, there were some difficulties in using log data for understanding underlying mechanisms that were responsible for the observed usage of eHealth technologies (55). For example: usage data from a digital health intervention might include whether a participant had clicked a webpage, but tell researchers little about why a participant decided to click on a page or whether the content of the page was actually read. With the help of qualitative data a more clear picture can be create about why people act in certain ways and what their feelings were by performing certain actions. Therefore, the mixed methods approach seemed of added value in current study to evaluate the PHRs. The mixed methods approach of current study used both quantitative (e.g. log data) and qualitative (e.g. usability testing or interviews) research in order to gain insight in how the PHRs were used and to identify the reasons behind use and non-use of PHRs.
2.2.1 Quantitative data : log data
2.2.1.1 Goal of log data analysisLog data was the quantitative data source in the mixed method approach. Log data is defined as a history of anonymous records of real-time actions performed by each user on a technology (21). Log data provides continuous and objective insight into the actual usage of the technology. Moreover, log data enables researchers to explore the navigation process including which system features were used and to gain insight into the usage, which contributed to the outcomes identified by the RCTs (56, 57). Log data of the PHR e-Vita was already collected, however still had to be analyzed.
2.2.1.2 Participants of log data analysis
15 2.2.1.3 Log data collection and preparation
Log data for the ‘e-Vita diabetes 1.2’ was collected from July 2013 till January 2016, for ‘e-Vita CHF’ from 2013 till September 2015, for ‘e-Vita diabetes 2.0’ from September 2014 till July 2016, and lastly log data of ‘e-Vita for COPD’ was collected from June 2014 till April 2016. In all log data every record (row) contains an (anonymous) user identification number, the time and day of using a feature, an identification of the type of features used on e-Vita (clicking a main feature or performing an action related to one of the main features) and in some cases additional information (e.g. what information was viewed by the user). From the log data, the following variables were calculated:
• Number of sessions per user
• Percentage of users who used a feature per session
• Average percentage of participants who used a feature across the sessions
• Categorizing long and short-term users
• Visiting all main features
A session was defined as a period of activity ended by a period of at least 30 minutes of inactivity. Therefore, when a user logged in to e-Vita within half an hour after the last login, this was considered to be the same session. Percentages of users who used a feature were calculated for session 1 till 6 and also for performing more than 7 sessions. These categories were based on making comparable groups regarding the number of sessions performed by the users. Moreover, percentages were also calculated for the trainings sessions of ‘e- Vita diabetes 2.0’ and ‘e-Vita COPD’ to see which and to what extent features were used during the trainings sessions. For calculating the average percentages the trainings sessions were excluded, because we want to assess how participants use the PHRs independently.
Moreover, additional variables were created. First, a variable was created to distinguish long and short-term users. The cut-off value for those who were categorized as long-short-term users was based on the research of Nijland et al. who used the users’ activity degree as cut-off value (45). Therefore, those who performed more sessions than the median number of sessions were categorized as long-term users. Besides, according to the research of Kelders et al., who found that long-term users show more involvement with the intervention, a variable was created to assess the number of participants who visited all available main features on the PHRs (e.g. for ‘e-Vita CHF’ these included using the features: monitoring, goal-setting/coaching, healthcare team and medication) (38).
2.2.1.4 Data analysis of log data
16 Additionally, the log data was used to assess whether the usage of features can predict if participants will become long-term users of a PHR. Identifying predictors for long-term usage offers the researchers opportunities to adjust the PHRs in such a way, for example with the help of persuasive elements, to support more patients to become long-term users. For the PHRs with a training session, the second login was attributed as first login which participants performed independently.
To identify these predictors for long-term usage, first univariate logistic regressions were performed to screen for potential predictors. Long and short-term users, were compared using the chi-square tests (χ2) and also odds ratios (OR) with 95% confidence intervals were reported. The lack of evidence-based literature about which intervention features could be predictors, caused that the current study is rather explorative than hypothesis confirming. According to the study of Bossen et al., which aimed to identify potential predictors for usage of a web-based intervention without selecting predictors on theoretical ground, it is recommended to use wide p-values (58). Therefore, the backward Likelihood Ratio (LR) method was used for these logistic regressions, with a threshold of p-value <0.1 for significant predictors.
Secondly, the features that reached the threshold of p-value <0.20 were included in a multivariate stepwise binary logistic regression to create a model for identifying predictors for long-term usage of the PHRs. Finally, model fitting was evaluated with the chi-square test (χ2 ), Nagelkerke R2 and Hosmer-lemeshow test of goodness of fit. Models with a χ2 with P<0.01 were attributed as significant predictive models. For the Nagelkekerke R2 a high value indicated that the variables contributed significantly to the model, with 1 as the maximum value. The hosmer-lemeshow test of goodness of fit was statistically significant if p<0.01, indicating that the model not fitted the model well.
2.2.2 Qualitative data
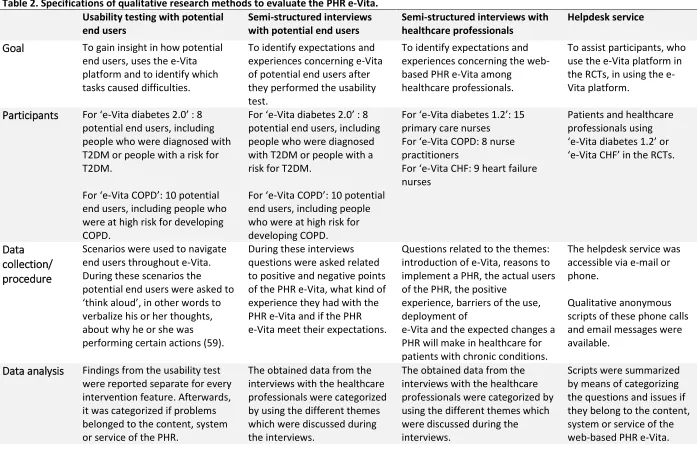
17 Table 2. Specifications of qualitative research methods to evaluate the PHR e-Vita.
Usability testing with potential end users
Semi-structured interviews with potential end users
Semi-structured interviews with healthcare professionals
Helpdesk service
Goal
To gain insight in how potential end users, uses the e-Vita platform and to identify which tasks caused difficulties.To identify expectations and experiences concerning e-Vita of potential end users after they performed the usability test.
To identify expectations and experiences concerning the web-based PHR e-Vita among
healthcare professionals.
To assist participants, who use the e-Vita platform in the RCTs, in using the e-Vita platform.
Participants
For ‘e-Vita diabetes 2.0’ : 8 potential end users, including people who were diagnosed with T2DM or people with a risk for T2DM.For ‘e-Vita COPD’: 10 potential end users, including people who were at high risk for developing COPD.
For ‘e-Vita diabetes 2.0’ : 8 potential end users, including people who were diagnosed with T2DM or people with a risk for T2DM.
For ‘e-Vita COPD’: 10 potential end users, including people who were at high risk for developing COPD.
For ‘e-Vita diabetes 1.2’: 15 primary care nurses
For ‘e-Vita COPD: 8 nurse practitioners
For ‘e-Vita CHF: 9 heart failure nurses
Patients and healthcare professionals using ‘e-Vita diabetes 1.2’ or ‘e-Vita CHF’ in the RCTs.
Data
collection/
procedure
Scenarios were used to navigate end users throughout e-Vita. During these scenarios the potential end users were asked to ‘think aloud’, in other words to verbalize his or her thoughts, about why he or she was performing certain actions (59).
During these interviews questions were asked related to positive and negative points of the PHR e-Vita, what kind of experience they had with the PHR e-Vita and if the PHR e-Vita meet their expectations.
Questions related to the themes: introduction of e-Vita, reasons to implement a PHR, the actual users of the PHR, the positive
experience, barriers of the use, deployment of
e-Vita and the expected changes a PHR will make in healthcare for patients with chronic conditions.
The helpdesk service was accessible via e-mail or phone.
Qualitative anonymous scripts of these phone calls and email messages were available.
Data analysis
Findings from the usability test were reported separate for every intervention feature. Afterwards, it was categorized if problems belonged to the content, system or service of the PHR.The obtained data from the interviews with the healthcare professionals were categorized by using the different themes which were discussed during the interviews.
The obtained data from the interviews with the healthcare professionals were categorized by using the different themes which were discussed during the interviews.
18 2.2.2.2 Data analysis of qualitative data
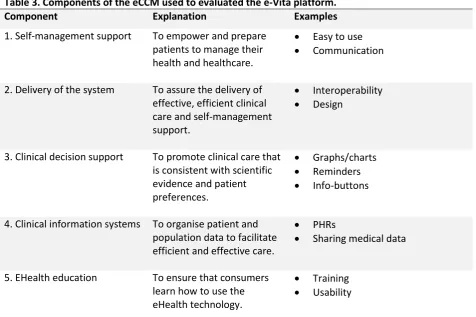
[image:19.595.72.549.187.504.2]Quotes of the interviews, outcomes of the usability tests and summarized data of the helpdesk service were used to evaluated to what extent the e-Vita platform and its implementation fits the components of the eCCM described in table 3. In the results section first per qualitive research method outcomes were presented. Afterwards, by placing the PHRs in the eCCM, it was indicated how the PHR can be redesigned with regard to which eCCM components needed improvements.
Table 3. Components of the eCCM used to evaluated the e-Vita platform.
Component Explanation Examples
1. Self-management support To empower and prepare patients to manage their health and healthcare.
• Easy to use
• Communication
2. Delivery of the system To assure the delivery of effective, efficient clinical care and self-management support.
• Interoperability
• Design
3. Clinical decision support To promote clinical care that is consistent with scientific evidence and patient preferences.
• Graphs/charts
• Reminders
• Info-buttons
4. Clinical information systems To organise patient and population data to facilitate efficient and effective care.
• PHRs
• Sharing medical data
5. EHealth education To ensure that consumers learn how to use the eHealth technology.
• Training
• Usability
2.2.3 Synthesizing the quantitative and qualitive data
19
3. Results
The first part of the results section consisted the outcomes of the log data analysis. The log data analysis included findings of: the number of sessions performed by the users, frequency of usage of the different features and outcomes of the logistic regression analysis. In the second part, qualitative data was analysed to evaluate if the PHRs fits the eCCM.
3.1 Log data analysis of the web-based PHR e-Vita
[image:20.595.74.462.274.433.2]3.1.1 Number of users
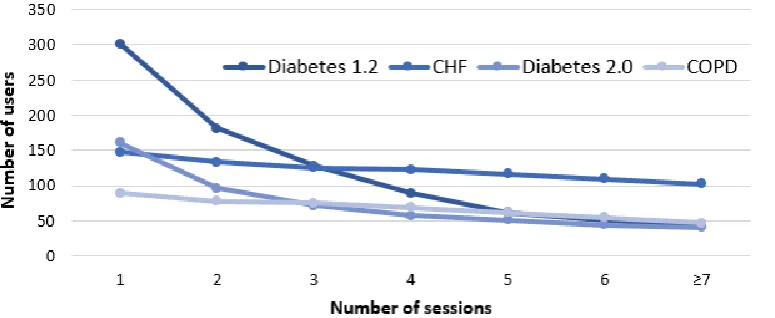
Figure 4. shows the number of users that performed a certain number of sessions, stratified for the different e-Vita versions. For the usage of the PHR e-Vita, a declining trend was observed in the number of users that performed more sessions. Additionally, for ‘e-Vita CHF’ the highest number of users who performed ≥ 7 sessions was shown.
Figure 4. Total number of sessions performed on the PHRs e-Vita.
[image:20.595.77.490.556.685.2]Figure 5. shows the number of sessions per month and the time points (see arrows) on which reminders to use the ‘e-Vita diabetes 1.2’ platform were sent from the helpdesk to the participants. The figure reported that after sending reminders the number of sessions increased for the subsequent month. For example, in September 2013 a number of 83 sessions were performed and after sending reminders an increase to 153 sessions in October 2013 was shown.
20
3.1.2 Frequency of usage of the different features
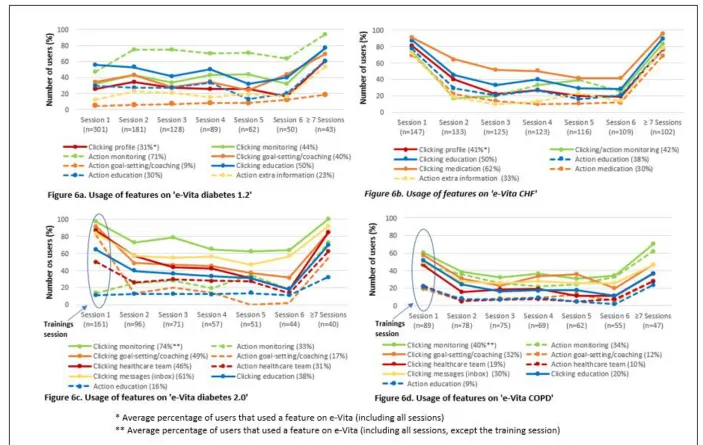
Figure 6. shows the percentages of users who used the different features of the PHR e-Vita per session. For ‘e-Vita diabetes 1.2’ Figure 6a. shows that performing an action on the monitoring feature (insight in own health values) was the most frequently used feature across the sessions. An average percentage of 71% users performed an action on the monitoring feature compared to 9% for the least used feature, which was goal-setting/coaching (adding a personal goal). ‘e-Vita CHF’ was predominantly used for clicking the feature medication with an average percentage of 62% participants (Figure 6b.). However, performing an action on the medication feature (adding medication usage) was the least used feature, with an average of 30% participants. Thereafter, figure 6c. and 6d. shows that for both ‘e-Vita diabetes 2.0’ and ‘e-Vita COPD’ clicking the monitoring feature was the most frequently used feature with average percentage of respectively 74% and 40% across the sessions. Moreover, for both e-Vita platforms performing an action on the education feature (getting information about their chronic condition) was the least used feature. Average percentage of respectively 16% (Diabetes 2.0) and 9% (COPD) were shown.
Furthermore, data analysis revealed that the users with ≥ 7 sessions in all e-Vita versions had significantly (p<0.01) higher percentages of usage for all features compared to the average percentages across the sessions. Showing that longer usage of the PHRs referring to those who performed ≥ 7 sessions on the e-Vita platform are more intensively using the different feature on the PHRs.
22
3.1.3 Predictors for long-term usage
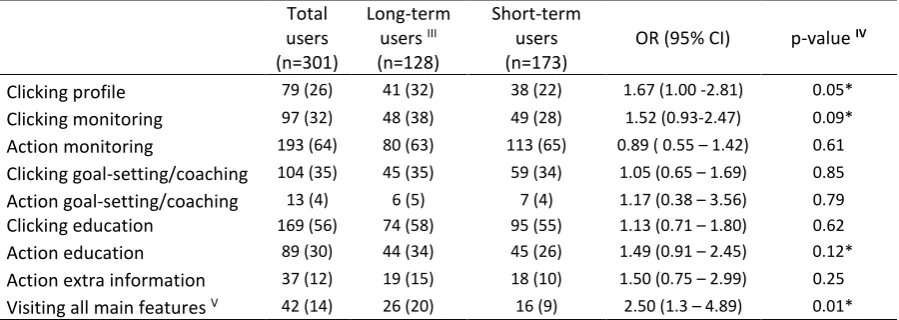
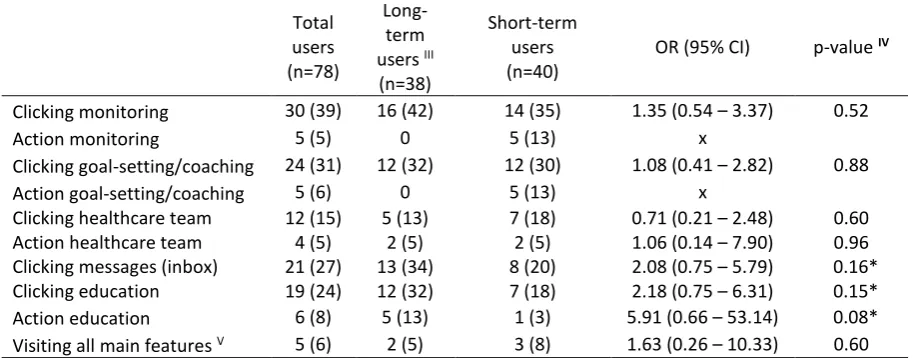
For all e-Vita platforms, univariate logistic regression analysis were performed to investigate if there were significant differences in usage of the features between long- and short term users during the first session users performed on their own. Therefore, trainings sessions were excluded from the analysis. Table 4 to 7 shows the outcomes of the univariate logistic regression analyses. Features which reached the threshold of p <0.2 were attributed as potential predictors. The median amount of total sessions was attributed as cut-off value to categorize long and short-term users. The median amount of sessions for e- Vita diabetes 1.2’, ‘e-Vita CHF’, ‘e-Vita diabetes 2.0’ and ‘e-Vita COPD’ were respectively 2, 15, 5 and 8 sessions.
[image:23.595.73.523.421.581.2]For ‘e-Vita diabetes 1.2’ table 4. shows that users who clicked the monitoring or profile feature, performed an action on the education feature or visited all 4 main features (profile, measurements, goals & education), had a higher probability to become long-term users compared to those who not used these feature or used less than 4 features of the PHR. For ‘e-Vita CHF’ (table 5). it was found that all users who used one of the features had a higher probability to become long-term users compared to those who not used any feature. For ‘e-Vita diabetes 2.0’ (table 6.) none of the features used in the first sessions created an higher probability to become long-term user compared to those who not used the features. At last, for ‘e-Vita COPD’ users who clicked the feature messages (inbox) and performing an action on the education component were found to have a higher probability to become long-term users compared to those who not used these features shown in table 7.
Table 4. Univariate Logistic regression: potential predictors for usage ‘e-Vita diabetes 1.2’I, II Total
users (n=301)
Long-term users III (n=128)
Short-term users (n=173)
OR (95% CI) p-value IV
Clicking profile 79 (26) 41 (32) 38 (22) 1.67 (1.00 -2.81) 0.05*
Clicking monitoring 97 (32) 48 (38) 49 (28) 1.52 (0.93-2.47) 0.09*
Action monitoring 193 (64) 80 (63) 113 (65) 0.89 ( 0.55 – 1.42) 0.61
Clicking goal-setting/coaching 104 (35) 45 (35) 59 (34) 1.05 (0.65 – 1.69) 0.85
Action goal-setting/coaching 13 (4) 6 (5) 7 (4) 1.17 (0.38 – 3.56) 0.79
Clicking education 169 (56) 74 (58) 95 (55) 1.13 (0.71 – 1.80) 0.62
Action education 89 (30) 44 (34) 45 (26) 1.49 (0.91 – 2.45) 0.12*
Action extra information 37 (12) 19 (15) 18 (10) 1.50 (0.75 – 2.99) 0.25
Visiting all main features V 42 (14) 26 (20) 16 (9) 2.50 (1.3 – 4.89) 0.01*
I. Data is presented as n (%). II. The reference groups are non-usage and < 4 features used. III. Long-term users were
defined as participants with >2 sessions. IV. *P < 0.2 is potential predictor. V. In total ‘e-Vita diabetes 1.2’ included 4
23 Table 5. Univariate Logistic regression: potential predictors for usage ‘e-Vita CHF ’I, II
Total users (n=147)
Long-term users III
(n=73)
Short-term users (n=74)
OR (95% CI) p-value IV
Clicking profile 120 (82) 71 (97) 49 (66) 18.11 (4.1 – 80.01) 0.00* Action monitoring 109 (74) 68 (93) 41 (55) 10.95 (3.96 – 30.27) 0.00* Clicking education 129 (88) 73 (100) 56 (76) x
Action education 114 (78) 69 (95) 45 (61) 11.12 (3.66 – 33.76) 0.00* Clicking medication 134 (91) 73 (100) 61 (82) x
Action medication 103 (70) 66 (90) 37 (50) 9.43 (3.83 – 23.25) 0.00* Action extra information 106 (72) 68 (93) 38 (51) 12.88 (4.66 – 35.59) 0.00* Visiting all main features V 101 (69) 67 (92) 34 (46) 13.14 (5.07 – 34.04) 0.00*
I. Data is presented as n (%). II. The reference groups are non-usage and < 4 component used. III. Long-term users were
defined as participants with >15 sessions. IV. *P < 0.2 is potential predictor. V. In total ‘e-Vita CHF’ included 4 main
[image:24.595.79.523.304.487.2]features (profile, measurements, goals & education). OR = Odds ratio; CI = Confidence interval.
Table 6. Univariate Logistic regression: potential predictors for usage ‘e-Vita Diabetes 2.0 ’I, II
Total users (n=96)
Long-term users III (n=45)
Short-term users (n=51)
OR (95% CI) p-value IV
Clicking monitoring 70 (73) 35 (78) 35 (69) 1.60 (0.64 – 4.00) 0.31 Action monitoring 24 (25) 14 (31) 10 (20) 1.85 (0.73 – 4.72) 0.20 Clicking goal-setting/coaching 47 (49) 22 (49) 25 (49) 1.00 (0.45 – 2.22) 0.99 Action goal-setting/coaching 13 (14) 8 (18) 5 (10) 1.99 (0.60 – 6.59) 0.26 Clicking healthcare team 55 (57) 24 (53) 31 (61) 0.74 (0.33 – 1.66) 0.46 Action healthcare team 25 (26) 10 (22) 15 (29) 0.69 (0.27 – 1.73) 0.42 Clicking messages (inbox) 55 (57) 26 (58) 29 (57) 1.04 (0.46 – 2.34) 0.93 Clicking education 38 (40) 16 (36) 22 (43) 0.73 (0.32 – 1.66) 0.45 Action education 12 (13) 5 (11) 7 (14) 0.79 (0.23 – 2.67) 0.70 Visiting all main features V 27 (28) 11 (24) 16 (31) 0.71 (0.28 – 1.74) 0.45
I. Data is presented as n (%). II. The reference groups are non-usage and < 5 component used. III. Long-term users were
defined as participants with >5 sessions. IV. *P < 0.2 is potential predictor. V. In total there were 5 main features
(measurements, goals, healthcare team, messages & education). OR = Odds ratio; CI = Confidence interval.
Table 7. Univariate Logistic regression: potential predictors for usage ‘e-Vita COPD ’I, II
Total users (n=78)
Long-term users III (n=38)
Short-term users (n=40)
OR (95% CI) p-value IV
Clicking monitoring 30 (39) 16 (42) 14 (35) 1.35 (0.54 – 3.37) 0.52
Action monitoring 5 (5) 0 5 (13) x
Clicking goal-setting/coaching 24 (31) 12 (32) 12 (30) 1.08 (0.41 – 2.82) 0.88 Action goal-setting/coaching 5 (6) 0 5 (13) x
Clicking healthcare team 12 (15) 5 (13) 7 (18) 0.71 (0.21 – 2.48) 0.60 Action healthcare team 4 (5) 2 (5) 2 (5) 1.06 (0.14 – 7.90) 0.96 Clicking messages (inbox) 21 (27) 13 (34) 8 (20) 2.08 (0.75 – 5.79) 0.16* Clicking education 19 (24) 12 (32) 7 (18) 2.18 (0.75 – 6.31) 0.15* Action education 6 (8) 5 (13) 1 (3) 5.91 (0.66 – 53.14) 0.08* Visiting all main features V 5 (6) 2 (5) 3 (8) 1.63 (0.26 – 10.33) 0.60
I. Data is presented as n (%). II. The reference groups are non-usage and < 5 component used. III. Long-term users were
defined as participants with >8 sessions. IV. *P-value < 0.2 is potential predictor. V. In total there were 5 main features
[image:24.595.70.530.554.733.2]24 Subsequently, for ‘e-Vita diabetes 1.2’, ‘e-Vita CHF’ and ‘e-Vita COPD’, binary logistic regression analyses with a stepwise method were performed to identify the positive predictors (p<0.1) for long-term usage. Therefore, the identified potential predictors from the univariate analyses were used to create models to identify predictors for long-term usage of PHRs.
For ‘e-Vita diabetes 1.2’, the analysis resulted in a model (table 8), with using all main features (profile, measurements, goals & education) of the PHR as positive predictor for long-term usage with OR= 2.5 (p= 0.01). The logistic regression analysis yielded a significant model, X2
1= 7.42, p= 0.01 and Nagelkerke R2 of 0.03.
Table 9. shows the results of the multivariate binary logistic regression for ‘e-Vita CHF’. The analysis resulted in a model with performing an action on the education feature, performing an action on the medication feature or using all main features (profile, measurements, goals & education) of the PHR as significant positive predictors with respectively OR= 5.3 (p= 0.01), OR= 6.8 (p= 0.00) and OR= 7.5 (p= 0.00). The logistic regression yielded a significant model, X2
3= 64.32 p= 0.00 and Nagelkerke R2 of 0.47. Additionally, the hosmer-lemeshow test of goodness of fit was not statistically significant (p= 0.55), indicating that the data fitted the model well.
Lastly, table 10. shows the outcomes of the logistic regression analysis for ‘e-Vita COPD’. The analysis resulted in a model, with performing an action on the education feature as positive predictor with OR= 5.9 (p= 0.11). But, the positive predictor did not contributed significantly to the model to predict long-term usage. The logistic regression yielded a model with, X2
[image:25.595.71.465.251.298.2]1= 3.36, p= 0.06 and Nagelkerke R2 of 0.06. Table 8. Logistic regression model: predictors for usage ‘e-Vita diabetes 1.2’I, II
B (SE) OR (95% CI) p-value III Visiting all main features IV
1.23 (0.50) 2.50 (1.3 – 4.89) 0.01
Constant -0.43 (0.13) 0.00
I. Data is presented as n (%). II. The reference group is < 4 components used.III. Significance level at p <
0.01. IV. in total ‘e-Vita diabetes 1.2’ include 4 main features (profile, measurements, goals & education).
[image:25.595.70.478.477.557.2]B =Unstandardized coefficient; SE =Standard error; OR =Odds ratio; CI =Confidence interval.
Table 9. Logistic regression model: predictors for usage ‘e-Vita CHF’ I,II
B (SE) OR (95% CI) p-value III
Action education 1.66 (0.65) 5.25 (1.50 - 18.61) 0.01 Action medication 1.91 (0.51) 6.75 (2.47 - 18.41) 0.00 Visiting all main features IV 2.02 (0.53) 7.54 (2.66 - 21.38) 0.00
Constant -4.30 (0.84) 0.00
I. Data is presented as n (%). II. The reference group is non-usage or <4 components used. III. Significance
level at p< 0.01. IV.In total ‘e-Vita CHF’ include 4 main features (profile ,measurements, goals &
[image:25.595.70.479.693.742.2]education). B = Unstandardized coefficient; SE = Standard error; OR = Odds ratio; CI = Confidence interval
Table 10. Logistic regression model: predictors for usage ‘e-Vita COPD’I, II
B (SE)III OR (95% CI) p-value III Action education 1.78 (1.12) 5.91 (0.66 – 53.14) 0.11
Constant -0.17 (0.24) 0.48
I. Data is presented as n (%). II. The reference group is non-usage. III. Significance level at p< 0.1.
25
3.2 Qualitative data analysis of the web-based PHR e-Vita
In this part the collected qualitive data concerning the experiences of the potential end users and healthcare professionals was reported per research method. Afterwards, with the qualitative data it is evaluated to what extent the e-Vita platform fits the eCCM components. Lastly, the results of the focus groups concerning the integration of an interactive PHR for chronic care was reported.
3.2.1 Usability testing and interviews among potential end users
The results of the usability test for ‘e-Vita diabetes 2.0’ and ‘e-Vita COPD’ showed that potential end users experiences difficulties with adding goals. Most of the participants did not understand the differences between adding a wish or challenge and it was unclear which buttons should be used for a certain function on the goal-setting/coaching feature. Furthermore, the potential end users had problems with understanding what the next steps were after filling in a wish or challenge. Additionally, in the interviews with the potential end user for ‘e-Vita COPD’ it was revealed that when they have questions they prefer to ask one of their healthcare professionals instead of assessing the education feature on the e-Vita platform. Besides, in the interviews among potential end users for ‘e-Vita diabetes 2.0’ it was revealed that potential end users prefer more communication with the healthcare professionals. For example, about how to set or reach their health related goals or get feedback about their measured health values.
At last, from the usability tests among potential end users for ‘e-Vita diabetes 2.0’ and ‘e-Vita diabetes COPD’ it can be concluded that the navigation via the e-Vita platform was unclear, with regard to where functions can be found and how to use these functions. Moreover, meaning of some buttons presented in the PHRs were unclear. The potential end users for ‘e-Vita COPD’ reported that they could not find the education feature which was called ‘library’ and for ‘e-Vita diabetes 2.0’ the potential end users reported that buttons were presented in an illogical order. For example for adding weight, first the buttons ‘target values’ and ‘all measurements’ appear and lastly the button ‘adding weight’. Another issue with the navigation for ‘e-Vita diabetes 2.0’ and ‘e-Vita COPD’ was that clicking on a caregiver not directly navigated the potential end users to sending a message. These kind of issues confused some potential end users and let them think that they were on the wrong place for sending a message.
3.2.2 Interviews among healthcare professionals
From collected data of the interviews for ‘e-Vita diabetes 1.2’ and ‘e-Vita CHF’ it was obtained that logging in to the e-Vita platform caused problems. Moreover, healthcare professionals of ‘e-Vita diabetes’ stated: “When you want to visit e-Vita you had to take the hurdle of logging in first”.
26 For ‘e- Vita’ CHF’ there was a connection with the telehealth system ‘Motiva’. However, when HF nurses noticed deflected values in ‘Motiva’ they should first open the e-Vita platform to check (patient-reported) changes in medication use or co-morbidities. In the interviews among HF nurses for ‘e-Vita CHF’ they mentioned that it its inefficient to use the e-Vita platform due to the lack of connection between the e-Vita platform, ‘Motiva’ and their own (electronic) patient record. “We constantly need
to switch between these three systems, that is just not workable that way”.Moreover, for ‘e-Vita COPD’
the healthcare professionals also reported about the lack of connection to other systems. Working with multiple systems was perceived as non-practical and labour-intensive. At last, from the healthcare professionals for ‘e-Vita COPD’and ‘e-Vita CHF’ it was obtained that the information on the e-Vita platforms was often incomplete or inaccurate. As an example, for the education feature information was out dated or about another disease.
For ‘e-Vita diabetes 2.0’ and ‘e-Vita COPD’ trainings sessions were provided for both the potential end users and the healthcare professionals. Despite these trainings sessions the interviews healthcare professionals for ‘e-Vita COPD’ found that it was hard to promote and explain their patients about the health platform e-Vita. One of the healthcare professionals said: “I did not know very well what was
especially asked of use. We had done what we had to do and thought e-Vita will do something further
with it”.Furthermore, for ‘e-Vita diabetes 1.2’ healthcare professionals mentioned : “You don’t know
e-Vita and you had to explain it to the patients. That does not work.“ Subsequently, evaluating ‘e-Vita diabetes 1.2’, ‘e-Vita CHF’ and ‘e-Vita COPD’ the interviews revealed that for both the potential end users and healthcare professionals it was unclear what was exactly expected from them regarding the e-Vita platform. Moreover, in the interviews for ‘e-Vita diabetes 1.2’ it was found that the PHR did not meet the needs of the patients.
3.2.3 Data from the helpdesk
The e-Vita platform was a PHRs which for example tended to provide data of a person’s annual check -ups. However, helpdesk data for ‘e-Vita diabetes 1.2’ shows that data of annual check-ups and other research outcomes were frequently not visible on the e-Vita platform. This was a consequence of the unclear communication to the healthcare professionals that they were responsible for uploading the relevant health outcomes (e.g. laboratory results, data of annual check-ups).
27
3.2.4 Placing the e-Vita platform in the eCCM
In table 11. the PHRs were placed in the eCCM using qualitative data from the interviews, usability tests and helpdesk service. In the table the problems with the PHR, obtained from the qualitative data, which probably hinders the implementation and uptake of the PHR were categorized to the components of the eCCM to which they belong. Besides, the feedback loop presented in the eCCM required for productive interactions between the informed, activated patients and the prepared, proactive healthcare professionals to provide tailored self-management was missing in all the PHRs.
3.2.5 Focus groups among healthcare professionals
The focus groups among healthcare professionals, in which it was discussed how the features: monitoring, coaching, education and logistic support could be of added value in an interactive PHR, recommended to create an better fit between the patients and the care process. This can be reached by offering the features of an interactive PHR as connected parts. For example, the education feature should be adjusted to the personalized health-related goals. Furthermore, it was recommended by the healthcare professionals to use pre-consult questionnaires in the interactive PHR to obtain personal information such as: complains, medical history etc., so during the consults there is more time left to discuss issues like which goals they wanted to reach and together with the healthcare professionals they can make the goals more visible. However, to get the right information on the right place it is required that different healthcare system are connected to each other. Moreover, the healthcare professionals mentioned that it was useful to give all involved healthcare professionals access to relevant medical information to improve the treatment and assistance for the patients. Additionally, it was also recommended that positive feedback and rewards are important to stimulate patients in using the PHR. For example, healthcare professionals can make appointments with the patients about on which timepoint feedback is provided.
Table 11. Placing the e-Vita platform in the eCCM.
Components of the eCCM Problems with the e-Vita platform 1. Self-management support • Logging in
• Using the goal-setting/coaching feature
• Unclear buttons
• Communication with healthcare professionals was lacking
• Interaction between users and the system 2. Delivery of the system • Connection to other systems is missing
• Unclear navigation throughout the different features
• incomplete information regarding personal data/education 3. Clinical decision support • PHR did not meet the needs of the end users
• Health outcomes cannot be tracked for longer than 2 weeks, restricting the healthcare professionals in making more suitable treatment plans.
• Not integrated in their daily routines/ no reminders 4. Clinical information
support
• Missing health data (e.g. of annual check-ups)
• Patients were unaware that they had to fill in some data by their selves.
5. EHealth education • Healthcare professionals found it hard to explain and promote the platform e-Vita