University of Warwick institutional repository: http://go.warwick.ac.uk/wrap
This paper is made available online in accordance with
publisher policies. Please scroll down to view the document
itself. Please refer to the repository record for this item and our
policy information available from the repository home page for
further information.
To see the final version of this paper please visit the publisher’s website.
Access to the published version may require a subscription.
Author(s): P. Rodríguez-Gil, B. T. Gänsicke, H.-J. Hagen, D. Nogami,
M. A. P. Torres, H. Lehto, A. Aungwerojwit, S. Littlefair, S.
Araujo-Betancor, D. Engels
Article Title: HS 0943+1404, a true intermediate polar
Year of publication: 2005
Link to published article:
http://dx.doi.org/10.1051/0004-6361:20053141
/
c
ESO 2005
Astrophysics
&
HS 0943+1404, a true intermediate polar
P. Rodríguez-Gil
1,2, B. T. Gänsicke
1, H.-J. Hagen
3, D. Nogami
4, M. A. P. Torres
5,
H. Lehto
6,7, A. Aungwerojwit
1, S. Littlefair
8, S. Araujo-Betancor
9, and D. Engels
31 Department of Physics, University of Warwick, Coventry CV4 7AL, UK
e-mail:[email protected]
2 Instituto de Astrofísica de Canarias, Vía Láctea, s/n, La Laguna, 38205 Santa Cruz de Tenerife, Spain 3 Hamburger Sternwarte, Universität Hamburg, Gojenbergsweg 112, 21029 Hamburg, Germany 4 Hida Observatory, Kyoto University, Kamitakara, Gifu 506-1314, Japan
5 Harvard-Smithsonian Center for Astrophysics, 60 Garden St., Cambridge, MA 02138, USA 6 Tuorla Observatory, Turku University, Väisäläntie 20, 21500 Piikkiö, Finland
7 Department of Physics, 20014 University of Turku, Finland 8 School of Physics, University of Exeter, Exeter EX4 4QL, UK
9 Space Telescope Science Institute, 3700 San Martin Drive, Baltimore, MD 21218, USA
Received 28 March 2005/Accepted 1 June 2005
Abstract.We have identified a new intermediate polar, HS 0943+1404, as part of our ongoing search for cataclysmic variables in the Hamburg Quasar Survey. The orbital and white dwarf spin periods determined from time-resolved photometry and spectroscopy are Porb250 min and Pspin=69.171±0.001 min, respectively. The combination of a large ratio Pspin/Porb0.3 and a long orbital period is very unusual compared to the other known intermediate polars. The magnetic moment of the white dwarf is estimated to beµ1 ∼1034G cm3, which is in the typical range of polars. Our extensive photometry shows that HS 0943+1404 enters into deep (∼3 mag) low states, which are also a characteristic feature of polars. We therefore suggest that the system is a true “intermediate” polar that will eventually synchronise, that is, a transitional object between intermediate polars and polars. The optical spectrum of HS 0943+1404 also exhibits a number of unusual emission lines, most noticeably NIIλ5680, which is likely to reflect enhanced nitrogen abundances in the envelope of the secondary.
Key words.accretion, accretion disc – stars: binaries: close – stars: novae, cataclysmic variables
1. Introduction
Our understanding of the evolution of cataclysmic variables (CVs) is still very fragmentary. It is clear that the current the-ory of CV evolution – largely resting on the disrupted magnetic braking scenario (King 1988) – makes a number of predictions in strong conflict with the observational data. For instance, the theoretical minimum orbital period is∼70 min, much shorter than the observed∼80 min (Kolb & Baraffe 1999). In addi-tion, CVs are expected to spend most of their lifetime near the minimum period, a fact not corroborated by the observations.
Based in part on observations obtained at the German-Spanish Astronomical Center, Calar Alto, operated by the Max-Planck-Institut für Astronomie, Heidelberg, jointly with the Spanish National Commission for Astronomy, on observations made with the NOT telescope, operated on the island of La Palma by the Instituto de Astrofísica de Canarias (IAC) at the Spanish Observatorio del Roque de los Muchachos, on observations made with the IAC80 tele-scope, operated on the island of Tenerife by the IAC at the Spanish Observatorio del Teide, on observations made with the 1.2 m telescope at the FLWO Observatory, a facility of the Smithsonian Institution.
With regard to the CV populations above and below the pe-riod gap, we observe similar numbers of systems on both sides, while all population syntheses predict that∼95% of the entire CV population should have orbital periods below the gap (Kolb 1993; Howell et al. 1997). These three fundamental discrepan-cies, among others, clearly depict the current misaligning be-tween theory and observations.
Although CV evolution theory has undergone a number of modifications/alternatives (e.g. King & Schenker 2002; Schenker & King 2002; Schenker et al. 2002; Andronov et al. 2003), the discrepancies with the properties of the observed CV population remain unsatisfactorily large, and it seems to be clear that observational selections effects represent a ma-jor problem. Gänsicke (2004) has shown that the mama-jority of all CVs have been identified primarily through their variability or through the detection of X-rays, leaving a large parameter space unsampled. We are currently carrying out a large-scale search for CVs based on their spectroscopic properties in the Hamburg Quasar Survey (HQS, Hagen et al. 1995), with the aim of identifying CVs that are inconspicuous in variability or X-ray surveys (Gänsicke et al. 2002b).
702 P. Rodríguez-Gil et al.: The new intermediate polar HS 0943+1404
This method proved successful and led to the discovery of a number of systems that show either no or infrequent out-bursts, such as e.g. the dwarf nova GY Cnc=HS 0907+1902 (Gänsicke et al. 2000), the SW Sex star HS 0728+6738 (Rodríguez-Gil et al. 2004b), and the enigmatic low-mass transfer system HS 2331+3905 (Araujo-Betancor et al. 2005). Another important class of CVs characterised by rather low levels of variability are those systems containing a magnetic white dwarf, that is rotating either synchronous to the or-bital period (polars) or asynchronous (intermediate polars, IPs). The follow-up of HQS CV candidates led to the discovery of a new type of very low mass transfer polars, WX LMi= HS 1023+3900 (Reimers et al. 1999) and HS 0922+1333 (Reimers & Hagen 2000), that may be systems shortly before the onset of Roche-lobe overflow from the secondary; the ul-tra high-field polar RX J1554.2+2721=HS 1552+2730 (Jiang et al. 2000; Thorstensen & Fenton 2002; Gänsicke et al. 2004); and the two intermediate polars 1RXS J062518.2+733433= HS 0618+7336 (Araujo-Betancor et al. 2003) and DW Cnc= HS 0756+1624 (Rodríguez-Gil et al. 2004a).
Here we report on the discovery of the third IP, HS 0943+1404, which exhibits very unusual characteristics, and may be one example of the long-sought link between asyn-chronous and synasyn-chronous magnetic CVs.
2. Observations and data reduction
2.1. Photometry
Differential CCD photometric time series of HS 0943+1404 were obtained during 25 nights throughout the period December 2002 to March 2004, accumulating a total coverage of106 h (Table 1). The photometric observations were carried out at six different telescopes. Brief details about the individual instrumentation and reduction process are given below.
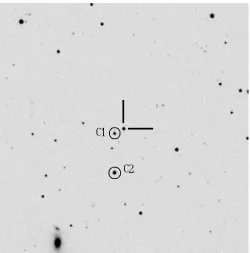
[image:3.595.325.559.111.670.2]Calar Alto Observatory. At Calar Alto, filterless and V-band CCD photometry of HS 0943+1404 was obtained in December 2002 and December 2003 with the CAFOS SITe CCD cam-era on the 2.2 m telescope using a small read-out window. The photometric reduction was carried out using the pipeline de-scribed by Gänsicke et al. (2004), which, in brief, pre-processes the images inESO-MIDASand performs aperture photometry of all stars in the field of view using theSextractor(Bertin & Arnouts 1996). Differential magnitudes of HS 0943+1404 were measured relative to the star “C1” (USNO–A2.0 0975– 06331245, R=15.9, B=15.9; see Fig. 1), located30 south-east of the CV. The comparison star “C1” was checked against the secondary comparison star “C2” (USNO–A2.0 0975– 06331238, R=14.3, B=14.6), and no significant variability was detected. In addition, a number of acquisition images of HS 0943+1404 were obtained prior to spectroscopic observa-tions (Sect. 2.2), at both the 2.2 m and the 3.5 m telescopes, and the magnitude of the target was determined interactively with theIRAFtaskimexam, using again the comparison star “C1” in Fig. 1.
Table 1. Log of the photometric observations.
UT Date Coverage Filter Exp. # Frames Mean
(h) (s) magnitude
Calar Alto 2.2 m
2001 Apr. 30 – V 30 1 17.0
2002 Dec. 14 – V 30 1 17.6
2002 Dec. 15 – V 30 1 17.6
2002 Dec. 28 1.16 V 45 64 19.2
2003 Mar. 06 – Clear 20 1 19.1
2003 Dec. 17 1.11 Clear 30 88 16.1
2003 Dec. 23 – Clear 30 2 16.6
2003 Dec. 23 – V 30 2 16.5
Calar Alto 3.5 m
2004 Mar. 02 – V 30 1 16.7
2004 Mar. 03 – V 30 1 16.5
FLWO 1.2 m, CCD
2004 Mar. 09 4.96 Clear 60 407 16.2
2004 Mar. 10 7.70 Clear 60 471 16.3
2004 Mar. 19 3.72 Clear 60 270 16.4
2004 Mar. 20 7.08 Clear 60 605 16.3
IAC80 0.8 m, CCD
2003 Dec. 27 5.81 Clear 40 500 16.3
2003 Dec. 28 3.19 Clear 40 261 16.4
Tuorla 0.7 m, CCD
2004 Jan. 20 3.97 Clear 60 217 16.5
2004 Feb. 09 6.89 Clear 60 360 16.4
2004 Mar. 16 5.76 Clear 60 299 16.5
2004 Mar. 18 7.83 Clear 60 395 16.5
Hida 0.6 m, CCD
2004 Mar. 09 6.64 Clear 60 321 16.4
2004 Mar. 13 2.26 Clear 60 113 16.3
2004 Mar. 15 3.67 Clear 60 191 16.4
2004 Mar. 19 2.67 Clear 60 136 16.4
2004 Mar. 26 0.52 Clear 60 24 16.5
2004 Mar. 27 6.17 Clear 60 296 16.3
2004 Mar. 28 6.60 Clear 60 306 16.4
JKT 1.0 m
2002 Dec. 29 2.72 Clear 60 120 19.0
2002 Dec. 31 6.25 Clear 60 296 19.0
2003 Jan. 04 2.75 Clear 45 148 18.2
2003 Jan. 05 0.40 Clear 30 32 18.7
2003 Jan. 07 3.52 Clear 45 205 18.9
2003 Jan. 09 2.76 Clear 60 91 19.1
Fig. 1. 10×10 finding chart of HS 0943+1404 obtained from the Digitized Sky Survey. The coordinates of the CV areα(J2000) = 09h46m34.5s,δ(J2000)= +13◦5058.1. North is up and east to the left. “C1” is the primary comparison star and “C2” is the check star.
Fred Lawrence Whipple Observatory. Filterless observations of HS 0943+1404 were carried out with the 1.2 m telescope at the Fred Lawrence Whipple Observatory (FLWO) in March 2004. The 4-Shooter CCD camera was in place, which consists of an array of four 2048×2048 pixel2CCDs. Only a small win-dow of the CCD #3 was read out. Data reduction was carried out usingIRAF. After bias and flat-field corrections, the images were aligned and instrumental magnitudes of HS 0943+1404 and the comparison stars “C1” and “C2” were extracted using the point spread function (PSF) packages. Differential magni-tudes of HS 0943+1404 were then computed relative to “C1”.
Observatorio del Teide. Filterless CCD photometry of HS 0943+1404 was obtained at the 0.8 m IAC80 telescope at the Observatorio del Teide on Tenerife in December 2003, us-ing the Thomson 1 k×1 k pixel2camera. The observations and data reduction were carried out in an analogous way as de-scribed above for the FLWO photometry.
Tuorla Observatory. The 0.7 m Schmidt-Vaisala telescope at Tuorla Observatory was used in January, February and March 2004 to obtain filterless photometry of HS 0943+1404 using a SBIG ST–8 CCD camera. Observations and data reduction were carried out in the same way as described above for the Calar Alto photometry.
[image:4.595.305.518.110.303.2]Hida Observatory. We performed filterless CCD photome-try of HS 0943+1404 with the 0.6 m telescope and the SITe CCD camera at Hida Observatory (Japan) in March 2004. After standard reduction of the raw images, differential aperture
Table 2. Log of the spectroscopic observations.
UT Date Coverage Grating Exp. # Frames
(h) (s)
Calar Alto 2.2 m, CAFOS
2001 Apr. 30 – B–200 600 1
2002 Dec. 14 0.75 G–100 600 5
2002 Dec. 15 0.76 G–100 600 5
2003 Dec. 23 4.67 G–100 600 22
NOT 2.5 m, ALFOSC
2003 Dec. 16 4.12 Grism #7 600 24 2003 Dec. 17 6.03 Grism #7 300 64
Calar Alto 3.5 m, MOSCA
2004 Mar. 01 0.37 G–1000 300 4
2004 Mar. 02 2.08 G–1000 450 15
2004 Mar. 03 3.18 G–1000 450 14
photometry was carried out relative to the comparison star “C1” in a standard manner usingIRAF.
2.2. Optical spectroscopy
Calar Alto Observatory. An identification spectrum of HS 0943+1404 was obtained on 2001 April 30 at the 2.2 m telescope using the Calar Alto Faint Object Spectrograph (CAFOS) equipped with the standard SITe 2k×2k pixel2CCD (Table 2). The B–200 grating in conjunction with a 1.5slit provided a spectral resolution of10 Å (full width at half max-imum, FWHM) over the wavelength rangeλλ3800−7000. The spectrum was reduced online using theMIDASquicklook con-text available at the telescope. The detection of strong Balmer and helium emission lines revealed the likely CV nature of HS 0943+1404.
CAFOS on the 2.2 m telescope was again used in December 2002 and December 2003 to obtain time-resolved, follow-up spectroscopy. The G–100 grism and a slit width of 1.2covered the wavelength rangeλλ4300−8300 at a spec-tral resolution of4.5 Å FWHM. The raw images were bias-subtracted and flat-field compensated before removing the sky contribution. The spectra of HS 0943+1404 were optimally ex-tracted according to the algorithm explained in Horne (1986). To achieve a proper wavelength calibration, a low-order poly-nomial was fitted to the arc data (the rms being less than one tenth of the dispersion in all cases). The pixel-wavelength de-pendence for each target spectrum was obtained by interpo-lating between the two nearest arc spectra. The reduction and extraction were performed within IRAF1 and the wavelength calibration was done inMOLLY.
Additional time-resolved spectroscopy was carried out in March 2004 using MOSCA on the 3.5 m telescope. The data were obtained with the 2 k×4 k pixel2SITe CCD camera. The slit width was fixed to 1and the G–1000 grism was in place. 1 IRAF is distributed by the National Optical Astronomy
704 P. Rodríguez-Gil et al.: The new intermediate polar HS 0943+1404
This setup gave a wavelength range ofλλ4200−7400 at a spec-tral resolution of2.6 Å (FWHM). The data reduction was car-ried out in the same way as described for the time-resolved CAFOS spectroscopy.
Observatorio del Roque de los Muchachos. The Andalucía Faint Object Spectrograph and Camera (ALFOSC) along with the 2048×2048 pixel2EEV chip (CCD #8) were used at the Nordic Optical Telescope (NOT) on La Palma to obtain time-resolved spectroscopy of HS 0943+1404 in December 2003. The combination of grism #7 (plus the second-order blocking filter WG345) and a 1 slit provided a resolution of 3.7 Å (FHWM) and a useful wavelength range ofλλ3800−6800. As the arc lines projected onto more than 4 pixels (FWHM), a 1×2 binning (dispersion direction) was applied. This provided a better signal-to-noise ratio without significantly degrading the spectral resolution. The data reduction was carried out in the same way as explained above.
3. Analysis: photometry
3.1. Long-term variability
From the nightly mean magnitudes presented in Table 1 it is apparent that HS 0943+1404 exhibits pronounced long-term changes in its average brightness. The system was observed at an intermediate magnitude of V 17.6 in mid-December 2002, and in a faint state at V19.0 from late-December 2002 until March 2003. The transition from the intermediate to the low state hence occured in less than two weeks. By the time of our next observations in December 2003, the system was back to a bright state near V 16.3, where it apparently remained until our last observations in March 2004. Similar long-term variability is observed in strongly magnetic, disc-less CVs (po-lars) and VY Scl stars (see e.g. Warner 1999). We will hereafter follow the common terminology for these objects, calling the bright state high state and the faint state low state.
3.2. Short-term variability
In addition to the occurence of high and low states, HS 0943+1404 displays a complex range of short-term varia-tions which we have analysed in detail by computing Scargle periodograms (Scargle 1982) using Schwarzenberg-Czerny’s (1989) implementation in theMIDAScontextTSA. After an ini-tial assessment of the periodograms, we have split the photo-metric data (Table 1) into three separate subsets according to the average brightness of the system, which we discuss below.
3.2.1. December 2002/January 2003 – the low state
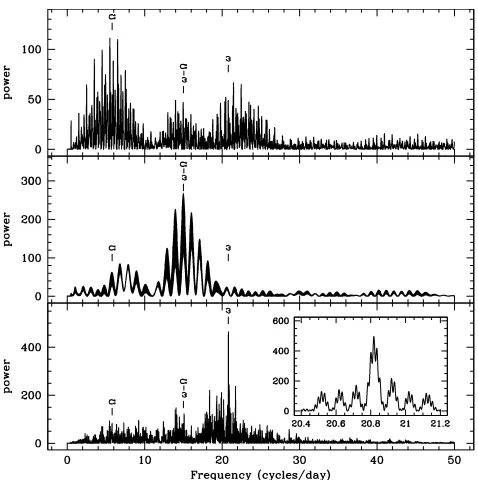
The JKT light curves of HS 0943+1404 obtained during the low state show short-term variability superimposed on a low-amplitude modulation (Fig. 2). The Scargle periodogram (Fig. 3, top panel) shows power in three clusters near∼5 d−1,
[image:5.595.321.563.85.263.2]∼15 d−1, and∼22 d−1. The shortness of the individual low-state observations and their poor sampling result in a substantial
Fig. 2. The low-state photometry obtained with the JKT in December 2002/January 2003 shows evidence of short-lived flares (top), and a low-amplitude, long-period (several hours) modulation superimposed on short-period variability.
Fig. 3. Scargle periodograms computed from three subsets of the CCD photometry listed in Table 1. Top panel: periodogram for the low state data obtained in December 2002/January 2003. Three clusters of sig-nals are evident at∼5 d−1,∼15 d−1, and∼22 d−1. Middle panel: peri-odogram of the December 2003 IAC80 data and the February 2004 Tuorla data. The dominant signal is found at 15 d−1 (plus one-day aliases), and a weaker signal at 6.8 d−1(plus one-day aliases). Bottom panel: periodogram for the January 2004 Tuorla data and the March 2004 campaign. The strongest signal is detected at 20.8 d−1, a second cluster of signals is present near 15 d−1. The inset shows a close-up of the 20.8 d−1signal. We identify the 20.8 d−1frequency with the white dwarf spinω(Pspin = 69.2 min), and the 15 d−1 frequency with the beat between the white dwarf spin and the orbital motionω−Ω, which implies an orbital frequency ofΩ =5.8 d−1(P
orb=248 min).
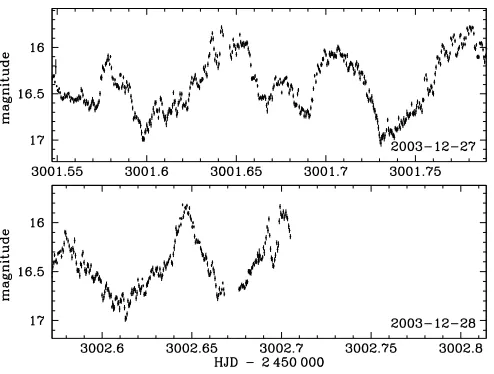
[image:5.595.323.562.327.567.2]Fig. 4. During the two nights of IAC80 observations, HS 0943+1404 displayed a photometric variability with a period of96 min, which we interpret as the beat period.
3.2.2. December 2003 & February 2004 – a 96 min modulation in high state
The light curves obtained during the December 2003 IAC80 (Fig. 4) and the February 2004 Tuorla runs display a large-amplitude (0.5 mag) modulation with a period of 96 min. The Scargle periodogram of these three nights of data (Fig. 3, middle panel) confirms this visual estimate, being dominated by a signal at 15 d−1 (plus one-day aliases thereof). A sec-ond weaker signal is found at 6.8 d−1, also flanked by one-day aliases. Variability on shorter time scales than the dominant 96-min modulation is seen in the light curves, but the periodogram contains no strong signal at higher frequencies.
3.2.3. January & March 2004 campaign – a 69 min modulation in high state
The light curves obtained in January 2004 at the Tuorla Observatory and during the March 2004 multi-site cam-paign carried out at FLWO, Hida Observatory, and Tuorla Observatory are dominated by a coherent signal with a pe-riod of69 min and an amplitude of 0.2−0.3 mag (Fig. 5). The Scargle periodogram of this data set (Fig. 3, bottom panel) is dominated by a sharp signal at 20.8 d−1, and contains some weaker signals in the range 14−15.2 d−1.
3.3. An intermediate polar interpretation
Complex short-term variability characterized by the presence of several coherent signals is the hallmark of IPs, CVs con-taining a moderately magnetic white dwarf with a spin period shorter than the orbital period, Pspin < Porb. The power spec-tra of IPs typically show signals at the orbital frequencyΩ, the white dwarf spin frequencyω, and the beat (i.e. synodic) fre-quencyω−Ω(additional beat signals atω+ Ωorω−2Ωhave been detected in some IPs, e.g. Warner 1986).
Considering the morphology of the observed light curves and the resulting periodograms, we suggest that HS 0943+1404
Fig. 5. Sample light curves obtained at FWLO, Hida Observatory, and Tuorla observatory during the March 2004 campaign. The data show a periodic modulation with a period of69 min, which we identify with the white dwarf spin period.
is an IP. We identify the highly coherent, highest frequency signal detected in the photometry of HS 0943+1404 with the white dwarf spin, the intermediate frequency signal as the beat between white dwarf spin and orbital periods, and the lowest frequency signal with the orbital period. The spin signal in the bottom panel of Fig. 3 shows some alias substructure due to the long gap between the January 2004 and March 2004 data. The frequency of the central peak is 20.8179±0.0003 d−1, with the two flanking aliases located at 20.8011±0.0003 d−1 and 20.8348±0.0003 d−1, where the errors given in brackets have been determined by fitting a sine wave to the data. The beat signal (Fig. 3, middle panel) is also plagued by multiple aliases due to the separation of the December 2003 and February 2004 runs. The strongest signal is found at 15.0±0.2 d−1, where the error in brackets is conservatively estimated from half the
FWHM of the central cluster of aliases.
We conclude that HS 0943+1404 is an IP, and the analysis of our photometric data results in Pspin =69.171±0.001 min,
Pbeat =96.0±3.3 min, and Porb = 247.5±3.3 min. Figure 6 shows the spin and beat-dominated data folded on the spin and beat period, respectively.
4. Analysis: spectroscopy
4.1. The optical spectrum of HS 0943+1404
The spectrum of HS 0943+1404 (Fig. 7) is dominated by strong, single-peaked emission lines of H
and He
. He
line emission atλ4686,5412, and the Bowen blend are also promi-nent, indicating the presence of a source of high-energy pho-tons. The relative strength of these emission lines is reminiscent of the magnetic CVs. The continuum significantly rises blue-wards of Hαand atmospheric features of the secondary star are absent in the observed spectral ranges. [image:6.595.30.277.82.269.2]706 P. Rodríguez-Gil et al.: The new intermediate polar HS 0943+1404
[image:7.595.320.566.83.228.2]Fig. 6. Top panel: the January 2004 and March 2004 data folded on the white dwarf spin period of 69.2 min. Bottom panel: the December 2003 and February 2004 data folded on the beat period of 96 min.
Fig. 7. Top panel: flux calibrated average spectra of HS 0943+1404
taken in different epochs. From bottom to top, 2002 December 15 (Calar Alto 2.2 m), 2003 December 16–17 (NOT), and 2004 March 1–3 (Calar Alto 3.5 m). These spectra nicely illustrate the rather frequent brightness changes of HS 0943+0414. Bottom panel: enlarged version of the lower spectrum shown in the top panel (2002 December). The system was in an intermediate state near V= 17.6 mag. No spectroscopic signature of the donor star is evident in the red part of the spectrum.
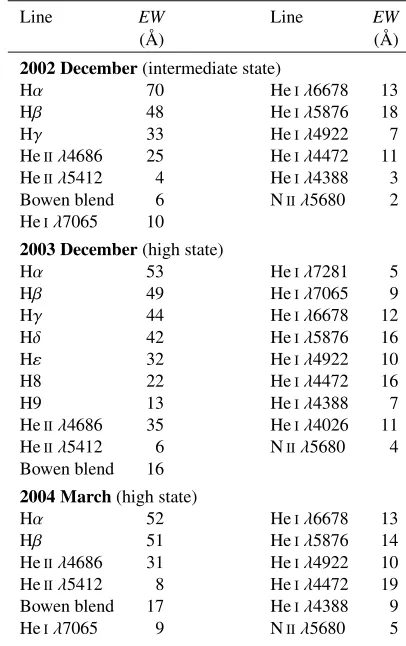
[image:7.595.338.541.305.628.2](e.g.λ5018, 5169), NIIλ5680, SiIIλ6347,6372, and probably AlIIλ6243 (see theλλ4900–6500 range of the 2003 December NOT average spectrum; Fig. 8). A closer inspection reveals that the spectrum of HS 0943+1404 shows abundant weak emission lines throughout. In Table 3 we present the equivalent widths (EWs) of the most prominent lines as measured in the average spectra corresponding to the three different epochs.
Fig. 8. Average spectrum of HS 0943+1404 (2003 December,
NOT) showing a number of unusual emission lines in the range
[image:7.595.61.306.316.557.2]λλ4900−6500. Note the strong NIIλ5680 and SiIIλ6347 andλ6371.
Table 3. Line equivalent widths measured from the average spectra.
Line EW Line EW
(Å) (Å)
2002 December (intermediate state)
Hα 70 HeIλ6678 13
Hβ 48 HeIλ5876 18
Hγ 33 HeIλ4922 7
HeIIλ4686 25 HeIλ4472 11
HeIIλ5412 4 HeIλ4388 3
Bowen blend 6 NIIλ5680 2
HeIλ7065 10 2003 December (high state)
Hα 53 HeIλ7281 5
Hβ 49 HeIλ7065 9
Hγ 44 HeIλ6678 12
Hδ 42 HeIλ5876 16
Hε 32 HeIλ4922 10
H8 22 HeIλ4472 16
H9 13 HeIλ4388 7
HeIIλ4686 35 HeIλ4026 11
HeIIλ5412 6 NIIλ5680 4
Bowen blend 16
2004 March (high state)
Hα 52 HeIλ6678 13
Hβ 51 HeIλ5876 14
HeIIλ4686 31 HeIλ4922 10
HeIIλ5412 8 HeIλ4472 19
Bowen blend 17 HeIλ4388 9
HeIλ7065 9 NIIλ5680 5
4.2. Radial velocity variations
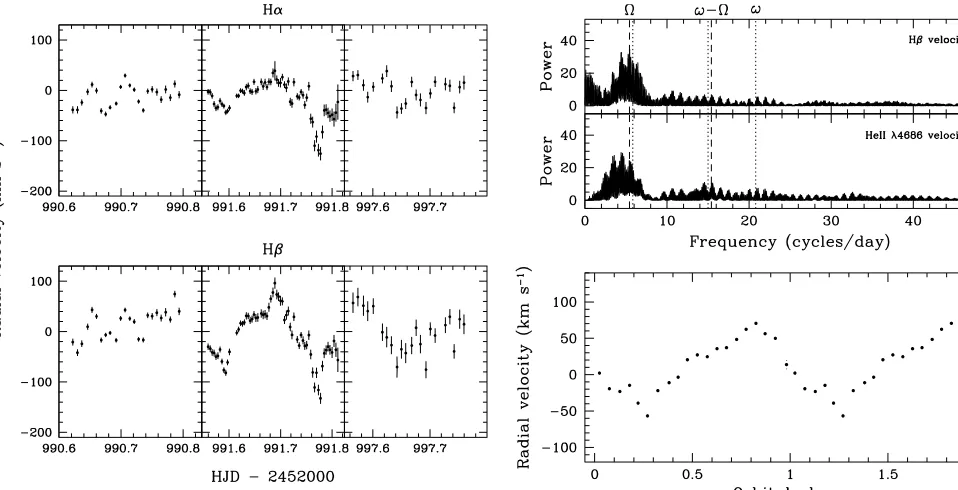
Fig. 9. Hα(top) and Hβ(bottom) radial velocity curves. From left to right: 2003 December 16, 17, and 23.
profile). The latter method proved to be the most efficient, pro-ducing the cleanest radial velocity curves. The resulting curves for Hαand Hβare shown in Fig. 9.
The morphology of the radial velocity curves seems to sig-nificantly change from night to night. On 2003 December 16, a modulation at ∼70 min dominates, whereas a longer time scale modulation is clearly seen on 2003 December 17. On this night, a dip towards blue velocities at HJD2 452 991.77 is observed. A shallower excursion to the blue also occurs at HJD 2 452 991.59. The separation between them was mea-sured by fitting Gaussians to the dips, obtaining a value of
0.19 d. In addition, the Hβcurve displays a red spike centred at2452991.69, almost just in the middle of the blue dips. A sine fit to the Hβradial velocity curve (after masking the dips) yields a period of0.19 d and a semi-amplitude of∼45 km s−1. In order to search for periodicities we computed Scargle periodograms (Scargle 1982) for all the Hα, Hβ, HeIλ5876, and HeIIλ4686 radial velocity curves. The periodograms for all the lines are very similar, and we present in Fig. 10 only the periodograms for Hβand HeIIλ4686. Both periodograms are dominated by clusters of aliases near3.4, 4.4, and 5.4 d−1. The poor sampling of our radial velocities spread out over 15 months causes severe fine-structure in the main alias clus-ters, and impedes an unequivocal identification of the fre-quency inherent to the system. Formally, the strongest signal in the Hβradial velocity variation is found at 5.430±0.002 d−1 (the quoted error is a conservative estimate from the width of the peak in the periodogram), which corresponds to a pe-riod of P = 0.18416±0.00007 d (= 265.2 ±0.1 min). In the case of HeII λ4686, a value of 4.412±0.005 d−1 (P = 0.2267±0.0003 d = 325.8 ±0.4 min) is found. The pres-ence of power around 250 min in both the low-state photometry (Fig. 3, top panel) and in the radial velocity variations (Fig. 10) strongly suggests the detection of a “clock” in HS 0943+1404.
Fig. 10. Top: scargle periodograms of the Hβand HeII λ4686
ra-dial velocity curves. Ωis the orbital frequency, ω the white dwarf spin, andω−Ωthe corresponding synodic frequency. Dashed (dot-ted) vertical lines correspond to spectroscopic (photometric) results. Bottom: Hβradial velocity curve folded on 265.2 min after averag-ing the data into 20 phase bins. The time of red-to-blue crossaverag-ing is T0=2 452 623.78160 (HJD). The orbital cycle has been plotted twice for continuity.
Given that this is the longest period detected in all our data we believe that it represents the orbital motion of the binary.
The Hβradial velocities folded on 265.2 min, the strongest signal in the Hβ periodogram, displays a relatively low-amplitude modulation superimposed by a short (∼0.15 orbital phase) negative excursion, which is mostly related to the two “dips” seen in the December 17 NOT data.
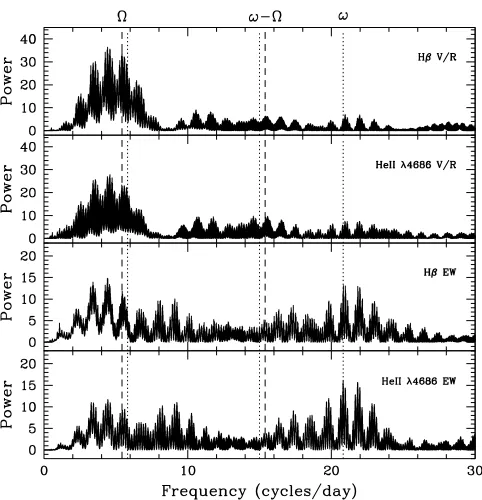
4.3. V/R ratios and equivalent width curves
Our second approach at searching for periodicities involved the analysis of the Hα, Hβ, HeIλ5876 and HeIIλ4686 V/R-ratio and EW curves. The V/R ratio is computed by dividing the EW
of the blue half of the line profile (up to zero velocity, i.e. the
[image:8.595.33.512.84.329.2]708 P. Rodríguez-Gil et al.: The new intermediate polar HS 0943+1404
Fig. 11. Scargle periodograms of the Hβand HeIIλ4686 V/R and
EW curves. Dashed (dotted) vertical lines correspond to spectroscopic (photometric) results.
5. Discussion
5.1. The intermediate polar nature of HS 0943+1404
The combined photometric and spectroscopic results clearly qualify HS 0943+1404 as an asynchronous magnetic CV, an IP. The system has a likely orbital period of Porb 250 min and a white dwarf spin period of Pspin = 69.171±0.001 s. The radial velocity analysis of our spectroscopy suggests
Porb = 265.2 min, while the more extensive photometry sug-gests Porb =247.5 min from the detection of the beat and spin periods.
The combination of orbital and spin periods found in HS 0943+1404 is rather unusual, as it yields a large
Pspin/Porb 0.3 and a long orbital period. The only other known IPs with even larger Pspin/Porb are EX Hya (Vogt et al. 1980), V1025 Cen (Buckley et al. 1998), and DW Cnc (Rodríguez-Gil et al. 2004a), all three are short-period sys-tems below the period gap. The majority of IPs are concen-trated near Pspin/Porb 0.1 (see e.g. Barrett et al. 1988; King & Lasota 1991; Warner & Wickramasinghe 1991), but King & Wynn (1999) showed that spin-orbit equilibria exist with
Pspin/Porb > 0.1, explaining cases such as EX Hya. Most re-cently, Norton et al. (2004) demonstrated that a large range of permitted spin-orbit equilibria exists in the (Pspin/Porb,µ1) pa-rameter space, withµ1the magnetic moment of the white dwarf primary star. We used their Fig. 2 to estimate a magnetic mo-ment ofµ1 ∼ 1034G cm3 for HS 0943+1404. This value is in the typical range found for polars, and assuming an average white dwarf (Mwd 0.65 M, Rwd 108cm) would result in a magnetic dipole field strength of∼20 MG. Hence, it appears entirely possible that HS 0943+1404 is a true “intermediate” polar, that will synchronise once its orbital period and mass
transfer rate decrease sufficiently – in fact, for the parameters determined here, HS 0943+1404 lies above the synchronisation line in Fig. 4 of Norton et al. (2004).
Another property that HS 0943+1404 shares with polars is the occurence of deep (3 mag) low states, such as the one ob-served in January 2003 (Table 1). Such low states are character-istic of polars, only one long-period IP is known to have entered a deep low state (see e.g. Warner 1999).
5.2. Spin-beat period switching
Our photometric data show that HS 0943+1404 switches be-tween states which are either dominated by variability at the white dwarf spin period, or by variability at the beat period. Changes in the relative power of the spin signal with respect to the side-band signals have been observed in other IPs, such as TX Col (Buckley & Tuohy 1989; Norton et al. 1997), and in V1062 Tau, where at a given time only the spin or the beat period is detected (Lipkin et al. 2004). In V1062 Tau, Lipkin et al. (2004) suggested that the switching between spin- and beat-dominated variability is triggered by changes in the sys-tem brightness which they relate to changes in the mass transfer rate.
A dominating signal at the beat period has been interpreted as a sign of disc-less accretion (e.g. Buckley et al. 1995; Hellier 2002, and references therein). Spin-dominated variability is generally explained by disc-fed accretion. The variations are thought to arise from reprocessing of X-rays at either the in-ner edge or the outer rim of the magnetically-truncated disc (Warner 1986), or from aspect variations of the accretion fun-nel feeding material from the inner disc edge onto the white dwarf (see e.g. Hellier et al. 1987).
The alternating dominance of the spin and beat signals in the light curves of HS 0943+1404 clearly implies changes in the accretion mode. However, in this system, both states have been observed at similar mean brightness levels (Table 1, Figs. 4 and 5). The fact that the spectrum of the secondary star is not detected even when the system is faint (although no spec-trum in low state is available; see Fig. 7) indicates that the ac-cretion disc must dominate the observed continuum. Hence, a predominant signal at the beat period cannot be unambiguously linked to disc-less accretion. All of this suggests that changes in the accretion mode are not solely due to variations in the mass transfer rate, but can also be triggered by other mechanisms within the binary system (Norton et al. 1997).
5.3. An elevated nitrogen abundance
companion has accreted material from the shell associated with a nova explosion on the white dwarf, or the secondary star is evolved (and the white dwarf is accreting material from the ex-posed CNO core whose outer layers were stripped offduring a thermal time-scale mass-transfer phase, see Schenker et al. 2002; Podsiadlowski et al. 2003). Based on a HST FUV sur-vey of cataclysmic variables, Gänsicke et al. (2003) have re-cently shown that 10%–15% of all CVs display enhanced ni-trogen abundances. This is in agreement with the predictions by Schenker et al. (2002) and Podsiadlowski et al. (2003) that a non-negligible fraction of all CVs should have evolved through a phase of thermal time scale mass transfer.
6. Conclusions
The results presented in this paper are summarised as follows: 1. Based on our photometric and spectroscopic observations,
we have shown that HS 0943+1404 is a new intermediate polar CV with an orbital period of Porb 250 min and a white dwarf spin period of Pspin=69.171±0.001 s. An ad-ditional confirmation of the spin period, e.g. through the de-tection of a coherent variablity in X-rays or polarised light would be desirable.
2. Based on Norton et al.’s (2004) calculations, we estimate the magnetic moment of the white dwarf in HS 0943+1404 to be µ1 ∼ 1034G cm3, which is in the range of polars. Long-term photometric monitoring of the system revealed the occurrence of deep low states, during which the bright-ness drops by ∼3 mag, also typical of polars. It appears likely that HS 0943+1404 is a true “intermediate” polar on its way to synchronization.
3. The optical spectrum of HS 0943+1404 contains a num-ber of unusual emission lines, most noticeably NIIλ5680, which suggests the presence of CNO-enriched material in the envelope of the secondary star. Ultraviolet spectroscopy of HS 0943+1404 would be useful to assess the carbon and nitrogen abundances from the NVλ1240 and CIVλ1550 resonance lines.
Acknowledgements. We wish to thank the anonymous referee for his/her contribution to the paper. We are grateful to Sergio Fernández for carrying out some of the IAC80 telescope observa-tions. PRG and BTG thank PPARC for support through a PDRA and an AF, respectively. The HQS was supported by the Deutsche Forschungsgemeinschaft through grants Re 353/11 and Re 353/22. This work was supported in part by NASA grant NAG5-9930. The use of theMOLLYpackage developed and maintained by Tom Marsh is acknowledged.
References
Andronov, N., Pinsonneault, M., & Sills, A. 2003, ApJ, 582, 358 Araujo-Betancor, S., Gänsicke, B. T., Hagen, H.-J., et al. 2005, A&A,
430, 629
Araujo-Betancor, S., Gänsicke, B. T., Hagen, H.-J., Rodríguez-Gil, P., & Engels, D. 2003, A&A, 406, 213
Barrett, P., O’Donoghue, D., & Warner, B. 1988, MNRAS, 233, 759 Bertin, E., & Arnouts, S. 1996, A&AS, 117, 393
Buckley, D. A. H., Cropper, M., Ramsay, G., & Wickramasinghe, D. T. 1998, MNRAS, 299, 83
Buckley, D. A. H., Sekiguchi, K., Motch, C., et al. 1995, MNRAS, 275, 1028
Buckley, D. A. H., & Tuohy, I. R. 1989, ApJ, 344, 376
Gänsicke, B. T. 2004, in Compact Binaries in the Galaxy and Beyond, ed. G. Tovmassian, & E. Sion, Conf. Ser. 20, Rev. Mex. Astron. Astrofís., 152
Gänsicke, B. T., Araujo-Betancor, S., Hagen, H.-J., et al. 2004, A&A, 418, 265
Gänsicke, B. T., Szkody, P., de Martino, D., et al. 2003, ApJ, 594, 443 Gänsicke, B. T., Fried, R. E., Hagen, H.-J., et al. 2000, A&A, 356, L79 Gänsicke, B. T., Beuermann, K., & Reinsch, K., ed. 2002a, The Physics of Cataclysmic Variables and Related Objects, ASP Conf. Ser., 261
Gänsicke, B. T., Hagen, H. J., & Engels, D. 2002b, in The Physics of Cataclysmic Variables and Related Objects, ed. B. T. Gänsicke, K. Beuermann, & K. Reinsch, ASP Conf. Ser., 261, 190
Hagen, H. J., Groote, D., Engels, D., & Reimers, D. 1995, A&AS, 111, 195
Hellier, C. 2002, in The Physics of Cataclysmic Variables and Related Objects, ed. B. T. Gänsicke, K. Beuermann, & K. Reinsch, ASP Conf. Ser., 261, 92
Hellier, C., Mason, K. O., Rosen, S. R., & Cordova, F. A. 1987, MNRAS, 228, 463
Horne, K. 1986, PASP, 98, 609
Howell, S. B., Rappaport, S., & Politano, M. 1997, MNRAS, 287, 929 Jiang, X. J., Engels, D., Wei, J. Y., Tesch, F., & Hu, J. Y. 2000, A&A,
362, 263
King, A. R. 1988, QJRAS, 29, 1
King, A. R., & Lasota, J. P. 1991, ApJ, 378, 674
King, A. R., & Schenker, K. 2002, in The Physics of Cataclysmic Variables and Related Objects, ed. B. T. Gänsicke, K. Beuermann, & K. Reinsch, ASP Conf. Ser., 261, 233
King, A. R., & Wynn, G. A. 1999, MNRAS, 310, 203 Kolb, U. 1993, A&A, 271, 149
Kolb, U., & Baraffe, I. 1999, MNRAS, 309, 1034
Lipkin, Y. M., Leibowitz, E. M., & Orio, M. 2004, MNRAS, 349, 1323 Norton, A. J., Hellier, C., Beardmore, A. P., et al. 1997, MNRAS, 289,
362
Norton, A. J., Wynn, G. A., & Somerscales, R. V. 2004, ApJ, 614, 349 Podsiadlowski, P., Han, Z., & Rappaport, S. 2003, MNRAS, 340, 1214 Reimers, D., & Hagen, H. J. 2000, A&A, 358, L45
Reimers, D., Hagen, H. J., & Hopp, U. 1999, A&A, 343, 157 Rodríguez-Gil, P., Gänsicke, B. T., Araujo-Betancor, S., & Casares, J.
2004a, MNRAS, 349, 367
Rodríguez-Gil, P., Gänsicke, B. T., Barwig, H., Hagen, H.-J., & Engels, D. 2004b, A&A, 424, 647
Scargle, J. D. 1982, ApJ, 263, 835
Schenker, K., & King, A. R. 2002, in The Physics of Cataclysmic Variables and Related Objects, ed. B. T. Gänsicke, K. Beuermann, & K. Reinsch, ASP Conf. Ser., 261, 242
Schenker, K., King, A. R., Kolb, U., Wynn, G. A., & Zhang, Z. 2002, MNRAS, 337, 1105
Schneider, D. P., & Young, P. 1980, ApJ, 238, 946 Schwarzenberg-Czerny, A. 1989, MNRAS, 241, 153 Thorstensen, J. R., & Fenton, W. H. 2002, PASP, 114, 74 Vogt, N., Krzeminski, W., & Sterken, C. 1980, A&A, 85, 106 Warner, B. 1986, MNRAS, 219, 347