A quest for a better simulation based knowledge elicitation tool
308
0
0
Full text
(2) CONTENTS CONTENTS..................................................................................................................... I LIST OF ILLUSTRATIONS ................................................................................... VIII LIST OF TABLES ....................................................................................................... XI ACKNOWLEDGEMENTS.......................................................................................XIV ABSTRACT ................................................................................................................XVI LIST OF ABBREVIATIONS ................................................................................. XVII 1. 2. INTRODUCTION ...................................................................................................1 1.1. BACKGROUND ....................................................................................................1. 1.2. AN OUTLINE OF THE THESIS ................................................................................3. KNOWLEDGE-BASED SYSTEMS AND KNOWLEDGE ELICITATION....5 2.1. KNOWLEDGE-BASED SYSTEMS ............................................................................5. 2.2. KNOWLEDGE-BASED SYSTEMS TERMINOLOGY ....................................................7. 2.3. KNOWLEDGE-BASED SYSTEMS DEVELOPMENT LIFE-CYCLE ................................9. 2.3.1 Systems development life-cycle ....................................................................10 2.3.2 A basic model of knowledge-based systems development life-cycle............13 2.3.3 Potential problems in developing a knowledge-based system.....................16 2.4. KNOWLEDGE ELICITATION TECHNIQUES ...........................................................19. 2.4.1 Knowledge categorisation ...........................................................................19.
(3) Contents. ii. 2.4.2 Manual knowledge elicitation techniques....................................................20 2.4.3 Semi-automatic knowledge elicitation techniques .......................................31 2.4.4 Automatic knowledge elicitation techniques................................................35 2.4.5 A summary of knowledge elicitation techniques..........................................39 2.5 3. CONCLUSION ....................................................................................................45. VISUAL INTERACTIVE SIMULATION, VIRTUAL REALITY AND. KNOWLEDGE ELICITATION .................................................................................47 3.1. VISUAL INTERACTIVE (DISCRETE-EVENT) SIMULATION .....................................48. 3.2. VIRTUAL REALITY SYSTEMS .............................................................................50. 3.3. WORKING RELATIONSHIP BETWEEN AI/KBS AND SIMULATION ........................51. 3.4. EVIDENCE OF SIMULATION AS A KNOWLEDGE ELICITATION TOOL .....................53. 3.4.1 Evidence from using simulation for applications of AI ...............................53 3.4.2 Evidence from AI-based simulation .............................................................56 3.4.3 A retrospection of evidence..........................................................................58 3.5 4. CONCLUSION ....................................................................................................58. RESEARCH PROPOSITIONS, HYPOTHESES AND METHODOLOGY...60 4.1. COMPOSITION OF AN EXAMPLE CASE ................................................................61. 4.2. CONSTRUCTS FOR ASSESSING ‘ELICITATION IMPROVEMENT’ ............................61. 4.2.1 Construct One: Decision fidelity .................................................................61 4.2.2 Construct Two: State space .........................................................................62 4.2.3 Construct Three: Case quantity ...................................................................62 4.2.4 Construct Four: Collection rate ..................................................................63 4.3. FACTORS FOR IMPROVING VIS AS A KNOWLEDGE ELICITATION TOOL ...............63. 4.3.1 Factor One: Visual representation ..............................................................64.
(4) Contents. iii. 4.3.2 Factor Two: Model parameters ...................................................................70 4.4. HYPOTHESES FRAMED FOR INVESTIGATING PROPOSITIONS ...............................73. 4.4.1 Hypotheses related to visual representation dimension (Factor One) ........73 4.4.2 Hypotheses related to model parameters (Factor Two) ..............................75. 5. 4.5. METHODOLOGY USED FOR TESTING HYPOTHESES .............................................77. 4.6. CONCLUSION ....................................................................................................82. A CASE STUDY: FORD PUMA DIESEL ENGINE HOT-TEST. OPERATIONS ..............................................................................................................84 5.1. DISCOVERING THE HOT-TEST OPERATIONS ........................................................85. 5.2. FINDING ONE: PHYSICAL AND LOGICAL LAYOUT OF THE HOT-TEST OPERATIONS.. .........................................................................................................................87. 5.3. FINDING TWO: DECISIONAL ROLES OF THE HOT-TEST SWITCH OPERATORS (THE. EXPERTS)......................................................................................................................91. 5.4. FINDING THREE: MAKE-UP OF THE EXPERTS’ DECISION-MAKING PROCESS .......93. 5.4.1 Switching operations in a standard scene ...................................................95 5.4.2 Switching operations in a non-standard scene ............................................97. 6. 7. 5.5. PROFILES OF THE PARTICIPATING EXPERTS .......................................................99. 5.6. CONCLUSION ..................................................................................................102. EXPERIMENTAL DESIGN ..............................................................................103 6.1. REPEATED MEASURES EXPERIMENTAL DESIGN ...............................................104. 6.2. VISUAL INTERACTIVE SIMULATION IN GAMING MODE .....................................105. 6.3. MITIGATING MEASURES TO IMPROVE THE QUASI-EXPERIMENTAL DESIGN ......107. 6.4. CONCLUSION ..................................................................................................110. VISUAL INTERACTIVE SIMULATION GAME MODEL ..........................111.
(5) Contents. 7.1. iv. GAME MODEL CONSTRUCTION ........................................................................113. 7.1.1 Adaptations made to improve the base model’s utility ..............................113 7.1.2 Adaptations made to improve the base model’s logic ...............................114 7.1.3 Adaptations made to operationalise the game model ................................115 7.1.4 Adaptations made for the experimental conditions ...................................117 7.2. GAME MODEL ASSESSMENT ............................................................................126. 7.2.1 Assessment for model face validity ............................................................127 7.2.2 Assessment for model usability ..................................................................128 7.2.3 Outcome of assessments.............................................................................129 7.3. A CATALOGUE OF GAME MODEL SCREENSHOTS ..............................................130. 7.3.1 Screenshots from a 2D game model...........................................................131 7.3.2 Screenshots from a 2½D game model........................................................133 7.3.3 Screenshots from a 3D game model...........................................................135 7.4 8. CONCLUSION ..................................................................................................138. MEASURES FOR EVALUATING ELICITATION EFFECTIVENESS AND. EFFICIENCY..............................................................................................................140 8.1. MEASURE FOR EVALUATING DECISION FIDELITY (CONSTRUCT ONE)..............141. 8.2. MEASURE FOR EVALUATING STATE SPACE (CONSTRUCT TWO).......................143. 8.2.1 Descriptive statistics ..................................................................................144 8.2.2 Measure of dispersion for univariate data: Standard deviation................145 8.2.3 Measure of dispersion for bivariate data: Standard distance – A background ............................................................................................................146 8.2.4 Measure of dispersion for multivariate data: Standard distance* – A proof .. ....................................................................................................................149 8.2.5 Distance measure for mixed data: General distance coefficient ...............154.
(6) Contents. v. 8.2.6 Standard distance* for mixed multivariate data........................................156. 9. 8.3. MEASURE FOR EVALUATING CASE QUANTITY (CONSTRUCT THREE)...............157. 8.4. MEASURE FOR EVALUATING COLLECTION RATE (CONSTRUCT FOUR) .............158. 8.5. CONCLUSION ..................................................................................................158. DATA COLLECTION AND ANALYSIS (HYPOTHESIS ONE) ................160 9.1. THE EXPERIMENT ............................................................................................160. 9.1.1 Standard procedures..................................................................................161 9.1.2 Let the games begin! ..................................................................................163 9.2. ANALYSIS FOR HYPOTHESIS ONE: DECISION FIDELITY & VISUAL. REPRESENTATION DIMENSION .....................................................................................165. 9.2.1 Data exploration ........................................................................................169 9.2.2 Hypothesis testing ......................................................................................171 9.2.3 Summary ....................................................................................................173 9.3. CONCLUSION ..................................................................................................174. 10 DATA ANALYSIS (HYPOTHESIS TWO TO SIX)........................................176 10.1. AN OVERVIEW OF THE ANALYTICAL FRAMEWORK ..........................................176. 10.2. ANALYSIS FOR HYPOTHESIS FOUR: STATE SPACE & MODEL PARAMETERS .....178. 10.2.1. Data preparation....................................................................................179. 10.2.2. State space measure computation ..........................................................184. 10.2.3. Data exploration ....................................................................................186. 10.2.4. Hypothesis testing ..................................................................................189. 10.2.5. Summary.................................................................................................196. 10.3. ANALYSIS FOR HYPOTHESIS TWO: CASE QUANTITY & VISUAL REPRESENTATION. DIMENSION, AND HYPOTHESIS FIVE: CASE QUANTITY & MODEL PARAMETERS ..........197.
(7) Contents. vi. 10.3.1. Data exploration ....................................................................................198. 10.3.2. Hypothesis testing ..................................................................................200. 10.3.3. Summary.................................................................................................212. 10.4. ANALYSIS FOR HYPOTHESIS THREE: COLLECTION RATE & VISUAL. REPRESENTATION DIMENSION, AND HYPOTHESIS SIX: COLLECTION RATE & MODEL PARAMETERS ..............................................................................................................213. 10.4.1. Data exploration ....................................................................................214. 10.4.2. Hypothesis testing ..................................................................................217. 10.4.3. Summary.................................................................................................229. 10.5. CONCLUSION ..................................................................................................230. 11 CONCLUSION ....................................................................................................232 11.1. FINDINGS FROM THE RESEARCH ......................................................................232. 11.1.1. Research propositions, hypotheses and findings for the visual. representation dimension factor............................................................................233 11.1.2. Research propositions, hypotheses and findings for the model parameters. factor. ................................................................................................................239. 11.2. CONTRIBUTIONS OF THE RESEARCH ................................................................242. 11.3. LIMITATIONS OF THE RESEARCH .....................................................................244. 11.4. SUGGESTIONS FOR FUTURE RESEARCH ............................................................247. REFERENCES............................................................................................................252 APPENDICES .............................................................................................................270 A. PRE-EXPERIMENT QUESTIONNAIRE........................................................270 A.1. ABOUT YOURSELF ...........................................................................................270.
(8) Contents. A.2. vii. LEARNING STYLE ............................................................................................271. B. A COMPREHENSIVE OVERVIEW OF THE EXAMPLE CASE ...............272. C. A FRAMEWORK FOR DATA ANALYSIS ....................................................274. D. E. C.1. AN OVERVIEW OF THE PARAMETRIC ANALYTICAL FRAMEWORK .....................275. C.2. TEST OF NORMALITY .......................................................................................279. C.3. TEST OF SPHERICITY .......................................................................................281. C.4. TEST OF MAIN AND INTERACTION EFFECTS......................................................282. C.5. POST-HOC TEST ...............................................................................................284. C.6. EFFECT SIZE ....................................................................................................285. SPSS ‘FREQUENCIES’ OUTPUT....................................................................286 D.1. SPSS ‘FREQUENCIES’ OUTPUT FOR TRANSFORMED CASE QUANTITY ..............286. D.2. SPSS ‘FREQUENCIES’ OUTPUT FOR TRANSFORMED COLLECTION RATE ...........286. SPSS ‘TESTS OF WITHIN-SUBJECTS CONTRASTS’ OUTPUT..............287 E.1. SPSS ‘TESTS OF WITHIN-SUBJECTS CONTRASTS’ OUTPUT FOR STANDARD. DISTANCE ...................................................................................................................287. E.2. SPSS ‘TESTS OF WITHIN-SUBJECTS CONTRASTS’ OUTPUT FOR TRANSFORMED. CASE QUANTITY ..........................................................................................................288. E.3. SPSS ‘TESTS OF WITHIN-SUBJECTS CONTRASTS’ OUTPUT FOR TRANSFORMED. COLLECTION RATE ......................................................................................................289.
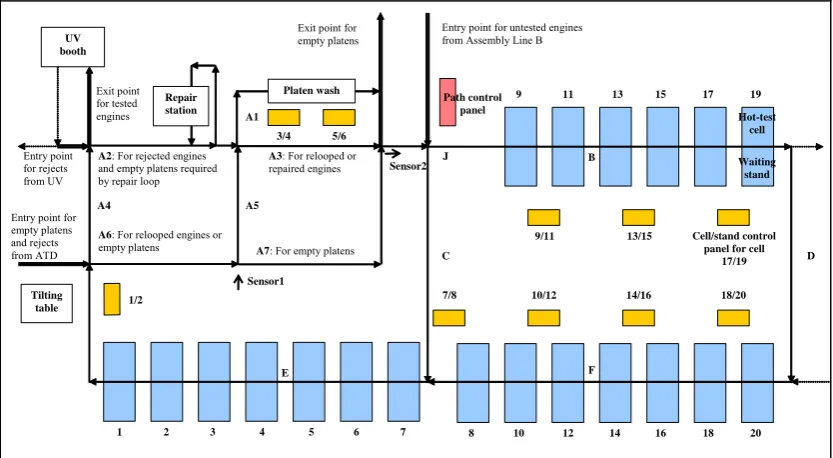
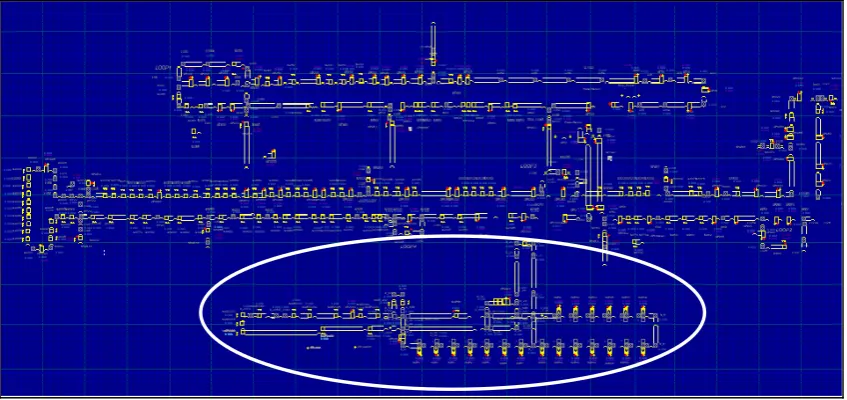
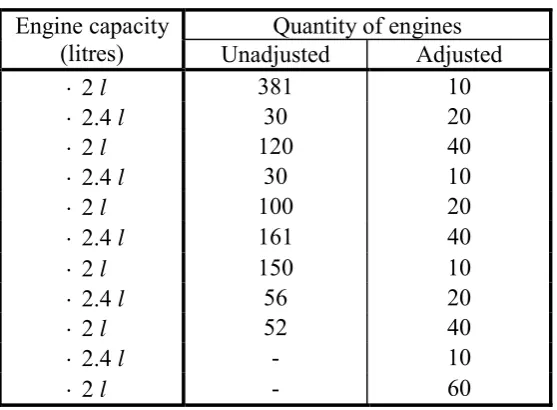
(9) LIST OF ILLUSTRATIONS Figure 2.1: A simplified waterfall model of SDLC (Royce, 1970)................................12 Figure 2.2: A suggested knowledge-based systems development life-cycle model ......15 Figure 3.1: A taxonomy for combining knowledge-based systems (KBS) and simulation (S) (O’Keefe, 1986)...............................................................................54 Figure 4.1: A framework depicting the research methodology......................................80 Figure 5.1: A schema of the hot-test operations.............................................................88 Figure 5.2: A platen (left) and a platen loaded with an engine (right)...........................89 Figure 5.3: A tested engine prepares to exit cell 13, whilst an adjacent untested engine waits to enter it ........................................................................................................90 Figure 5.4: A snapshot of a standard scene....................................................................96 Figure 5.5: A snapshot of a non-standard scene.............................................................98 Figure 7.1: The original 2D-VIS model provided by Ford that spans the entire Puma diesel engine assembly line. The hot-test and ATD operations (Model B) are as circled. ...................................................................................................................112 Figure 7.2: The control bar used to facilitate the experts’ interventions and interactions ...............................................................................................................................116 Figure 7.3: (Clockwise, from top-right) The 2D, 2½D and 3D icons used in the game model to represent a hot-test cell, its adjacent waiting stand and a small section of conveyor ................................................................................................................119 Figure 7.4: Distributions of inter-arrival times (simulated minutes) between untested engines used in the unadjusted model parameters.................................................124.
(10) List of Illustrations. ix. Figure 7.5: Distributions of inter-arrival times (simulated minutes) between untested engines used in the adjusted model parameters.....................................................124 Figure 7.6: The original control bar set against a 2D game model ..............................130 Figure 7.7: Screenshot 1 from the 2D model ...............................................................131 Figure 7.8: Screenshot 2 from the 2D model ...............................................................132 Figure 7.9: Screenshot 3 from the 2D model ...............................................................132 Figure 7.10: Screenshot 1 from the 2½D model ..........................................................133 Figure 7.11: Screenshot 2 from the 2½D model ..........................................................134 Figure 7.12: Screenshot 3 from the 2½D model ..........................................................134 Figure 7.13: Screenshot 1 from the 3D model .............................................................135 Figure 7.14: Screenshot 2 from the 3D model .............................................................136 Figure 7.15: Screenshot 3 from the 3D model .............................................................136 Figure 7.16: Screenshot 4 from the 3D model .............................................................137 Figure 7.17: Screenshot 5 from the 3D model .............................................................137 Figure 7.18: Screenshot 6 from the 3D model .............................................................138 Figure 8.1: The four zones in the hot-test operations where decisions are made ........143 Figure 9.1: The four zones in the hot-test operations where decisions are made ........166 Figure 9.2: A comparison of proportions of switches turned by Subject A, B, C, G and H ............................................................................................................................170 Figure 10.1: An example of the Andrews plots drawn for Subject B (2D representation with adjusted parameters)......................................................................................183 Figure 10.2: Hypothesis 4 – A comparison of standard distances under different visual representation dimensions .....................................................................................187 Figure 10.3: Hypothesis 4 – A comparison of standard distances under different model parameters..............................................................................................................188.
(11) List of Illustrations. x. Figure 10.4: Hypothesis 4 – A summary of histograms generated for the standard distances ................................................................................................................190 Figure 10.5: Hypothesis 2 and 5 – A comparison of case quantities under different visual representation dimensions...........................................................................199 Figure 10.6: Hypothesis 2 and 5 – A comparison of case quantities under different model parameters...................................................................................................200 Figure 10.7: Hypothesis 2 and 5 – A summary of histograms generated for the case quantities ...............................................................................................................201 Figure 10.8: Hypothesis 2 and 5 – A summary of histograms generated for the transformed case quantities ...................................................................................205 Figure 10.9: Hypothesis 3 and 6 – A comparison of collection rates under different visual representation dimensions...........................................................................216 Figure 10.10: Hypothesis 3 and 6 – A comparison of collection rates under different model parameters...................................................................................................217 Figure 10.11: Hypothesis 3 and 6 – A summary of histograms generated for the collection rates.......................................................................................................218 Figure 10.12: Hypothesis 3 and 6 – A summary of histograms generated for the transformed collection rates ..................................................................................222 Figure C.1: The analytical framework for testing the hypotheses in this research......276.
(12) LIST OF TABLES Table 2.1: Knowledge acquisition activities and their corresponding SDLC phases.....13 Table 2.2: A summary of manual knowledge elicitation techniques .............................42 Table 2.3: A summary of semi-automatic knowledge elicitation techniques ................43 Table 2.4: A summary of automatic knowledge elicitation techniques .........................44 Table 4.1: Postulated cause and effect relationships ......................................................83 Table 5.1: Mintzberg’s ten management roles (Boddy, 2005).......................................92 Table 5.2: A summary of decision and attribute variables used in engine assignment..95 Table 5.3: A summary of the experts’ profiles.............................................................100 Table 6.1: The actual knowledge elicitation timeline for the experiment....................108 Table 7.1: Distributions of untested engines entering into the hot-test operations used in the unadjusted and adjusted model parameters .....................................................125 Table 7.2: A summary of engine defective rate and hot-test cell breakdown rate used in the unadjusted and adjusted model parameters .....................................................126 Table 9.1: A summary of collection times ...................................................................163 Table 9.2: The actual knowledge elicitation timeline for the experiment....................165 Table 9.3: A summary of total time spent to shadow Subject A, B, C, G and H .........168 Table 9.4: A summary of quantities of switches turned by Subject A .........................168 Table 9.5: A summary of quantities of switches turned by Subject B .........................168 Table 9.6: A summary of quantities of switches turned by Subject C .........................169 Table 9.7: A summary of quantities of switches turned by Subject G .........................169 Table 9.8: A summary of quantities of switches turned by Subject H .........................169 Table 9.9: A summary of χ 2 test statistics..................................................................172.
(13) List of Tables. xii. ⎞ ⎛ n n Table 10.1: A summary of computed SSD values ⎜⎜ ∑∑∑ d ijk2* ⎟⎟ ..............................185 ⎠ ⎝ i =1 j =1 k. Table 10.2: A summary of case quantities (n ) .............................................................185. ( ). Table 10.3: A summary of standard distances sd* .....................................................186 Table 10.4: Some descriptive statistics for the standard distances...............................186 Table 10.5: Hypothesis 4 – A summary of results from the Kolmogorov-Smirnov and Anderson-Darling tests performed on the standard distances ...............................191 Table 10.6: Hypothesis 4 – A summary of results from the skewness tests performed on the standard distances ............................................................................................191 Table 10.7: Hypothesis 4 – A summary of results from the Mauchly’s tests performed on the relevant differences.....................................................................................193 Table 10.8: Hypothesis 2 – A summary of results from the two-way repeated measures ANOVA performed on the standard distances......................................................194 Table 10.9: Some descriptive statistics for the case quantities ....................................198 Table 10.10: Hypothesis 2 and 5 – A summary of results from the KolmogorovSmirnov and Anderson-Darling tests performed on the case quantities ...............202 Table 10.11: Hypothesis 2 and 5 – A summary of results from the skewness tests performed on the case quantities ...........................................................................203 Table 10.12: Hypothesis 2 and 5 – A summary of transformed case quantities ..........204 Table 10.13: Hypothesis 2 and 5 – A summary of results from the KolmogorovSmirnov and Anderson-Darling tests performed on the transformed case quantities ...............................................................................................................................206 Table 10.14: Hypothesis 2 and 5 – A summary of results from the skewness tests performed on the transformed case quantities.......................................................206.
(14) List of Tables. xiii. Table 10.15: Hypothesis 2 and 5 – A summary of results from the Mauchly’s tests performed on the relevant differences...................................................................207 Table 10.16: Hypothesis 2 and 5 – A summary of results from the two-way repeated measures ANOVA performed on the transformed case quantities .......................209 Table 10.17: Hypothesis 2 and 5 – A summary of results from the pairwise comparisons of the visual representation dimension factor........................................................211 Table 10.18: A summary of collection rates ................................................................214 Table 10.19: Some descriptive statistics for the collection rates..................................215 Table 10.20: Hypothesis 3 and 6 – A summary of results from the KolmogorovSmirnov and Anderson-Darling tests performed on the collection rates ..............219 Table 10.21: Hypothesis 3 and 6 – A summary of results from the skewness tests performed on the collection rates ..........................................................................220 Table 10.22: Hypothesis 3 and 6 – A summary of transformed collection rates .........221 Table 10.23: Hypothesis 3 and 6 – A summary of results from the KolmogorovSmirnov and Anderson-Darling tests performed on the transformed collection rates ...............................................................................................................................223 Table 10.24: Hypothesis 3 and 6 – A summary of results from the skewness tests performed on the transformed collection rates......................................................223 Table 10.25: Hypothesis 3 and 6 – A summary of results from the Mauchly’s tests performed on the relevant differences...................................................................224 Table 10.26: Hypothesis 3 and 6 – A summary of results from the two-way repeated measures ANOVA performed on the transformed collection rates.......................226 Table 10.27: Hypothesis 3 and 6 – A summary of results from the pairwise comparisons of the visual representation dimension factor........................................................228 Table 10.28: Postulated cause and effect relationships in Hypothesis 2 to 6...............230.
(15) ACKNOWLEDGEMENTS This thesis would not have happened without the various forms of support from the Engineering and Physical Sciences Research Council through the Warwick Innovative Manufacturing Research Centre initiative, Ford Motor Company (Ford), Lanner Group Limited (Lanner), Warwick Business School, and the people below.. First and foremost, many thanks to Professor Stewart Robinson (my main supervisor) for his guidance, encouragement, occasional reassurance, and most importantly, for taking his chance with a fresh postgraduate a couple of years ago.. In addition, I would like to express my gratitude to Professor John S Edwards (Aston Business School), John Ladbrook (Ford), Tony Waller (Lanner), Professor Ruth Davies (my second supervisor), Justice Akpan and Thanos Alifantis for their timely intervention and help. Also, I would like to thank Professor Mike Pidd (Lancaster University Management School) and Kathy Kotiadis (Warwick Business School) for examining this thesis and suggesting ways to make it even better.. Furthermore, I am deeply indebted to the personnel from Ford for their willingness to participate in my experiments. They are Gian Singh, Jerry Kilonda, Malkit Singh, Premjit Kerai, Raj Katechia, Raj Matharu, Ranjit Dhesi, Tom Brew and Ranta Varsani.. At the risk of this becoming an Oscar-ceremony-type thing, I am also very grateful to the following friends for making my seemingly never-ending Ph.D. years more bearable.
(16) Acknowledgements. xv. and enjoyable: Antuela Tako, Ge Guo, Kahwai Fok, Martin Liu, Menesh Patel, Suchi Patel and Wenzhi Yan.. Last but not least, I would like to extend my heartfelt appreciation to Lennon Teng (my soul mate) for always being there for me, as well as my family for their patience, understanding and firm belief in me.. Thank you. ☺. PS: I would like to dedicate this thesis to the memory of my grandmother, who is sadly missed..
(17) ABSTRACT Knowledge elicitation is a well-known bottleneck in the development of KnowledgeBased Systems (KBS). This is mainly due to the tacit property of knowledge, which renders it unfriendly for explication and therefore, analysis. Previous research shows that Visual Interactive Simulation (VIS) can be used to elicit episodic knowledge in the form of example cases of decisions from the decision makers for machine learning purposes, with a view to building a KBS subsequently. Notwithstanding, there are still issues that need to be explored; these include how to make a better use of existing commercial off-the-shelf VIS packages in order to improve the knowledge elicitation process’ effectiveness and efficiency. Based in a Ford Motor Company (Ford) engine assembly plant in Dagenham (East London), an experiment was planned and performed to investigate the effects of using various VIS models with different levels of visual fidelity and settings on the elicitation process. The empirical work that was carried out can be grouped broadly into eight activities, which began with gaining an understanding of the case study. Next, it was followed by four concurrent activities of designing the experiment, adapting a current VIS model provided by Ford to support a gaming mode and then assessing it, and devising the measures for evaluating the elicitation process. Following these, eight Ford personnel, who are proficient decision makers in the simulated operations system, were organised to play with the game models in 48 knowledge elicitation sessions over 19 weeks. In so doing, example cases were collected during the personnel’s interactions with the game models. Lastly, the example cases were processed and analysed, and the findings were discussed. Eventually, it seems that the decisions elicited through a 2-Dimensional (2D) VIS model are probably more realistic than those elicited through other equivalent models with a higher level of visual fidelity. Moreover, the former also emerges to be a more efficient knowledge elicitation tool. In addition, it appears that the decisions elicited through a VIS model that is adjusted to simulate more uncommon and extreme scenes are made for a wider range of situations. Consequently, it can be concluded that using a 2D VIS model that has been adjusted to simulate more uncommon and extreme situations is the optimal VIS-based means for eliciting episodic knowledge..
(18) LIST OF ABBREVIATIONS The abbreviations that are used throughout this thesis are listed below:. 2D. 2-Dimensional. 2l. 2 litres (engine capacity). 2.4l. 2.4 litres (engine capacity). 2½D. 2½-Dimensional. 3D. 3-Dimensional. A-D. Anderson-Darling test. AI. Artificial Intelligence. ANOVA. ANalysis Of VAriance. ATD. After Test Dress. CA. Cluster Analysis. CBR. Case-Based Reasoning. COTS. Commercial Off-The-Shelf. DES. Discrete-Event Simulation. EPSRC. Engineering and Physical Sciences Research Council. Ford. Ford Motor Company. KBI. Knowledge-Based Improvement. KBS. Knowledge-Based System. KBSDLC. Knowledge-Based System Development Life-Cycle. K-S. Kolmogorov-Smirnov test. MDS. Multi-Dimensional Scaling.
(19) List of Abbreviations. OR. Operational Research. SDLC. Systems Development Life Cycle. SSD. Sum of Squared Distances. UV. Ultra-Violet. VIS. Visual Interactive Simulation. VR. Virtual Reality. xviii.
(20) 1 Introduction 1.1 BACKGROUND. Developing useful models of complex systems is inherently difficult. It is made worse when the systems interplay with human intent and action. Whilst many authors such as Willemain (1994), Powell (1995) and Pidd (2003) argue that it is desirable to model simply, it is also widely conceded that such parsimony should be exercised with an eye on the models’ purposes. In short, model fidelity should match model needs. In this respect, if a model is intended for examining the effects of or even to be used as a means for improving human interaction with an operations system, then it should mimic the human decision makers’ behaviour in the system as closely as possible.. Human decision-making and intervention is a significant element in most manufacturing systems. Baines and Kay (2002) comment that a manufacturing system may involve any number of manual processes and many aspects of its operation such as scheduling of maintenance works and allocation of resources may require human decision-making. They also add that human decisions and interventions may have a great impact on the systems’ performances. As such, manufacturing systems provide a legitimate context for investigating how to model human-operations system interaction appropriately.. Towards this end, Robinson et al. (2005) undertook a project (Grant reference: GR/M72876) sponsored by the Engineering and Physical Sciences Research Council (EPSRC), which aims to identify and improve human decision-making in an operations.
(21) Introduction. 2. system. Facilitated by a real-world case study set in a Ford Motor Company (Ford) engine assembly plant in Bridgend (Wales), the project ultimately led to the development. and. application. of. the. Knowledge-Based. Improvement. (KBI). methodology. Broadly, the KBI methodology is based on Visual Interactive Simulation (VIS) and Artificial Intelligence (AI). It starts by eliciting episodic knowledge in the form of example cases of decisions from the human decision makers via a VIS model. Next, AI methods are used on these example cases to learn and represent the decision makers’ strategies for decision-making. Then, the AI models are linked with the VIS model to predict the operations system’s performance under different strategies. Lastly, the methodology ends with attempts to improve existing strategies.. In their conclusion, Robinson et al. (2005) discover from the knowledge elicitation phase that human decision makers may make less realistic decisions in a simulated environment. It is because they are likely to assume greater risks when there are no real consequences from their decisions. In addition, the authors also recognise that the decision makers may find the experience of providing a full set of data that comprises of a very large number of useful example cases to be a very laborious and time-consuming one. Consequently, these issues provide the impetus for another EPSRC-sponsored project (Grant reference: GR/R64841) that seeks to answer the following questions: i.. Is VIS a valid tool for eliciting knowledge? If there are successful demonstrations of using VIS to collect example cases for machine learning purposes such as rule induction, case-based reasoning, or neural network computing, then;. ii. How can VIS be adapted to make for a better knowledge elicitation tool?.
(22) Introduction. 3. Similarly, this project was carried out with the help of a real-world case study set in a Ford engine assembly plant. It enlisted real human decision makers to solve a realworld case problem using a VIS model that mimicked the real-world operations system as closely as possible. Unlike Bell and O’Keefe’s (1995) reservation on conducting an experiment in a laboratory setting that is detached from reality, all the decision makers employed in this project have a good understanding of the real-world system and the decision-making that takes place regularly in it.. Eventually, the investigation that this project embarked on culminated in this thesis.. 1.2 AN OUTLINE OF THE THESIS. This thesis begins by exploring the world of the Knowledge-Based Systems (KBS), a well-established domain where knowledge elicitation plays an integral and crucial role (Chapter 2). It includes looking into the terminology that is commonly used in the KBS literature, as well as the KBS development life-cycle and its associated problems. Meanwhile, the subject of knowledge elicitation and the various techniques that can be used to support it are also reviewed. Following this, the working relationship between KBS and VIS is explored (Chapter 3). In so doing, the evidence of using VIS to collect data for building KBS is collated; this establishes VIS as a valid knowledge elicitation tool, and hence contributes to answering the first research question.. Next, the scene is set for carrying out an investigation to find out if and how VIS can be improved as a knowledge elicitation tool (Chapter 4); which essentially aims to answer the second research question. These include explicating the constructs for assessing.
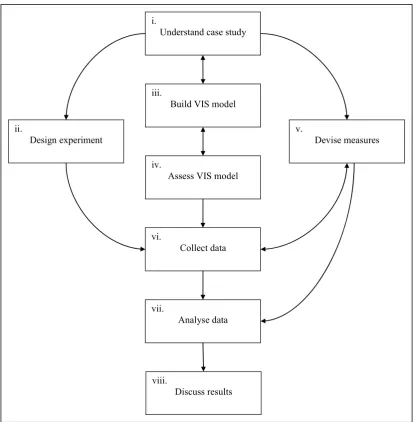
(23) Introduction. 4. ‘elicitation improvement’, and then using them as a basis for forming the research propositions and specifying the research hypotheses. Furthermore, a methodology for executing the investigation and the following hypothesis tests is described briefly; it also serves to provide a structure for organising the subsequent chapters.. The methodology is comprised of a series of processes. Since some of them are independent of the others and can be activated in parallel with them, they are not entirely sequential. The details and outcomes of all work carried out in each of these processes make up the rest of this thesis. They are: i.. Understanding the case study (Chapter 5);. ii. Designing the experiment (Chapter 6); iii. Building and assessing the VIS model (Chapter 7); iv. Devising the measures for evaluating the four constructs (Chapter 8); and last but not least v. Collecting and analysing the data (Chapter 9 and 10).. Finally, the thesis concludes with a summary and discussion of the results from the data analysis (Chapter 11). In addition, the limitations that were encountered throughout the investigation are reflected upon.. Also, the opportunities that were identified for. probable future research are discussed..
(24) 2 Knowledge-Based Systems and Knowledge Elicitation This chapter provides a context, within which the research questions in Section 1.1 can be addressed. In essence, the what, where, why and how of knowledge elicitation are explored and explicated. It first begins with a background of knowledge-based systems, a well-established domain where knowledge elicitation plays an integral and crucial role. Next, it endeavours to propose working definitions for the basic terms used in the knowledge-based systems literature; these include knowledge engineering, knowledge acquisition and knowledge elicitation.. Then, these terms are put into perspective. through a basic knowledge-based systems development life-cycle model. Later, the problems at each process of the life-cycle model are discussed briefly, with an emphasis on the knowledge elicitation process – the focus of this thesis. Finally, a concise overview explaining how various techniques have been used to elicit knowledge is provided. As well, the area wherein this thesis makes a positive contribution is also unveiled in the overview.. 2.1 KNOWLEDGE-BASED SYSTEMS. Knowledge-Based Systems (KBS) or expert systems originated from a field of study known as Artificial Intelligence (AI).. The phase of the computer revolution that. spawned KBS actually began in the early seventies, under the guise of computer.
(25) Knowledge-Based Systems and Knowledge Elicitation. 6. hardware advances destined to send the price of computers plummeting below even the most optimistic scientist’s prediction (Waterman, 1986). Whilst computer hardware specialists were developing microchip technology, software specialists were laying the groundwork for a conceptual breakthrough in a fledging field of Computer Science known as AI.. The goal of AI scientists has always been to develop computer programs that can solve problems in a way that is considered intelligent if done by a human. The first period of AI research is dominated by a naïve belief that a few general laws of reasoning coupled with powerful computers would produce expert performance. As experience accrued, the limited power of programs with general-purpose problem-solving strategies led to the conclusion that they were too weak to solve most complex problems (Newell, 1969). It seemed that the more classes of problems a single program could handle, the more poorly it did so on any individual problem (Waterman, 1986).. In response, the AI scientists then decided to reduce the scope of application by developing programs with general-purpose problem-solving strategies for narrowly defined problems.. This new direction produced some successes but still no. breakthroughs. Later, it dawned upon the AI scientists that the problem-solving power of a program came from the knowledge it possessed. That is, to make a program intelligent, it should be provided with lots of high quality knowledge that are specific to the problem area (Waterman, 1986). This realisation (a conceptual breakthrough) led to the development of special-purpose programs that were expert in some narrow problem areas. As these programs were meant to solve problems and explain solutions that would otherwise require an expert, they became known as expert systems. Also, as.
(26) Knowledge-Based Systems and Knowledge Elicitation. 7. these programs possessed knowledge about some particular domains, they were also known as knowledge-based systems (Darlington, 2000).. 2.2 KNOWLEDGE-BASED SYSTEMS TERMINOLOGY. In the KBS literature, knowledge engineering, knowledge acquisition and knowledge elicitation are three terms that are used frequently. Cordingley (1989), and Johannsen and Alty (1991) comment that they are usually not well defined and often appear to overlap, whilst Firlej and Hellens (1991) even claim that these three terms are used interchangeably throughout the KBS literature.. In most literature, knowledge engineering is a term used to describe the whole process of building a KBS: from the original investigation of the problem through to implementation (Edwards, 1991; Moody et al., 1998; Turban et al., 2005). In other words, it is to KBS what software/systems engineering is to conventional systems. A principle of knowledge engineering holds that whilst expert performance rarely conforms to some rigorous algorithmic process, it lends itself to computerisation. Hence, it follows that the essential tasks in knowledge engineering are expected to include those of ‘extracting, articulating and computerising’ the expert’s knowledge (Hayes-Roth et al., 1983).. Unlike knowledge engineering, the definition of knowledge acquisition is more contentious. Buchanan’s et al. (1983) original definition of knowledge acquisition as ‘the transfer and transformation of problem-solving expertise from some knowledge source to a problem’ has lent itself to several interpretations.. Firstly, Cordingley.
(27) Knowledge-Based Systems and Knowledge Elicitation. 8. (1989), and Johannsen and Alty (1991) interpret it as sharing the same breadth as knowledge engineering to cover the whole process. It includes the identification of the problem, its conceptualisation, formalisation, implementation, testing and prototype revision. Secondly, Liang (1992) and Jackson (1999) restrict their interpretation to include eliciting knowledge from experts, storing it in some intermediate representation and compiling it into some machine executable format.. Thirdly, Edwards (1991). provides the narrowest interpretation by deeming knowledge acquisition as just the act of acquiring basic knowledge from the human expert.. Likewise, the definition of knowledge elicitation is also disputable. Firstly, Cordingley (1989) and Darlington (2000) define it simply as the process of obtaining knowledge about a domain from an expert; this is similar to Edward’s (1991) interpretation of knowledge acquisition. Secondly, Johannsen and Alty (1991), and Moody et al. (1998) define it as one-half of a dichotomy of knowledge acquisition techniques that includes both manual (human-to-human) and semi-automatic (human-to-machine) means, with the other half being the automatic technique of rule induction. Rule induction is a special case of autonomous machine learning techniques that encompasses heuristics for generalising data types, candidate elimination algorithms, methods for generating decision trees and rule sets, function induction and procedure synthesis. It is described in more detail in Section 2.4.4.. As such, it is evident that there is a grey area when it comes to making a distinction between knowledge engineering and knowledge acquisition, and between knowledge acquisition and knowledge elicitation. Thus, taking advantage of the fact that KBS terminology is not cast in stone, a working definition for each of knowledge.
(28) Knowledge-Based Systems and Knowledge Elicitation. 9. engineering, knowledge acquisition and knowledge elicitation is proposed here for the purpose of this thesis.. Here, the general definition of knowledge engineering is. adopted, where it is taken to mean the entire process of developing a KBS. For knowledge acquisition, Jackson’s (1999) interpretation is adopted, where it is deemed to encompass knowledge elicitation, knowledge representation and knowledge execution. Finally, Darlington’s (2000) definition for knowledge elicitation is adopted, where it is the process of obtaining domain knowledge from an expert. These definitions are illustrated more clearly through a basic KBS development life-cycle model described later in Section 2.3.2.. 2.3 KNOWLEDGE-BASED SYSTEMS DEVELOPMENT LIFECYCLE. There are a few essential activities that have to take place when a KBS is being developed. These activities provide the basis for phases that collectively form the KBS’ development life-cycle.. To help establish the life-cycle of a KBS, Weitzel and. Kerschberg (1989a and b), and Edwards (1991) suggest adopting a traditional Systems Development Life-Cycle (SDLC) model as a base first, on which modifications are then made to cater for the significant differences between the KBS and the conventional systems. In this respect, a waterfall model of SDLC is introduced initially in the next section. Then, some modifications are suggested, which later leads to the proposal of a basic KBS Development Life-Cycle (KBSDLC) model. Also, the potential problems that may crop up in the KBSDLC are reviewed..
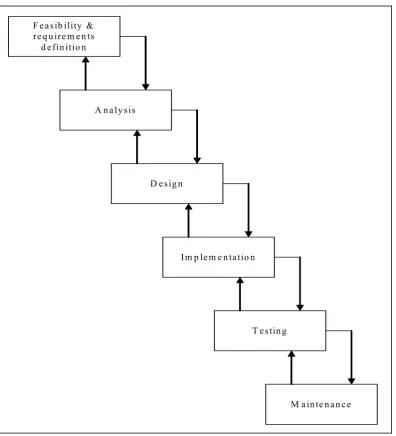
(29) Knowledge-Based Systems and Knowledge Elicitation. 10. 2.3.1 SYSTEMS DEVELOPMENT LIFE-CYCLE. In the past, software development consisted of a programmer writing code to solve a problem or automate a procedure. Nowadays, systems are so big and complex that teams of architects, analysts, programmers, testers and users are required to work together to create millions of lines of code to drive the enterprises (Computerworld, 2007). As a result, a number of SDLC models were created to manage such mammoth undertakings. Dennis and Wixom (2003) observe that all SDLC models invariably have four fundamental phases: planning, analysis, design and implementation. Different systems development projects may emphasise different parts of the SDLC or approach the SDLC phases in different ways, but all projects’ life-cycle will have elements of these phases. Royce’s (1970) waterfall model is the oldest and the best known SDLC model, and a simplified version is shown in Figure 2.1. The model shows a sequence of phases where the output of each phase becomes the input for the next. In general, there are six phases in the model: i.. Feasibility and requirements definition This planning phase establishes a high-level view of the intended project and determines its goals. A feasibility study is next undertaken to determine whether the project should get the go-ahead. If the project is to proceed, then a project plan with budgeted estimates for the future stages of development is produced;. ii. Analysis This phase refines the project goals into defined functions and operations of the intended application. Requirements for the system is gathered via detailed study of the organisation’s business needs, and analysis of end-users’ information needs;.
(30) Knowledge-Based Systems and Knowledge Elicitation. 11. iii. Design This phase describes the desired features and operations in detail, focusing on highlevel design (what programs will be needed, and how will they interact), low-level design (how will the individual programs work), interface design (how will the interfaces look like) and data design (what data will be needed);. iv. Implementation This phase translates the design into code, using whatever computer languages that are appropriate.. Provisional versions of documentation, manuals and training. materials will also be produced in this phase;. v. Testing Normally, programs are written as a series of individual modules. This phase will bring all the modules together as a system, to check for errors, bugs and interoperability in a special testing environment. The system needs to be tested to ensure that interfaces between modules work (integration testing), the system works on the intended platform and with the expected volume of data (volume testing), and that the system does what the user requires (acceptance/beta testing); and. vi. Maintenance This phase consists of making sure that the system runs in operational use and continues to do so for as long as is required. It includes correcting any undetected errors, enhancing the functionality of the system, and even moving the system to a different computing platform..
(31) Knowledge-Based Systems and Knowledge Elicitation. 12. F e a s ib ility & re q u ir e m e n ts d e fin itio n. A n a ly s is. D e s ig n. I m p le m e n ta tio n. T e s tin g. M a in te n a n c e. Figure 2.1: A simplified waterfall model of SDLC (Royce, 1970). However, the waterfall model is not perfect and has its fair share of drawbacks. Mainly, the model assumes that the only role for users is in specifying requirements, and that all requirements can be specified in advance.. It also assumes that system design is. straightforward, and implementation is the real problem (Weitzel and Kerschberg, 1989a and b; Computerworld, 2007). Unfortunately, requirements do grow and change throughout the process and beyond, and a straightforward system design is rare..
(32) Knowledge-Based Systems and Knowledge Elicitation. 13. Moreover, real projects seldom follow the sequential process illustrated in the model, which explain the feedback and iterative consultation allowed in Royce’s (1970) waterfall model.. In view of these drawbacks, many other SDLC models were. developed later. They are usually variants of Royce’s model (Weitzel and Kerschberg, 1989a and b) and include fountain, spiral, build and fix, rapid prototyping, incremental, and synchronise and stabilise (Computerworld, 2007). Nonetheless, in spite of its imperfections, the simpler original SDLC waterfall model will be used as a basic framework for adaptation into a provisional conceptual framework for developing KBS.. 2.3.2 A BASIC MODEL OF KNOWLEDGE-BASED SYSTEMS DEVELOPMENT LIFECYCLE. Knowledge acquisition is defined earlier (Section 2.2) to encompass knowledge elicitation, knowledge representation and knowledge execution.. Edwards (1991). identifies these activities as equivalent to the ‘Analysis’, ‘Design’ and ‘Implementation’ phases in a SDLC respectively. The correspondence between the knowledge acquisition activities and the relevant SDLC phases can be summarised in Table 2.1.. Knowledge acquisition activity. Work involved. Corresponding SDLC phase. ⋅ Knowledge elicitation. ⋅ Eliciting the basic knowledge from the human expert. ⋅ Analysis. ⋅ Knowledge representation. ⋅ Organising and structuring the knowledge. ⋅ Design. ⋅ Knowledge execution. ⋅ Codifying the knowledge into a machine-executable format. ⋅ Implementation. Table 2.1: Knowledge acquisition activities and their corresponding SDLC phases.
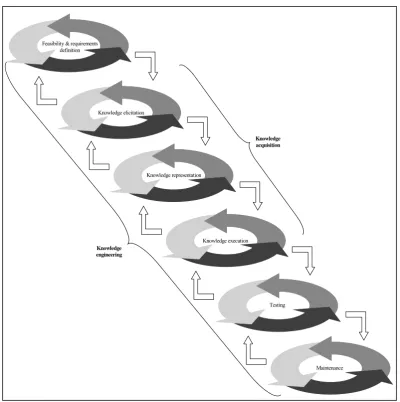
(33) Knowledge-Based Systems and Knowledge Elicitation. 14. Moreover, Weitzel and Kerschberg (1989a and b), and Edwards (1991) also suggest infusing the KBSDLC model with regular prototyping, which is characterised by iterative refinement that stresses fast development turnaround. It is because as an expert’s conception of his 1 knowledge (such as the intermediate concepts used to monitor the ‘state’ of the solution, or even the reasoning process) tends to change with the KBS evolvement, such fast development turnaround would allow him to discover any shortcomings more quickly. Further to this, Weitzel and Kerschberg (1989a and b) suggest using the term ‘processes’ instead of (sequential) ‘phases’ to describe the KBSDLC model in order to emphasise its flexibility.. Applying these refinements onto the original SDLC waterfall model, a basic broadbrush KBSDLC model may be as adapted in Figure 2.2. The notions of knowledge engineering, knowledge acquisition and knowledge elicitation are illustrated clearly in the model. As well, the iterative refinement that is expected in each process is signified by the ring of arrows that encircles it. Processes in the life-cycle are activated initially by proceeding from the top of the model. A process can be reactivated to correct problems, before other processes have been activated for the first time. Also, the process in which problems are discovered does not necessarily constrain the process that needs to be activated. Therefore, a process can run concurrently with processes that are already activated, or it can be deactivated and reactivated at a later time. In this way, the KBS is actually evolving incrementally (Weitzel and Kerschberg, 1989b).. 1. The author recognises that a knowledge engineer or expert may be a female. However, in light of making this thesis a more pleasant and consistent read, only masculine pronouns are used. Any offence caused is deeply regretted..
(34) Knowledge-Based Systems and Knowledge Elicitation. 15. Feasibility & requirements definition. Knowledge elicitation. Knowledge acquisition. Knowledge representation. Knowledge execution Knowledge engineering. Testing. Maintenance. Figure 2.2: A suggested knowledge-based systems development life-cycle model. Briefly, in the feasibility and requirements definition process, the knowledge engineer and expert will work together to identify the problem area and define its scope. They will also determine the resources (human, time and computing facilities) required, as well as finalise the objectives of building the KBS. During the knowledge elicitation process, the knowledge engineer and expert will explicate sufficient key descriptions, relationships and procedures to describe the problem-solving process. In addition, strategies, subtasks, and constraints relating to the problem-solving activity are also specified. In the knowledge representation process, the knowledge elicited above will.
(35) Knowledge-Based Systems and Knowledge Elicitation. 16. be organised and mapped into a formal representation. Next, the representation will be used to formulate rules that are then encoded in the knowledge execution process. These coded rules should embody the expert’s knowledge and will define a prototype program capable of being executed and tested. Finally, testing involves evaluating the performance of the prototype program and revising it to conform to the standards set in the first process (Hayes-Roth et al., 1983).. Though the KBSDLC model presented in Figure 2.2 is not a definitive version, it does not vary much from other proposed models. For instance, Barrett and Edwards (1995) mention that the BIS KBS methodology (from BIS Information Systems, a company) broadly resembles a waterfall approach to conventional development as it has the stages of feasibility, analysis, design, programming, testing and validation, and review. Like the suggested basic model, the BIS KBS methodology also permits the use of prototyping within many of the stages. In another instance, Madni (1988) suggests six stages in KBS development: knowledge elicitation, cognitive bias filtering, knowledge representation, software development and integration, system evaluation and validation, and advanced prototype expert system.. Apart from cognitive bias filtering and. advanced prototype expert system, the remaining four stages appear to be in line with the basic model.. 2.3.3 POTENTIAL PROBLEMS IN DEVELOPING A KNOWLEDGE-BASED SYSTEM. A number of problems have been uncovered in each process of the life-cycle. McDermott (1983), and Weitzel and Kerschberg (1989b) reflect that ad hoc solutions for the problems in early processes seem to create new and even bigger problems in.
(36) Knowledge-Based Systems and Knowledge Elicitation. 17. later processes. In other words, problems propagate. Notwithstanding, as the locus of this thesis lies within the knowledge elicitation process, this section (and the rest of the thesis) will concentrate mainly on its issues.. Problems in knowledge acquisition/elicitation process. The best known and most critical bottleneck in a KBS development lies within the knowledge acquisition phase, with particular stress on knowledge elicitation (Buchanan et al., 1983; Breuker and Wielinga, 1987; Byrd, 1995; Moody et al., 1998). It is critical because the power and utility of a KBS depends on the quality of the expert knowledge that is elicited and reproduced. Clancey (1986) points out that the process of eliciting knowledge from an expert entails more than the process of transferring a mental model lying within his brain into the mind of the knowledge engineer.. It also includes. formalising the expert’s domain knowledge for the first time, which is an inherently difficult process due to the latter’s tacit nature.. To incubate tacit knowledge, the expert needs to practice to become skilful, using rules of thumb or heuristics, learning which rules work and when they work. Through experience, he then develops judgement, insight, and informed opinions. It is the quality of this undocumented knowledge that is gleaned from his many years of experience in his particular field that determines his level of expertise (Kidd and Welbank, 1984). Unfortunately, when the expert is posed with a problem, he may be able to tell you his decision or diagnosis, but not the details of his thought process. He may even use certain knowledge without being aware that he has it. It is also very likely that he has never been required to formulate his decision-making, and he may.
(37) Knowledge-Based Systems and Knowledge Elicitation. 18. have made many assumptions which are not stated explicitly. Furthermore, the expert can be surprised and even alarmed when the simple consequences of these assumptions are pointed out, and consequently he may be reluctant to admit to them (Jackson, 1985). In contrast, when the expert is asked for the factors that he had considered, he may list those which he thinks he ought to use, albeit they will not necessarily be the same as those he had actually used. However, this should not be construed deliberate deception; the expert will have learnt a lot of his knowledge through experience, and he may use it without being consciously aware of the explicit details. As such, tacit knowledge is also often referred to as compiled knowledge, whose elucidation and reproduction is usually much more central and difficult to the knowledge acquisition process.. At present, there is a wide range of techniques that are available to facilitate the knowledge elicitation process. They are discussed in detail in Section 2.4.. Problems in other life-cycle processes. In addition, there are also problems in other KBSDLC processes.. They include. determining whether the selected domain is appropriate for building a KBS (domain feasibility), and whether the expected costs and efforts are affordable (resource feasibility). Another problem might be finding out why a newly-built KBS fails to be accepted in the intended working environment and even fails to satisfy preset performance criteria. Last but not least, a KBS that requires extensive maintenance might also pose a problem if the system is so opaque and unstructured that it is hard to tell where updates and modifications should be applied (Breuker and Wielinga, 1987)..
(38) Knowledge-Based Systems and Knowledge Elicitation. 19. 2.4 KNOWLEDGE ELICITATION TECHNIQUES. The knowledge elicitation process has been identified as a very critical bottleneck in the development of a KBS. This section looks at the ways that the elicitation process can be facilitated. Ideally, a conceptual framework of problem solving behaviour should be established as a prerequisite to the knowledge elicitation process. However, in its absence, the knowledge engineer can only try to use ad hoc means to understand in detail the concepts and relations used by the experts in their daily activities. Hopefully, the knowledge engineer is then able to construct a knowledge model whose contents and structure is very similar to that used by the expert, so that it can be used to support clear explanations and be an important part of the interface between the KBS and the expert (Clancey, 1986).. The types of knowledge that can be elicited are introduced first in the following sections. Then, the different techniques that a knowledge engineer may use to elicit an expert’s knowledge are explained. automatic techniques.. They range from manual, semi-automatic to. Finally, these techniques, together with their strengths and. weaknesses, are summarised appropriately.. 2.4.1 KNOWLEDGE CATEGORISATION. Like the terminology used in the KBS literature (knowledge engineering, knowledge acquisition and knowledge elicitation), defining knowledge, information and data is also a disputable area. On the one hand, Naylor et al. (2001) subsume information and data under knowledge as both of them, together with structured information and insight, are.
(39) Knowledge-Based Systems and Knowledge Elicitation. 20. considered to be different types of knowledge. On the other hand, Darlington (2000) deems knowledge as a derivative of information, which in turn is deemed a distillate of data. For the purpose of this thesis, the former and broader definition of knowledge is adopted. As such, knowledge ranges from its most factual form (data) to its most abstract form (insight).. Moreover, Turban et al. (2005) recognise that there are two major categories of knowledge: declarative and procedural. On the one hand, declarative knowledge can be thought of as ‘knowing that’ type of knowledge, which is essentially a descriptive representation of knowledge. It consists of related facts that can be organised and reorganised according to the occasion’s demands. An operative term for declarative knowledge is description. On the other hand, procedural knowledge can be thought of as ‘knowing how’ type of knowledge, which considers the manner things work under different situations. It includes step-by-step sequences and how-to type of instructions, as well as explanations. An operative term for procedural knowledge is procedure.. 2.4.2 MANUAL KNOWLEDGE ELICITATION TECHNIQUES. Manual methods are basically structured around an interview of some kind. These include document analysis, interview, on-site observation, questionnaire and rating scale, teach-back interview, protocol analysis, walkthrough, card-sort, and last but not least, solution-characteristic matrix.. As these methods are slow, expensive and. sometimes inaccurate, there is a trend towards automating the knowledge elicitation process as far as possible. Semi-automatic and automatic methods are discussed later in Section 2.4.3 and 2.4.4 respectively..
(40) Knowledge-Based Systems and Knowledge Elicitation. 21. Document analysis. Published documents such as books, papers and reports are good sources for acquiring general knowledge in well-established domains. For instance, Duan and Burrell (1995) remark that using published documents as a major source of knowledge is actually quite common in the marketing area. However, although documented knowledge may cover a wide range and is easy to access, it is limited to generalities. As such, a knowledge engineer cannot expect to rely solely on published documents to build a sufficient knowledge base.. Interview. An interview consists of interactions involving questions and answers between a knowledge engineer and an expert. In general, interviews provide a cheap but effective means of generating concepts, which are then used to produce a rough ‘map of the territory’ that covers the expert’s domain. In addition, initial interviews also serve to develop some rapport between the knowledge engineer and the expert.. As it is. important to get the expert to communicate fluently, the exact form that an interview may take is not critical. Four possible types of interview are tutorial, unstructured, semi-structured or structured interviews.. In a tutorial interview, the expert will be asked to prepare an introductory talk outlining his domain, and deliver it as a tutorial session to the knowledge engineer. In an unstructured interview, where the control of the interactions lies mainly with the expert,.
(41) Knowledge-Based Systems and Knowledge Elicitation. 22. he is given the freedom to cover topics that he deems fit. Here, the knowledge engineer only plays a facilitating role by encouraging the expert with general questions, probes and prompts. As digressions are usually tolerated, any material elicited is usually unpredictable and at times incoherent.. Hence, the knowledge engineer has the. additional burden of making the outcomes productive (Cordingley, 1989; Johannsen and Alty, 1991). In a semi-structured interview, the knowledge engineer works to a list of topics to be covered in the interview session, which does not specify the precise questions to be asked of the expert. In a structured interview, where the control of the interactions lies mainly with the knowledge engineer, he organises the communication between the expert and himself by working through a list of specific questions that are produced prior to the interview; thereby facilitating a systematic exchange of information. As such, the knowledge engineer’s questions and the expert’s answers are more restricted here than in less structured interviews (Moody et al., 1998). Normally, no single type of interview is used to the exclusion of the others. It is because each interview type’s relative applicability changes as the development process progresses. At the earlier stages of knowledge acquisition, tutorial, unstructured and/or semistructured interviews are utilised to provide a general overview of the expert’s domain. Once the process of knowledge acquisition is more advanced, structured interviews may be introduced to provide more specific focus.. Waterman (1986) mentions that the knowledge engineer may ask the expert to discuss, describe and/or analyse problems pertaining to his area of expertise during an interview. In a ‘problem discussion’ session, the knowledge engineer may pick a set of representative problems and discusses them with the expert. The goal is to determine how the expert organises his knowledge about each problem, represents concepts and.
(42) Knowledge-Based Systems and Knowledge Elicitation. hypotheses, and handles inconsistent, inaccurate, or imprecise data.. 23. During this. discussion, the expert may introduce new concepts and relations. When this happens, the knowledge engineer will ask the expert to define these new constructs and relate them to the existing body of concepts and relations. In a ‘problem description’ session, the knowledge engineer will require the expert to describe a typical problem for each main category of answer that may arise. This helps the knowledge engineer to define a prototypical problem for each category of answer. This exercise may also suggest ways to organise knowledge hierarchically in the KBS. Finally, in a ‘problem analysis’ session, the knowledge engineer will ask the expert to solve a series of realistic problems and probe for the latter’s reasoning as the problems are solved. Here, the expert is required to describe the solution process and disclose as many intermediate steps as possible. The knowledge engineer will then question each step to determine the underlying rationale, including hypotheses that are entertained, strategies that are used to frame the hypotheses, and goals that are pursued to guide strategy selection.. Moody et al. (1998) comment that interviews are a pervasive technique as they can be used to elicit all types of knowledge. Nevertheless, depending on the dynamics of the interviews, the coverage of the expert’s area of expertise through interviews may still be incomplete and arbitrary. Also, Barrett and Edwards (1995) add that the expert may say what they wish to say, or what they think they are expected to say, rather than what they actually do.. These suggest that interview aids or other complementary elicitation. techniques should be used when possible. They include recording the interviews for subsequent reference, using labelled diagrams to help the expert to construct his talk, or even analysing protocols generated from the interviews..
(43) Knowledge-Based Systems and Knowledge Elicitation. 24. On-site observation. Waterman (1986) explains that in on-site observation, a knowledge engineer will observe as an expert solves real problems on the job, rather than contrived but realistic problems in a laboratory setting. Here, the knowledge engineer will be observing passively and recording all observed information as accurately as possible. During the observations, the knowledge engineer will neither interfere with the expert’s work, nor require much participation from the expert. In this way, the knowledge engineer may gain some insight into the complexity of the expert’s domain. However, Barrett and Edwards (1995) warn that this technique is not feasible if the knowledge engineer and expert do not share a ‘common ground’. Furthermore, on-site observation may not be practical for some domains, especially when there are time constraints or privacy concerns.. In addition, Johannsen (1989) also suggests a special hybrid of the interview and observation techniques, known as observation interview. In an observation interview session, the knowledge engineer will observe and note down the expert’s activities as usual, and then try to clarify with the expert any queries that he has with the observations at the earliest instance. The queries may range from causes and reasons to consequences of the observed activities.. In this way, observation interview is a. powerful technique as whilst empirical data are being collected through observation, the knowledge engineer is also eliciting decision-making strategies concurrently through his what, how and why questions..
(44) Knowledge-Based Systems and Knowledge Elicitation. 25. Questionnaire and rating scale. A questionnaire can be used instead of or in addition to an interview (Johannsen and Alty, 1991). It can be standardised in question-answer categories or it can be applied in a more formal way. In effect, a questionnaire is the equivalent of an interview in paper form, though it may not be as expansive or extensive. Similarly, Barrett and Edwards (1995) advise that a requisite for using this technique is that the knowledge engineer and expert need to share a ‘common ground’.. A rating scale is a formal technique for evaluating single items of interest by asking the expert to cross-mark a scale. Verbal descriptions along the scale such as from ‘very low’ to ‘very high’, or from ‘very simple’ to ‘very difficult’ are used as a reference for the expert. A rating scale can either be used alone, or together with an interview and/or questionnaire (Johannsen and Alty, 1991).. Teach-back interview. Teach-back interview is a ready-made checking device by definition (Johnson and Johnson, 1987).. It is a technique inspired by Ogborn and Johnson’s (1984). conversation theory, which is concerned with the notions of concepts and understanding as entities that are made public by an interaction between participants. The theory posits that there are two levels of analysis to an interaction: Level 0 and Level 1. At Level 0, concepts are explored; whilst at Level 1, Level 0 concepts are reconstructed. For instance, if a Level 0 answer is an explanation of how to do an algorithm, then a Level 1 answer may be an explanation of why the algorithm works. That is, the latter is.
Figure
+7


Related documents
was estimated that the retrofitted system with the recompression s-CO 2 cycle operating with such turbine inlet pressure had the net thermal efficiency of 31.9% HHV..
Performance of belly dance group of Röszke 19:30 Event House Announcement of Kisszállás competition 20:00 Event House.. Levente Nemes folk singer 20:30
Most consumers want to experience a car before they buy it (see panel on “complexity and emotion”) and – at least today – the only way to do that is usually to contact a dealer
The MILS architecture together with a strict decomposition into trusted and untrusted components gives us the opportunity to target a formal verifi cation of all critical
From the point of view of (multiagent) plan- ning [ 13 ], i.e., the problem of synthesising sequences of actions to reach a certain goal – in this case, arrival at a destination from
No treatment effects were observed ( P = 0.20) and both contrasts showed no differences (Supp. Cattle that were supplemented had increased fecal GE compared to CONTR cattle.
The University of Perpetual Help System DALTA is a member of National Collegiate Athletic Association (Philippines) since 1984 with UPHSD Altas as the team representing the
The adjustment budget contains realistic and credible revenue and expenditure forecasts which should provide a sound basis for improved financial management and
