University of Warwick institutional repository: http://go.warwick.ac.uk/wrap
This paper is made available online in accordance with publisher policies. Please scroll down to view the document itself. Please refer to the repository record for this item and our policy information available from the repository home page for further information.
To see the final version of this paper please visit the publisher’s website. Access to the published version may require a subscription.
Author(s): Carslake D, Townley S, Hodgson DJ
Article Title: Patterns and rules for sensitivity and elasticity in population projection matrices.
Year of publication: 2009 Link to published version:
Running Head: Patterns in sensitivity and elasticity
PATTERNS AND RULES FOR SENSITIVITY AND ELASTICITY IN POPULATION PROJECTION MATRICES
DAVID CARSLAKE,1,3 STUART TOWNLEY,2 AND DAVID J. HODGSON1
1
Centre for Ecology and Conservation, University of Exeter, Tremough Campus, Penryn, Cornwall, UK
2
School of Engineering, Computing and Mathematics, University of Exeter, Exeter, UK
3
2 Abstract. Sensitivity and elasticity analysis of population projection matrices (PPMs) are established tools in the analysis of structured populations, allowing comparison of the contributions made by different demographic rates to population growth. In some commonly used structures of PPM, however, there are mathematically inevitable patterns in the relative sensitivity and elasticity of certain demographic rates. We take a simulation approach to investigate these mathematical constraints for a range of PPM models. Our results challenge some previously proposed constraints on sensitivity and elasticity. We also identify constraints beyond those which have already been proven mathematically, and promote them as candidates for future mathematical proof. A general theme among these rules is that changes to the
demographic rates of older or larger individuals have less impact on population growth than do equivalent changes among younger or smaller individuals. However, the validity of these rules in each case depends on the choice between sensitivity and elasticity, the growth rate of the population and the PPM structure used. If the structured population conforms perfectly to the assumptions of the PPM used to model it, the rules we describe represent biological reality, allowing us to prioritise management strategies in the absence of detailed demographic data. Conversely, if the model is a poor fit to the population (specifically; if demographic rates within stages are heterogeneous) such analyses could lead to inappropriate management prescriptions. Our results emphasise the importance of choosing a structured population model which fits the demographics of the population.
INTRODUCTION
The parameterisation of demographic models of populations of organisms serves three important purposes. First, we may wish to predict directly the impacts of proposed, or
predicted, changes to demographies (due to such factors as harvesting, management, genetic modification or environmental change) on population dynamics (Olmsted and Alvarez-Buylla 1995, Shea and Kelly 1998, Mills et al. 1999). Second, we may wish to prospect for particular life stages or demographic rates that would most (or least) affect population dynamics if
changed (Heppell et al. 1996, Caswell 2000, de Kroon et al. 2000). Third, we may wish to look at population dynamics retrospectively, explaining the impacts of observed variation in life history parameters (Brault and Caswell 1993, Dudas et al. 2007).
Given detailed information on lifestage-specific demographic rates, a powerful mathematical framework for prospective and predictive analyses involves the use of linear algebra applied to population projection matrices (PPMs; Caswell 2001). A PPM A is a square matrix with a row (i) and column (j) for each age (Leslie 1945) or stage (Lefkovitch 1965) of the life cycle. Elements ai,j of the PPM represent transitions (probabilities per unit time with
which individuals of the jth stage survive and move into the ith stage) and/or per capita
recruitment of stage i offspring from parents of stage j. Recruitment rates incorporate not only the per-capita production of offspring, but also the survival rates of offspring and/or parents, according to the timing of the census relative to any pulse in reproduction (Caswell 2001). PPMs assume homogeneous demographic rates within each stage, and the dominant
eigenvalue, λmax, of the PPM is an asymptotic measure of the population‟s geometric, density
independent growth rate (Caswell 2001).
Sensitivity and elasticity analyses of PPMs have been widely applied to rank alternative population management strategies (e.g. Crouse et al. 1987, Doak et al. 1994), to group species with similar life history strategies (Silvertown et al. 1992) and to estimate the selection
pressures acting on different demographic rates (Benton and Grant 1996, Caswell 2001, but see Demetrius et al. 2007). Sensitivity is a partial derivative ∂λmax/∂ai,j, estimating the relationship between the asymptotic growth rate, λmax, of a structured population and the degree to which an
element ai,j of its PPM is perturbed (Demetrius 1969, Caswell 2001). A sensitivity matrix S, comprising the sensitivities of λmax to each element aij of the corresponding PPM A, may be calculated as vwT/vTw, where v and w are the left and right eigenvectors, respectively, corresponding to the dominant eigenvalue of A, and superscript T denotes the transpose of a column vector. Elasticity is a similar measure on a logarithmic scale (∂Ln(λmax)/∂Ln(ai,j); de Kroon et al. 1986, Caswell 2001), used to estimate the proportional change in λmax which
results from a proportional change in PPM element ai,j. An elasticity matrix E may be calculated as S○A/λmax, where ○ denotes the Hadamard product (i.e. element-by-element
multiplication). Despite the extensive and varied application of sensitivity and elasticity, they carry a number of assumptions, approximations, and caveats (Wisdom and Mills 1997, de Kroon et al. 2000, Caswell 2001, Hodgson and Townley 2004). Among these is that, for some structures of PPM, the elasticity is mathematically constrained to be greater for some matrix elements (or groups of elements) than for others (Gotelli 1991, de Matos and Silva Matos 1998, Pfister 1998, Caswell 2001). The same is true of the sensitivity (Demetrius 1969, Caswell 2001, Demetrius et al. 2007). For example, Demetrius (1969) showed that the sensitivity to recruitment in a Leslie matrix (an age-structured matrix; Table 1) is a declining function of the parent‟s age if the population‟s asymptotic growth rate is greater than the greatest survival rate of any age class. It has further been shown that the relative elasticities of matrix elements representing different types of demographic transition may depend on the number of stages into which the population is divided; often a rather arbitrary choice (Enright et al. 1995).
METHODS
Generation of randomised matrices
We used the same set of randomised PPMs used in a recent paper on the convexity of eigenvalue-perturbation curves (Carslake et al. 2008). Rather than attempting to reproduce the exact distribution of PPM element values in nature, we chose to simulate them within
biologically realistic limits. Because real-life PPMs are a subset of those permitted by these limits, this allows us to focus on the establishment of rules which should apply universally to PPMs of a given structure.
Seven PPM structures, encompassing most of those used to model real populations, were defined according to the distribution of three types of matrix elements; transition probabilities, recruitment rates and those fixed to equal zero (Table 1). The transition probabilities in any column of a PPM, plus the mortality rate for that stage (not part of the PPM), must be non-negative, and add up to one, since each individual must either survive (and end the projection interval belonging to one of the stages of the PPM) or die. For each column we therefore drew a mortality rate, and a provisional value for each transition probability, from a uniform distribution between 0 and 1. Provisional transition probabilities were then scaled within each column to add up to (1-mortality). Recruitment rates are non-negative, but have no upper bound. We generated random recruitment rates in two steps. First, one recruitment rate at random from each PPM was chosen to have a non-zero value, and the others were chosen with equal probability to be zero or non-zero (in real populations, at least one stage must reproduce, but there are often some non-reproductive stages). Secondly, all non-zero recruitment rates were assigned a value drawn from a gamma distribution with shape parameter 2 and a scale parameter calculated such that the mean sum of recruitment per column was 0.5 (to give a mean λmax of about 1). This distribution was chosen because it met the requirements of being
positive, continuous and without an upper bound. The chosen shape allowed the mean to be kept low (thus keeping the mean λmax close to 1) while permitting occasional higher values.
Because our simulated PPMs did not account for natural covariation between elements (particularly, a commonly observed trade-off between recruitment and survival), it was not possible to include some of the highest recruitment rates found in nature without biasing the mean λmax towards very high values. However, because recruitment rates frequently exceeded
the important threshold of one (distinguishing them from transition probabilities), we believe that the simulated PPMs cover all the important properties of natural PPMs of their structure. We generated 9000 random PPMs of each size (2, 3, 4, 5 and 8 stages) and structure (Table 1). The calculation of sensitivity cannot be assured if a PPM is reducible and/or has ill-conditioned eigenvectors (condition index>108); such PPMs were thus discarded and a replacement was
generated. A PPM A is reducible if, for some element(s) Aij, there exists no positive integer k such that (Ak)ij>0. Populations represented by such PPMs contain stages that cannot contribute, even indirectly, to some other stage. They are thus asymptotically implausible, or include
demographically irrelevant stages (Caswell 2001). An irreducible PPM A is described as primitive if, for some positive integer k, the whole matrix Ak is strictly positive. Irreducible but imprimitive PPMs show cyclically stable asymptotic behaviour (Caswell 2001). They were retained because they are biologically plausible, the sensitivity can always be calculated, and their dominant eigenvalue is a valid descriptor of long-term population growth (describing a running average over the cycle period).
Analysis of generated matrices
6 approximately 4500 simulated matrices of the same size, structure and status (increasing or declining). Within each of these groups, we systematically identified any pairs of non-zero PPM element positions in which the sensitivity or elasticity of one was greater than or equal to that of the other in every simulated matrix.
A consistent result in the pairwise comparison of sensitivity or elasticity between two PPM elements could be due to an inviolable rule that one is greater than or equal to the other. Alternatively, exceptions to the rule could be theoretically possible, but rare enough that they did not occur in any of our simulated PPMs. To distinguish between these, we examined the consistent pairwise results for patterns which were repeated across similar matrix elements, and applied across PPMs of different sizes. These we identified as resulting from putative rules, while isolated pairwise consistencies were more likely to be chance results. Our condition, that one elasticity should be consistently greater than or equal to another, included pairs of
elasticities that were equal in every case. These were additionally noted.
For Leslie, Leslie+ and Progression matrices (Table 1), a comparison was also made of elasticity values summed for all elements representing recruitment (the top row), survival with growth (the first sub-diagonal) or survival without growth (the main diagonal except where it intercepts the first row). In many studies of summed elasticity values, the top-left PPM element represents survival rather than recruitment; we thus repeated the analysis excluding all matrices where this element was greater than 1, and including its elasticity in the sum for survival without growth.
All matrix generation and analysis was carried out in Scilab (INRIA-ENPC 2006) using scripts which are available from the authors. Elasticity and sensitivity data were stored as text files, which involved their rounding to six decimal places.
RESULTS Synthesis of results
Appendices A and B give full lists of the pairs of matrix elements, categorised by PPM dimension, structure (Table 1) and status (increasing or declining), in which the sensitivity or elasticity, respectively, of one element was consistently greater than or equal to (or strictly equal to) that of the other. We identified 204 such pairs for sensitivity and 783 for elasticity. Of these, 125 and 1, respectively, did not fit into any pattern that was consistent across similar matrix elements and PPM sizes, and were thus considered unlikely to derive from inviolable rules. The remainder may be summarised by two rules for sensitivity (Table 2) and twelve for elasticity (Table 3). These rules were further verified by the generation of another 106 PPMs of dimension 5 with the appropriate structure and status, and no exceptions were found. Because the recruitment rates in our simulated PPMs did not reach the very high levels found in some natural populations (see methods), we also simulated 104 PPMs of dimension 5 with each structure and status, in which recruitment was enhanced (to a uniform distribution between 0 and 1000), while survival rates were decreased in order to keep the median λmax close to 1. Again, we found no exceptions to the rules.
Constraints on sensitivity
The sensitivity to recruitment in an increasing population modelled by a Leslie matrix cannot increase with age (rule S1; Table 2). This has already been proven (Caswell 2001). Indeed, the rule applies to any Leslie matrix where λmax is greater than the maximum survival
rate (Demetrius 1969). We found a similar rule (rule S2; Table 2) to be true of Leslie+
matrices, in which the sensitivity to recruitment declined (or was unchanged) with the parent‟s age, up to and including the penultimate age class. To our knowledge, this has not yet been proven mathematically.
In addition to these two candidate rules, we found a large number of pairwise results between matrix elements (marked with asterisks in Appendix A) which applied in every case for a particular size, structure and status (increasing or declining) of PPM, but did not fit consistently into larger-scale patterns for multiple PPM elements and sizes. Of these, the results for increasing Lefkovitch matrices of dimension 8 could most plausibly have derived from a true rule, as they formed a pattern among all PPMs of this size, structure and status. The pattern may be summarised as („rule‟ s3): “In increasing Lefkovitch matrix populations of size 8, the sensitivity to the transition (or recruitment) into any stage from stage 1 is greater than the sensitivity to the transition (or recruitment) into that stage from any other stage”. Several (but not all) pairs of PPM elements also obeyed this „rule‟ among increasing and declining Growth matrix populations of size 8, and increasing Growth matrix populations of size 5. Among increasing Lefkovitch matrix populations of size 5, the equivalent pairwise comparisons yielded near-universal inequalities (data not shown). The inconsistency of conformation to this pattern led us to suspect that it was not mathematically inevitable for increasing Lefkovitch matrix populations of size 8, but rather that exceptions were increasingly improbable for larger PPMs, such that none were found in dimension 8. To verify this, we simulated further
increasing Lefkovitch matrix populations of size 8 indefinitely, until an exception to the „rule‟ was found (after 149868 simulations). The elements of this PPM had values which were not obviously distinct from those of PPMs obeying the 'rule' (Appendix C).
Constraints on elasticity
8 with zero recruitment from stage 2 (de Matos and Silva Matos 1998) and for Leslie matrices (Caswell 2001); subsets of the matrices to which our rules apply.
Rules E2, E5 and E8 (Table 3), applying to Leslie, Leslie+ and Progression matrices, respectively, were also analogous to each other. The elasticity to survival with growth is greater than or equal to the elasticity to recruitment from parents of any later stage. To our knowledge, mathematical proof of this has not been published, although de Matos and Silva Matos (1998) did prove that in Progression matrices with zero recruitment from stage 2, the elasticity to survival with growth from stage 1 to 2 was equal to the sum of elasticities to recruitment from stages 3 and above (and therefore greater than or equal to any one of them). Rules E3, E6 and E9 served to refine rules E2, E5 and E8, respectively. The elasticity to survival with growth into the final stage is equal to the elasticity to recruitment from the final stage (not only "greater than or equal", as required by rules E2, E5 and E8). This is to be expected, since these two demographic processes belong to the same life-cycle "loops", and the elasticities to all processes within a loop are the same (van Groenendael et al. 1994, Caswell 2001).
Rules E10 and E11 (Table 3) applied to particular elements of Growth matrices. Rule E12 was comparable to rules E2, E5 and E8, except that in these Leslie(R) matrices,
recruitment elements were not restricted to the first row. The elasticity to survival with growth was greater than the elasticity to recruitment from parents of larger stages (as in rules E2, E5 and E8), but only for the production of offspring smaller than the new size of the surviving stage.
When the top-left element of the PPM was counted as recruitment, there were no consistent patterns in the relative sums of recruitment (R), survival with growth (G) and survival without growth (S) elements in Leslie, Leslie+ or Progression matrices. For comparison with most published studies, we also tried counting this element as survival without growth, and excluded all matrices where the sum of the first column was greater than 1. We further restricted the analysis to matrices in which there was no recruitment from parents of stage 2. We found, for all Leslie, Leslie+ and Progression matrices, that the summed
elasticities of elements representing survival with growth were greater than those for
DISCUSSION Definition of rules
Our analysis has established some new putative rules regarding the relative magnitude of the sensitivity and elasticity of different elements within a PPM. It supports some already published rules, but challenges others. The rules which we found to be true (Tables 2 and 3) may be grouped into three more general rules. First, the elasticity, but not necessarily the sensitivity, to survival with growth declines with age or stage in Leslie, Leslie+ and
Progression PPMs, with limited compliance in Growth PPMs. Second, the sensitivity, but not necessarily the elasticity, to recruitment declines with parental age in Leslie and Leslie+ PPMs for increasing populations. Third, in Leslie, Leslie+, Progression, Growth and Leslie(R) PPMs, some rates of survival with growth have higher elasticity (but not necessarily sensitivity) than some recruitment rates, usually those from older parents. The first two general rules above were known in Leslie matrices (Demetrius 1969, Caswell 2001), but we believe their extension to other PPM structures, and the third general rule, to be novel. Considered together, the rules indicate that for many models, changes to the demographic rates of older or larger individuals are mathematically constrained to have less impact on population growth than equivalent changes to the demographic rates of younger or smaller individuals. There are two important qualifications to this general conclusion however. First, these rules depend on what we
consider to be equivalent perturbations to different demographic rates; no rules applied to both sensitivity (which would work with equivalent absolute changes in matrix entries) and
elasticity (which would work with equivalent proportional changes in matrix elements). Choices between these two measures can therefore affect the conclusions reached. Second, none of these rules applied to all PPM structures; they became scarcer as PPMs became more complex (contained more demographic transitions, and therefore fewer zeros). The choice of PPM model will affect the constraints on the relative values within the PPM of sensitivity and elasticity.
We hope that the publication of the putative rules in Tables 2 and 3, apparent from large numbers of simulations, will stimulate mathematical work to provide formal proof of their universality. A disadvantage of the simulation approach is that where there is no rule, but a strong tendency for one matrix element to have a greater sensitivity or elasticity than another, simulation may not create any exceptions to the rule even though they are possible. We have therefore taken a cautious approach, considering as putative rules only those results which show consistency across different elements of the same type and/or different sizes of PPM. We chose parameter values in our simulated PPMs to cover a plausible range of values (in
particular, respecting any upper or lower bounds), giving us the greatest possible chance of discovering exceptions to a rule, if they were mathematically possible. Pairwise comparisons which applied to the vast majority of, but not quite all, simulated PPMs (data not shown), or which did not form part of a larger pattern, may still indicate trends which are likely to apply to the vast majority of real PPMs even if they are not mathematically inevitable. However, we focus here on the testing of putative inviolable rules, since the reliable identification of patterns which are nearly universal would require the simulation of the exact distribution, and
covariation, of PPM elements. This in turn would require a major meta-analysis of published PPMs from real populations.
10 and less than or equal to, the elasticity to recruitment from stage 2. Since a Growth matrix of dimension 2 is identical in structure to a Leslie+ matrix, rule E6 confirms that these two elements are do indeed have equal elasticities. Similarly, rule E12 in dimension 2 Leslie(R) PPMs requires that survival with growth has an elasticity that is greater than or equal to the elasticity to recruitment from stage 2. The two elasticities are in fact equal in every case (Appendix B). This is unsurprising given that rule E6 demands the equality of these two
elasticities in Leslie+ PPMs, and that Leslie+ and Leslie(R) matrices of dimension 2 differ only in that the bottom right-hand element is a transition in the former and a recruitment rate in the latter.
It should be pointed out that the sequence of stages in a stage-structured PPM can be a somewhat arbitrary choice (although one sequence is usually suggested by the predominant life-history pathway). For example, there is no mathematical reason why a size 5 Progression matrix could not be redrawn with "stage 4" in the fifth row and column and "stage 5" in the fourth. The two PPMs would represent identical life histories but, by our definitions (Table 1), the new one would be a Lefkovitch matrix. It thus follows that the rules we, and others,
describe for the patterns of sensitivity and elasticity among PPMs of a certain structure apply also to any PPM which is capable of being rearranged into that structure except that, of course, the sequence of elements for which the sensitivity or elasticity changes monotonically, is not the sequence in which they appear in the PPM. Further, we conclude that in a PPM with no constraints but positivity (a structure we do not consider), „rules‟ requiring a monotonic trend in the sensitivity or elasticity with increasing stage number (e.g. S1, S2, E1, E4, E7) are impossible, since the PPM could be rearranged into another of the same structural class (i.e., having no constraints but positivity), for which the sensitivity and elasticity matrices would be similarly rearranged, making the maintenance of a monotonic trend impossible. Our Growth(R) and Lefkovitch PPMs are almost unconstrained (no element being fixed at zero, but some having an upper bound of 1), so it is not surprising that we found no universal monotonic trends in sensitivity or elasticity for these structures.
Comparisons with published rules
Our results supported most of the published rules, as noted in the results section, but appeared to contradict three published statements about the distribution of sensitivity or elasticity within a PPM. First, Demetrius et al. (2007), citing Hamilton (1966), state that in a Leslie matrix, the sensitivity to survival is a decreasing function of age. We found exceptions to this, and suspect that the authors omitted the necessary condition that survival itself must be an increasing function of age (Demetrius 1969). Second, Caswell (2001) states that in a Leslie matrix, the elasticity to recruitment first increases, and then decreases, with parents of
increasing age. As well as these postulated humped distributions, we found monotonic
declines, monotonic increases and inverse humped distributions of the elasticity to recruitment with respect to age. Finally, Gotelli (1991) stated that when the top-left element of a
Progression PPM (Table 1) was counted as survival without growth, and recruitment from stage 2 parents was zero, the summed elasticities were always in the order survival (without growth)>growth>recruitment. We restricted our results for Progression matrices to those matching Gotelli‟s (1991) parameters, and found only that growth>recruitment (de Matos and Silva Matos 1998). There was some ambiguity in the statement of these rules and the
conditions under which they apply, which might explain the apparent contradiction with our results. We would recommend absolute clarity in any future description of rules, and also that any putative rules be checked using large numbers of simulations, in the manner we describe in the present study.
increases with age, and Caswell (2001) states that the sensitivity to recruitment in a Leslie matrix increases from one age class of parent to the next if the survival rate of the younger age class is greater than λmax. These rules may nonetheless be useful for PPMs which meet their
specific conditions, and our approach could be used to test them. Similarly, the elements of a PPM are usually calculated as some function of underlying vital rates, to which sensitivities and elasticities may be calculated (Caswell 2001). The huge variety of possible vital rates and their conversion into PPM elements prevents a comprehensive investigation of any constraints on the relative values of their sensitivities and elasticities, but we would encourage the
application of our approach on a case-by-case basis.
Implications of the rules
In some cases where sensitivity or elasticity is used to compare alternative population management strategies (de Kroon et al. 2000; Heppell et al. 2000), the superior strategy may be determined by the structure of the PPM, regardless of the values of the non-zero demographic rates within it. For example, if an increasing population were modelled by a Leslie matrix, sensitivity analysis would always indicate that increasing recruitment from younger parents would have a greater effect on asymptotic population growth than an equal increase in
recruitment from older ones (rule S1; Table 2). Similarly, elasticity analysis of a Leslie matrix inevitably concludes that management strategies improving survival are best applied to the youngest age class (rule E1; Table 3). Elasticity conclusions such as those of Grenier et al. (2007) - that survival in the first year of a black-footed ferret's life is more important to its life history than later survival - are predetermined by the choice of PPM structure. Further,
recruitment from parents belonging to the youngest age class (and thus the elasticity to this parameter) is often zero. In this case, survival of the youngest age class has an elasticity that is necessarily greater than (or equal to) any other elasticity in a Leslie matrix (rules E1 and E2; Table 3).
It is critical to ask whether such potential independence of a population's optimal management strategy from its stage-specific vital rates is a true biological rule, or a modelling artefact. The former would be a useful general principle in population management, allowing management prescriptions even in the absence of detailed demographic data. The latter would invalidate the use of sensitivity or elasticity analysis in such cases. If the structured dynamics of the population conform exactly to the PPM model used (i.e. if demographic rates are homogeneous within each class, and PPM elements constrained to equal zero represent processes which never occur), then this mathematical pattern must be a biological rule. However, it is unlikely that demographic rates are exactly homogeneous within any stage of any population. The more the assumptions are violated, the more our rules about relative values of sensitivity and elasticity become artefacts rather than biological truths. This emphasises the importance of choosing a structured population model which is appropriate to the population in question, rather than squeezing the population into an ill-fitting model. It should also be noted that sensitivity and elasticity analysis predict the effect of small perturbations; nonlinearity in the response of λmax to PPM element perturbations can become increasingly important for
larger perturbations (Hodgson and Townley 2004; McCarthy et al. 2008).
We confirmed the finding of de Matos and Silva Matos (1998) that when elasticities for different types of demographic rate are summed for recruitment, survival without growth, and survival with growth, in a matrix similar to our Progression matrices, the sum for survival with growth must be greater than that for recruitment. As a consequence of this and other constraints (de Matos and Silva Matos 1998), a large area of parameter space is inaccessible when
12 Enright et al. (1995) suggested that the dimension of a PPM could have important effects on the relative elasticity of its elements. In increasing Lefkovitch matrices of dimension 8, we found that transitions into any stage from stage 1 always had a greater sensitivity than transitions into that stage from any other stage (excepting survival without growth; see 'rule' s3 in results). This 'rule' was universal for matrices of dimension 8, nearly universal for dimension 5, and increasingly broken in smaller matrices. Further simulation of dimension 8 Lefkovitch matrices proved that exceptions to the pattern were possible, but extremely rare. This
relationship between the dimension of a PPM and compliance with a rule regarding the relative sensitivity of its elements suggests that the assertion of Enright et al. (1995) may also apply to sensitivity. PPM models in which the stages are arbitrarily chosen, rather than reflecting homogeneous groups of individuals, risk giving misleading results.
An illustrative example
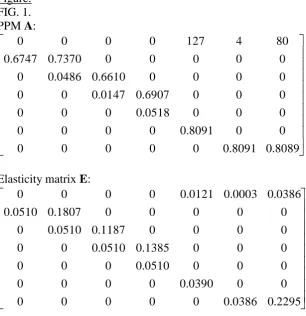
Crouse et al. (1987) modelled the dynamics of the loggerhead sea turtle Caretta caretta, in order to compare alternative conservation measures. Their PPM (Fig. 1) was similar to our Progression matrices (Table 1), except that some transitions (which we drew from a
distribution strictly greater than zero) were constrained to equal zero. 10,000 simulations of their precise PPM structure confirmed that this minor difference did not prevent PPMs of this structure from consistently obeying rules E7, E8 and E9 (Table 3). The elasticity to survival with growth in the turtle PPM never increases with increasing stage number (rule E7), and the elasticity to survival with growth from any stage is greater than or equal to the elasticity to recruitment from any subsequent stage (rule E8). The elasticity to survival with growth from the penultimate to the last stage is equal to the elasticity to recruitment from the final stage (rule E9). Further, because the top left-hand element of the PPM is less than one and the recruitment from stage 2 is zero, the summed elasticity for elements representing survival with growth must exceed that of elements representing recruitment (see results). From their
elasticity analysis of the PPM, Crouse et al. (1987) concluded that survival contributes more than recruitment to population growth, and therefore that conservation efforts would be better directed at preventing fisheries bycatch than at promoting hatching success. Our results (recapitulated above) show that these conclusions were inevitable, given the structure of the PPM. Whether this reflects biological reality or a modelling artefact depends in part on how well the population's dynamics fit the PPM model chosen, an issue given substantial
consideration by Crouse et al. (1987) The failure of nesting beach protection to improve population growth rates (Crouse et al. 1987) and the emphasis on improving survival rates in subsequent studies (Crowder et al. 1994) suggests that the findings are realistic.
Conclusions
When structured PPM models, particularly the simpler ones with fewer non-zero elements, are fitted to populations, there are constraints in the relative values of sensitivity and elasticity of different matrix elements. We list these for a range of the most commonly-used PPM structures (Table 2, Table 3). If the distribution of survival and recruitment rates among members of the population corresponds to the model chosen, then this indicates that changes to some of these demographic rates will indeed have a greater influence on asymptotic growth rate, than changes to others. However, if the fitting of the chosen model represents a gross simplification of a more complex real population, then sensitivities and elasticities will be artefactually constrained, and their interpretation could lead to false predictions.
In this study, we did not attempt to reproduce exactly the distribution and covariation of PPM parameter values found in nature. Rather, we drew random variables from distributions with realistic ranges, paying particular attention to any upper or lower bounds. Patterns applying to every simulated matrix of a particular structure were thus candidates to be
but available from the authors). These clearly cannot be rules, but might apply to the vast majority of real populations. Resolution of this more subtle question by simulation would require knowledge of the exact distributions and covariation of PPM elements in real
populations. Pfister (1998) made a direct search among published PPMs for universal patterns in sensitivity and elasticity, but with only 30 populations. As the number of populations that have been described by PPMs grows, so does the potential for meta-analyses examining large collections of real PPMs for patterns that are universal among them.
ACKNOWLEDGEMENTS
Work was funded by NERC, the European Social Fund and the University of Exeter. We would like to thank Dominic McCarthy for interesting discussions on the sensitivity of eigenvalues. Comments from Lewi Stone and two anonymous referees greatly improved the manuscript.
LITERATURE CITED
Benton, T. G., and A. Grant. 1996. How to keep fit in the real world: Elasticity analyses and selection pressures on life histories ln a variable environment. American Naturalist 147:115-139.
Brault, S., and H. Caswell. 1993. Pod-specific demography of killer whales (Orcinus orca). Ecology 74:1444-1454.
Carslake, D., S. Townley, and D. J. Hodgson. 2008. Nonlinearity in eigenvalue-perturbation curves of simulated population projection matrices. Theoretical Population Biology 73:498-505.
Caswell, H. 2000. Prospective and retrospective perturbation analyses: their roles in conservation biology. Ecology 81:619-627.
Caswell, H. 2001. Matrix population models: construction, analysis, and interpretation. Second edition. Sinauer Associates, Sunderland, Mass.
Crouse, D. T., L. B. Crowder, and H. Caswell. 1987. A stage-based population model for loggerhead sea turtles and implications for conservation. Ecology 68:1412-1423.
Crowder, L. B., D. T. Crouse, S. S. Heppell, and T. H. Martin. 1994. Predicting the impact of turtle excluder devices on loggerhead sea-turtle populations. Ecological Applications 4:437-445.
de Kroon, H., A. Plaisier, J. van Groenendael, and H. Caswell. 1986. Elasticity: The relative contribution of demographic parameters to population growth rate. Ecology 67:1427-1431. de Kroon, H., J. van Groenendael, and J. Ehrlen. 2000. Elasticities: A review of methods and
model limitations. Ecology 81:607-618.
de Matos, M. B., and D. M. Silva Matos. 1998. Mathematical constraints on transition matrix elasticity analysis. Journal of Ecology 86:706-708.
Demetrius, L. 1969. The sensitivity of population growth rate to perturbations in the life cycle components. Mathematical Biosciences 4:129-136.
Demetrius, L., V. M. Gundlach, and M. Ziehe. 2007. Darwinian fitness and the intensity of natural selection: studies in sensitivity analysis. Journal of Theoretical Biology 249:641-653.
Doak, D., P. Kareiva, and B. Kleptetka. 1994. Modeling population viability for the desert tortoise in the western Mojave desert. Ecological Applications 4:446-460.
Dudas, S. E., J. F. Dower, and B. R. Anholti. 2007. Invasion dynamics of the varnish clam (Nuttallia obscurata): A matrix demographic modeling approach. Ecology 88:2084-2093. Enright, N. J., M. Franco, and J. Silvertown. 1995. Comparing plant life histories using
elasticity analysis: the importance of life span and the number of life-cycle stages. Oecologia 104:79-84.
14 Gorgonian. Ecology 72:457-467.
Grenier, M. B., D. B. McDonald, and S. W. Buskirk. 2007. Rapid population growth of a critically endangered carnivore. Science 317:779-779.
Hamilton, W. D. 1966. Moulding of senescence by natural selection. Journal of Theoretical Biology 12:12-45.
Heppell, S. S., L. B. Crowder, and D. T. Crouse. 1996. Models to evaluate headstarting as a management tool for long-lived turtles. Ecological Applications 6:556-565.
Heppell, S. S., H. Caswell, and L. B. Crowder. 2000. Life histories and elasticity patterns: perturbation analysis for species with minimal demographic data. Ecology 81:654-665. Hodgson, D. J., and S. Townley. 2004. Linking management changes to population dynamic
responses: the transfer function of a projection matrix perturbation. Journal of Applied Ecology 41:1155-1161.
INRIA-ENPC. 2006. Scilab (Version 4.1). URL http://www.scilab.org/.
Lefkovitch, L. P. 1965. Study of population growth in organisms grouped by stages. Biometrics 21:1-18.
Leslie, P. H. 1945. On the use of matrices in certain population mathematics. Biometrika 33:183-212.
McCarthy, D., S. Townley, and D. Hodgson. 2008. On second order sensitivity for stage-based population projection matrix models. Theoretical Population Biology,
doi:10.1016/j.tpb.2008.04.008
Mills, L. S., D. F. Doak, and M. J. Wisdom. 1999. Reliability of conservation actions based on elasticity analysis of matrix models. Conservation Biology 13:815-829.
Olmsted, I., and E. R. Alvarez-Buylla. 1995. Sustainable harvesting of tropical trees:
demography and matrix models of two palm species in Mexico. Ecological Applications 5:484-500.
Pfister, C. A. 1998. Patterns of variance in stage-structured populations: evolutionary
predictions and ecological implications. Proceedings of the National Academy of Sciences of the United States of America 95:213-218.
Shea, K., and D. Kelly. 1998. Estimating biocontrol agent impact with matrix models: Carduus nutans in New Zealand. Ecological Applications 8:824-832.
Silvertown, J., M. Franco, and K. McConway. 1992. A demographic interpretation of Grime's triangle. Functional Ecology 6:130-136.
van Groenendael, J., H. de Kroon, S. Kalisz, and S. Tuljapurkar. 1994. Loop analysis:
evaluating life history pathways in population projection matrices. Ecology 75:2410-2415. Wisdom, M. J., and L. S. Mills. 1997. Sensitivity analysis to guide population recovery:
prairie-chickens as an example. Journal of Wildlife Management 61:302-312. APPENDIX A
Pairwise comparisons between PPM elements for which the sensitivity of one element was consistently greater than or equal to that of the other are available are available in ESA's Electronic Data Archive: Ecological Archives.
APPENDIX B
Pairwise comparisons between PPM elements for which the elasticity of one element was consistently greater than or equal to that of the other are available are available in ESA's Electronic Data Archive: Ecological Archives.
APPENDIX C
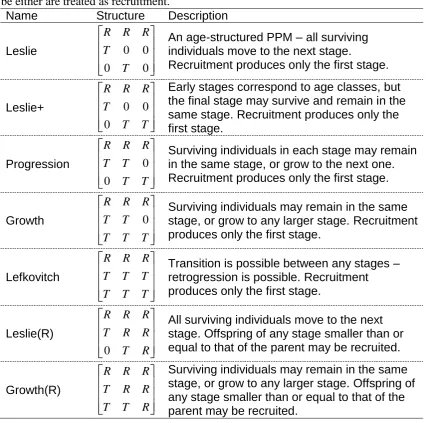
TABLE 1. The seven PPM structures simulated. Examples are given with dimension 3; matrices were simulated with dimensions of 2, 3, 4, 5 and 8. R, T and 0 represent recruitment, transition and zero elements respectively. Since the distribution of simulated transition
probabilities falls within the distribution of simulated recruitment rates, elements which could be either are treated as recruitment.
Name Structure Description
Leslie 0 0 0 0 T T R R
R An age-structured PPM – all surviving
individuals move to the next stage.
Recruitment produces only the first stage.
Leslie+ T T T R R R 0 0 0
Early stages correspond to age classes, but the final stage may survive and remain in the same stage. Recruitment produces only the first stage. Progression T T T T R R R 0 0
Surviving individuals in each stage may remain in the same stage, or grow to the next one. Recruitment produces only the first stage.
Growth T T T T T R R R 0
Surviving individuals may remain in the same stage, or grow to any larger stage. Recruitment produces only the first stage.
Lefkovitch T T T T T T R R
R Transition is possible between any stages –
retrogression is possible. Recruitment produces only the first stage.
Leslie(R) R T R R T R R R 0
All surviving individuals move to the next stage. Offspring of any stage smaller than or equal to that of the parent may be recruited.
Growth(R) R T T R R T R R
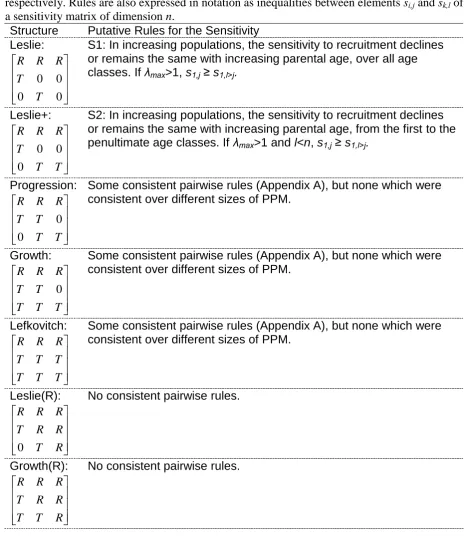
16 TABLE 2. Putative rules concerning the relative magnitude of the sensitivity within seven structures of PPM. Rules applied to matrices with all simulated dimensions (2, 3, 4, 5 and 8) and were true of all replicates. R, T and 0 represent recruitment, transition and zero elements respectively. Rules are also expressed in notation as inequalities between elements si,j and sk,l of
a sensitivity matrix of dimension n.
Structure Putative Rules for the Sensitivity Leslie: 0 0 0 0 T T R R R
S1: In increasing populations, the sensitivity to recruitment declines or remains the same with increasing parental age, over all age classes. If λmax>1, s1,j ≥ s1,l>j.
Leslie+: T T T R R R 0 0 0
S2: In increasing populations, the sensitivity to recruitment declines or remains the same with increasing parental age, from the first to the penultimate age classes. If λmax>1 and l<n, s1,j ≥ s1,l>j.
Progression: T T T T R R R 0 0
Some consistent pairwise rules (Appendix A), but none which were consistent over different sizes of PPM.
Growth: T T T T T R R R 0
Some consistent pairwise rules (Appendix A), but none which were consistent over different sizes of PPM.
Lefkovitch: T T T T T T R R R
Some consistent pairwise rules (Appendix A), but none which were consistent over different sizes of PPM.
Leslie(R): R T R R T R R R 0
No consistent pairwise rules.
Growth(R): R T T R R T R R R
TABLE 3. Putative rules concerning the relative magnitude of the elasticity within seven structures of PPM. Rules applied to matrices with all simulated dimensions (2, 3, 4, 5 and 8) except where stated otherwise, and were true of all replicates, regardless of the magnitude of λmax. R, T and 0 represent recruitment, transition and zero elements respectively. Rules are also
expressed in notation as inequalities between non-zero elements ei,j and ek,l of an elasticity
matrix of dimension n.
Structure Putative Rules for the Elasticity Leslie: 0 0 0 0 T T R R R
E1: The elasticity to survival declines or remains the same with age.
ei,i-1 ≥ ek>i,k-1.
E2: The elasticity to survival from any age class is greater than or equal to the elasticity to recruitment from any older class. ei,i-1 ≥ e1,l≥i. E3 (refinining E2): The elasticity to survival with growth into the oldest age class is equal to the elasticity to recruitment from the oldest age class. en,n-1 =e1,n.
Leslie+: T T T R R R 0 0 0
E4: The elasticity to survival with growth declines or remains the same with age. ei,i-1 ≥ ek>i,k-1.
E5: The elasticity to survival from any age class is greater than or equal to the elasticity to recruitment from any older class. ei,i-1 ≥ e1,l≥i. E6 (refining E5): The elasticity to survival with growth into the oldest age class is equal to the elasticity to recruitment from the oldest age class.
en,n-1 =e1,n.
Progression: T T T T R R R 0 0
E7: The elasticity to survival with growth declines or remains the same with increasing stage number. ei,i-1 ≥ ek>i,k-1.
E8: The elasticity to survival with growth from any stage is greater than or equal to the elasticity to recruitment from any subsequent stage. ei,i-1 ≥ e1,l≥i.
E9 (refining E8): The elasticity to survival with growth into the oldest age class is equal to the elasticity to recruitment from the oldest age class. en,n-1 =e1,n.
Growth: T T T T T R R R 0
E10: The elasticity to survival with growth from stage 1 to 2 is greater than or equal to that to any recruitment or transition from stage 2, except survival without growth. e2,1 ≥ ek≠2,2.
E11: The elasticity to recruitment from the largest stage is greater than or equal to the elasticity to growth into the largest stage from any smaller stage. e1,n ≥ en,l<n.
Lefkovitch: T T T T T T R R R
No consistent rules.
Leslie(R): R T R R T R R R 0
E12: The elasticity to survival into stage i from stage j is greater than or equal to the elasticity to recruitment from stages larger than j, producing offspring smaller than stage i. ei,j=i-1 ≥ ek<i,l>j.
18 R
T T
R R T
Figure Legend:
[image:20.595.71.378.132.449.2]FIG. 1. PPM and elasticity matrix for the loggerhead sea turtle Caretta caretta (Crouse et al. 1987). Figure: FIG. 1. PPM A: 8089 . 0 8091 . 0 0 0 0 0 0 0 0 8091 . 0 0 0 0 0 0 0 0 0518 . 0 0 0 0 0 0 0 6907 . 0 0147 . 0 0 0 0 0 0 0 6610 . 0 0486 . 0 0 0 0 0 0 0 7370 . 0 6747 . 0 80 4 127 0 0 0 0
Elasticity matrix E: