Optimizing the large scale renovation strategy
148
0
0
Full text
(2) Title. External company. External supervisor. Supervisor UT Twente Second reader. Optimizing the large-scale renovation strategy Witteveen+Bos Raadgevende ingenieurs B.V. Van Twickelostraat 2 Postbus 233 7400 AE Deventer MSc. I. Snijders Blok Dr. F.H.J.M. Coenen MSc. I. Lammers. Contact. Jarich (Rick) Dijkstra s2032341 University of Twente Master of Environmental and Energy Management [email protected]. Cover photo. Beek, 2015. Author Student number University Programme. 2.
(3) PREFACE This master thesis ‘Optimizing the large-scale renovation strategy’ has been written as part of the Master Environmental and Energy Management at the University of Twente. I conducted this research at the request of Witteveen+Bos Raadgevende ingenieurs B.V. I was engaged in this research from April to August, 2018. During the past five months I gained a lot of experience and knowledge with regard to the building environment. I would like to thank Iris for her instructive guidance and for contributing to my graduation research. Furthermore, I would like to thank Koen Haans and Bert van Dorp for giving me the chance to carry out this assignment. I also wish to thank all the people from Witteveen+Bos who were involved in this research. Finally, I would like to thank my supervisor Dr. Frans Coenen from the University of Twente for the guidance and feedback during the graduation period. Jarich (Rick) Dijkstra Deventer, August 2018.. 3.
(4) ABSTRACT The building sector represents a large potential for energy savings and CO2 reductions. This sector (residential and non-residential use) accounts for 30% of the global energy consumption and 25-33% of the CO2-emissions. To limit the CO2-emissions and realize an energy neutral building stock by 2050, a reduction in the energy demand and a transition from fossil fuels to sustainable energy sources is needed in the building sector. This research focuses on the residential building stock. By improving the energy performance of buildings significant steps can be made in order to achieve the climate and energy targets. For new houses this transition is easier to be made. However, the real challenge lies in the renovation of existing houses. At the moment various stakeholders such as home-owners, housing corporations and municipalities struggle to renovate the existing building stock in order to improve the energy performance and reduce the energy consumption. In short, there is a lack of knowledge, building capacity and investments in order to renovate the existing housing stock in a short amount of time. Currently, the renovation pace is too low in order to reach the goals of 2050. Not only do they struggle to increase the renovation pace, reaching the targets also requires a huge investment. On top of that, renovation projects require different skills, experience and knowledge regarding technical, economic and social aspects compared to new construction projects. Although there is a great understanding of existing renovation practices, there is a lack in knowledge and insight in the various aspects which affect this decision making and how an optimal renovation strategy can be established based on this information. Analysing and predicting the energy performance combined with energy savings of existing buildings on a large scale can aid the decision process of large-scale renovation strategies. Models can be of great use by quantifying this needed information. Witteveen+Bos is looking for such a new model that can be used in order to advise stakeholders, such as housing corporations or municipalities. This research tried to provide more insight into these aspects by answering the following research question: How can the large-scale renovation strategy of existing houses be optimized by predicting the energy performance and proposing renovation strategies by using a model, particularly in the Netherlands? The goal of this thesis was to give insight into how the large-scale renovation strategy can be optimized with the use of a model. This model should predict the energy performance and propose suitable largescale renovation strategies. In order to do so, insight was needed in energy performance parameters and the large-scale renovation strategies. Although the thesis mainly focused on designing a model based on building related characteristics, insight was needed in the general renovation process. Therefore, the total spectrum regarding energy performance parameters and parameters influencing the decision-making process for an optimal large-scale renovation strategy were analysed. This was done based on the existing literature, reference projects and expert judgement. The research shows that there is no “universal” optimal large-scale renovation strategy, which can be used to improve the entire existing housing stock. The decision-making process for choosing an optimal largescale renovation strategy is too dependent on the characteristics of the specific situation. In any decisionmaking process, whether this is done by a housing corporation, municipality or a single home-owner, there is a wide variety of possible renovation strategies that can be considered and it is not easy to select the optimal one. The decision-process for renovation projects includes many bottlenecks such as changes in consumption behaviour, ability to change the appearance, building conditions, type of ownership and energy performance. The selection process of an optimal large-scale renovation strategy can be seen as a trade-off between ambitions and requirements of the relevant actors (e.g. homeowners and housing corporations), the financial investment needed and the benefits obtained from that renovation strategy, constrained by the relevant parameters.. 4.
(5) In order to simplify and facilitate this decision-making process for stakeholders like housing corporations or municipalities, a model framework was designed. This model framework is based on the combination of various tools and models and can be seen as a decision-support instrument. The instrument can be used by Witteveen+Bos to assimilate key information of individual buildings and lift this to a larger scale (e.g. district level). In this way insight can be given in the energy performance and the possibilities of applying a largescale renovation strategy for existing houses on a district level. This insight can be used by stakeholders like housing corporations or municipalities to facilitate the decision-making process with regard to the improvement of the existing housing stock. The advantage of the proposed model framework is that it can provide a quick analysis of the energy performance and opportunities for applying certain large-scale renovation strategies. With the use of a case study, the tools and models were tested by using three possible renovation scenarios. The case study shows that the potential for applying a large-scale renovation strategy differs, based on the building characteristics, type of housing, energy demand and performance. Although the presented information can be of use to these stakeholders, the proposed model framework is limited to building characteristics. In practice, there are various types of ownership, household compositions and constellations of actors and initiators present and relevant in large-scale renovations. These aspects are also related to the energy performance and have to be considered in large-scale renovation projects. Integrating these household and socio-economic characteristics into the model framework could provide more insight into the possibilities for applying a large-scale renovation strategy. In addition, adding active measures into the optimization tool can give more insight into the optimal large-scale renovation strategy. Active measures such as solar PV, heat pumps and district heating are key to realizing an energy neutral housing stock. On top of that, using a life-cycle costs analysis in the model framework can provide a different financial overview. This can be used to determine an optimal renovation budget. Other aspects, such as benchmarking the results of the GIS-tool with registered data and testing the tools and models in multiple cases are important as well. This can result in a better understanding of the reliability of the designed tools and models.. 5.
(6) TABLE OF CONTENTS 1. Introduction. 10. 1.1. Problem statement. 10. 1.2. Research objective and question. 12. 1.3. Reading guide. 12. 2. Research strategy and method. 13. 2.1. Research framework. 13. 2.2. Research questions. 13. 2.3. Defining key concepts. 14. 2.4. Research strategy and method. 14. 2.5. Ethics. 17. 3. Energy performance parameters 3.1. 3.2. 3.3. 4. Determining the energy performance on an individual building level. 18 18. 3.1.1. Energy performance according to the EPBD. 18. 3.1.2. Energy performance according to the Energy Label. 19. 3.1.3. Energy performance according to the EI. 19. 3.1.4. Energy performance according to the EPC and BENG standards. 20. 3.1.5. Differences in energy consumption predictions and actual energy consumption. 20. Energy performance parameters on a district and city scale. 24. 3.2.2. Top-down models. 25. 3.2.3. Bottom-up models. 25. Sub-conclusion. The optimal large-scale renovation strategy. 28. 29. 4.1. Definitions of renovation. 29. 4.2. Renovating the existing housing stock. 30. 4.3. 4.4. 5. 4.2.1. Renovation measures. 30. 4.2.2. Renovation strategies - design principles. 31. 4.2.3. Large-scale renovation strategies – example projects. 32. Finding an optimal large-scale renovation strategy 4.3.1. The decision-making process. 36. 4.3.2. Parameters influencing the decision-making process. 37. Sub-conclusion. Designing the model framework 5.1. 35. Design approach. 43. 44 44. 5.1.1. Proposed model framework. 44. 5.1.2. GIS-tool. 45. 5.1.3. Energy performance predictive model. 46 6.
(7) 5.1.4. 5.2. 6 6.1. 50. Sub-conclusion. 55. Testing the model. 56. Description case study 6.1.1. 6.2. Optimization tool large-scale renovation strategy. Available datasets. Results case study. 56 57. 58. 6.2.1. GIS tool. 58. 6.2.2. Energy performance predictive model. 61. 6.2.3. Optimization tool. 65. 6.3. Improvements. 68. 6.4. Sub-conclusion. 71. 7. Conclusion, discussion and recommendations. 72. 7.1. Conclusion. 72. 7.2. Discussion. 73. 7.3. Recommendations. 74. References. 75. I. Research framework and consulted experts. 85. II. Calculation methods energy performance indicators. 86. III. Bottom-up models - model frameworks. 92. IV. Applied measures and energy performance. 94. V. The current renovation state. 98. VI. Assessment framework. 101. VII Model framework. 102. VIII Energy use in buildings. 109. IX. Existing datasets. 112. X. Results testcase Eindhoven. 115. XI. Technical explanations. 135. XII Description renovation strategies. 136. XIII Transcription interview. 137. 7.
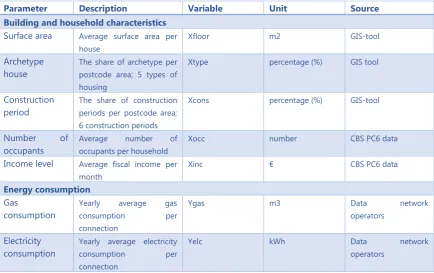
(8) LIST OF FIGURES Figure 1.1 Global energy usage Figure 3.1 Actual and theoretical gas consumption per energy label Figure 3.2 Actual and theoretical gas consumption per energy label Figure 3.3 Energy consumption per archetype Figure 3.4 The relation with the rebound and pre-bound effects and energy savings Figure 3.5 Differences in heating demand per housing block Figure 3.6 Top-down and bottom-up techniques for determining energy consumption Figure 3.7 Predicted energy usage in New York on different levels Figure 4.1 Definitions according to the level of intervention Figure 4.2 Renovation measures according to the Trias Energetica steps Figure 4.3 Different renovation strategies categorized by intervention type Figure 6.1 Research area case study Figure 6.2 Various types of houses in Kerkdorp Acht based on the GIS-tool Figure 6.3 Example Amerlaan 21 and 23 Figure 6.4 Example Eckartseweg Zuid 388 Figure 6.5 Example Sint Claralaan 38 Figure 6.6 Result GIS tool (left) and actual building (right) Figure 6.7 Results predicted gas demand by the statistical model, 2010 Figure 6.8 Results predicted electricity demand by the statistical model, 2010 Figure 6.9 Results predicted gas demand by the uniform model, 2010 Figure 6.10 Results predicted gas demand by the uniform model, 2010 Figure 6.11 Average costs, CO2 footprint and reduced gas consumption per house Figure I.1 Research framework Figure II.1 Schematic overview of the energy performance calculation Figure III.1 Framework of the model Figure III.2 Framework method Energy atlas Figure III.3 Model framework bottom-up GIS-tool Figure IV.1 Illustration second facade Figure IV.2 Comparison renovation approaches and energy demand Figure V.1 Housing stock in the Netherlands Figure V.2 Distribution energy labels among the housing stock in the Netherlands Figure V.3 Number of taken insulation measures Figure V.4 Number of taken installation measures Figure V.5 Development towards the Energy Index target Figure VI.1 Assessment framework Figure VII.1 Model framework Figure VII.2 Flowchart GIS-tool Figure VII.3 Reference houses Figure VII.4 Reference building conditions elaboration Figure VIII.1 Energy usage per function in buildings) Figure VIII.2 Energy trends buildings Figure VIII.3 Primary and secondary energy mix households in the Netherlands Figure VIII.4 Energy usage per function Figure VIII.5 Share of renewable sources for heating in the Netherlands Figure IX.1 Certified energy lables Figure IX.2 Measured energy performance Figure IX.3 Construction periods Figure X.1 Archetypes Eindhoven produced with the GIS-tool Figure X.2 Archetypes district Kerkdorp Acht produced with the GIS-tool Figure X.3 Sub types of housing district Kerkdorp Acht produced with the GIS-tool Figure X.4 Predicted gas demand by the statistical model Figure X.5 Predicted electricity demand by the statistical model. 10 21 22 22 24 24 25 26 29 31 32 57 59 60 60 60 61 63 63 64 64 67 85 87 92 92 93 94 97 98 98 99 100 100 101 102 103 104 107 109 109 110 110 111 112 113 114 115 116 117 118 119 8.
(9) Figure X.6 Predicted energy performance indicated by energy labels (based on the statistical model) Figure X.7 Predicted gas demand by the uniform model Figure X.8 Predicted electricity demand by the uniform model Figure X.9 Predicted energy performance by the uniform model Figure X.10 Calculated potential energy reduction scenario I by the optimization tool Figure X.11 Calculated potential energy reduction scenario II by the optimization tool Figure X.12 Calculated potential energy reduction scenario III by the optimization tool Figure X.13 Potential large-scale renovation strategy scenario I Figure X.14 Potential large-scale renovation strategy scenario II Figure X.15 Potential large-scale renovation strategy scenario III Figure XIII.1 Informed consent. 120 121 122 123 124 125 126 127 128 129 148. LIST OF TABLES Table 2.1 Research method sub-question 1 Table 2.2 Research method sub-question 2 Table 2.3 Research method sub-question 3 Table 2.4 Research method sub-question 4 Table 3.1 Difference energy performance methods Table 3.2 Parameters related to the energy performance Table 4.1 Applied renovation measures Melick Table 4.2 Applied measures Siboldus street Table 4.3 Applied measures Nieuwkuijk Table 4.4 Applied measures Heerhugowaard Table 4.5 Applied measures Hof van Egmond Table 4.6 Applied measures Philipsdorp Table 4.7 Key parameters influencing renovation strategies Table 4.8 Building requirements past decades Table 4.9 Energy labels and minimum requirements insulation Table 5.1 Preconditions identification type of housing Table 5.2 Parameters influencing the energy demand and performance Table 5.3 Input data regression model aggregated on postcode 5 area Table 5.4 Housing typologies (Agentschap NL, 2011b) Table 5.5 ELG and related energy label (Gaalen & Staal-Guijt, 2014b) Table 5.6 Renovation measures Table 5.7 Categorization target groups Table 6.1 Building characteristics Eindhoven compared to the average in the Netherlands, 2017 Table 6.2 Registered energy labels Kerkdorp Acht Table 6.3 Results type of houses GIS-tool and measured data 2017) Table 6.4 Results regression model gas demand (R2 =0,398) Table 6.5 Results regression model electricity demand (R2 = 0,370) Table 6.6 Insulation values applied measures scenario I Table 6.7 Insulation values applied measures scenario II Table 6.8 Insulation values applied measures scenario III Table 6.9 Comparison applied measures for each renovation scenario Table I.1 Consulted experts Table II.1 ELG and related energy label Table II.2 Definition formula EI Table II.3 Input parameters definitive energy label Table II.4 Relation energy label, EI and energy consumption for houses Table VII.1Reference values renovation measures Table VII.2 Reference energy values Table XII.1 Description renovation strategies. 15 16 16 17 18 28 32 33 33 34 34 35 37 39 40 46 47 48 48 49 51 55 57 58 59 62 62 65 66 66 67 85 88 88 91 91 105 108 136. 9.
(10) 1 1.1. INTRODUCTION Problem statement. To achieve the aim of the new climate agreement, to limit global warming to well below 2 degrees Celsius, the CO2emissions must be reduced drastically. In order to realize this, a reduction in the energy demand and a transition from fossil fuels to sustainable energy sources is needed. The building sector represents a large potential for energy savings and CO2 reductions. The building sector (residential and non-residential use) accounts for 30% of the global energy consumption (figure 1.1). This sector accounts for almost two-thirds of the total greenhouse gas emissions 25-33% of black carbon emissions (IEA, 2013; 2017).. Figure 1.1 Global energy usage1 (IEA, 2015) By improving the energy performance of buildings significant steps can be made in order to achieve the climate and energy targets. For new houses this transition is easier to be made. However, the real challenge lies in the renovation of existing houses. The building sector is experiencing under investments in improving the energy performance of the existing building stock. Private homeowners do not invest quickly in improving their house. First of all, there are few sustainable renovation solutions available with guaranteed performance and good market conditions. This means solutions which are financeable for each target group and result in a reduced energy bill. Secondly, it is difficult to get residents' support for far-reaching renovation measures. Residents have little confidence in a guaranteed improved living experience with similar costs (Stroomversnelling, 2018). In order to stimulate the improvement of the building stock, the Energy Efficiency Directive (EED) adopted a requirement for European Member States to develop long-term renovation strategies for their national building stocks (BPIE, 2013). The Netherlands is lacking behind in this transition as well. In households, natural gas is currently the most important form of energy for heating, hot tap water and for cooking. Natural gas accounts for 93% of the heat used in the Netherlands. The rest of this heat is supplied by the use of heat networks/district heating or other renewable sources such as solar heat, electric heat pumps and biomass (Energieonderzoek Centrum Nederland, 2017). Various international and national agreements have been made in order to make improvements and disconnect from the gas grid, such as: • •. in 2050 the built environment is completely energy neutral; 100 Petajoules (PJ) of energy saving in the final energy consumption of the Netherlands by 2020 (Ministerie van Economische Zaken, 2016; Rijksdienst voor Ondernemend Nederland, 2017a; SER, 2013). 1. Although the use of renewables may seem positive, most of this source comes from traditional biomass, including wood, charcoal and dung. In non-OECD countries, traditional biomass remains the largest source of energy.. 10.
(11) In order to reach the goals of 2050, every year 170,000 homes need to be renovated, which accounts for more than 2% of the total existing housing stock in the Netherlands. At the moment this renovation process is going slow (Ecofys, 2016; Filippidou et al, 2017; Ministerie van Economische Zaken, 20161). The government continues the promotion of renovation through price incentives, subsidies, low-interest loans, information and support for innovative approaches. An active role of municipalities as facilitators at local and regional level is expected for the concrete design and improvement of the existing building stock. In addressing energy reduction, municipalities follow a large-scale, area-based renovation approach. The municipalities facilitate an integrated large-scale approach, such as facilities in the area of local heat networks, heat/cold storage and decentralized production of energy and collective neighbourhood renovation approaches (Stroomversnelling, 2018). However, the way in which these large-scale approaches are implemented in practice is often not clear (Vastgoedmarkt, 2017). Despite great ambitions to 'get rid of gas', municipalities struggle to realize district heating on a large scale in the built environment (Hendriksma, 2017; Leefomgeving, 2017). Furthermore, the strategies used by municipalities are not always effective. According to Murphy, 2016, instead of financial support, permanent instruments should be put in place to improve the energy efficiency of (private) homes. Also, stimulation tools should be smarter and more refined and more focused on actual energy consumption (Murhpy, 2016). Even in the housing corporation sector, where sustainability is an important theme, the stated goal of an average energy label of B will not be achieved. Aedes, the national association of housing corporations, recognizes that the pace is too low to meet government targets in 2020. It is not possible to keep the rents low and at the same time invest says Tony Dijkhuizen of Aedes (Dujarding, 2016; Schilder et al, 2016). Not only do they struggle to increase the renovation pace, reaching the targets also requires a huge investment. According to Aedes, more than 108 billion euros is required to realize gas-free and CO2-neutral rental houses (NU.nl, 2018). Besides the renovation speed, there is a lack of adequate advice and technical expertise. Renovation projects require different skills, experience and knowledge compared to new construction projects. Stakeholders such as housing corporations, project developers, home-owners and governments are trying to increase the renovation rate by formulating renovation strategies (Vringer, van Middelkoop, & Hoogervorst, 2016). A large number of measures and techniques have been or are being developed for new buildings in order to meet the current building regulations. Measures such as extreme insulation, heat pumps, solar panels and heat recovery ventilation. However, the renovation of existing houses has to cope with a number of specific preconditions, making some these measures less applicable. A direct integration of these measures for the renovation of houses could be at the expense of comfort, energy savings and economic feasibility. In addition, the wide variety of renovation measures does not provide easy decision-making process for stakeholders in the renovation process (Rijksdienst voor Ondernemend Nederland, 2009; Stroomversnelling, 2018). In other words, there is a shortcoming in understanding the impacts of different measures and the related costs, CO2 emissions and energy savings. The question is, what set of measures is optimal for an area-based renovation approach for the long-term, or so-called ‘large-scale renovation strategy’ given a certain situation (Aksoezen, Daniel, Hassler, & Kohler, 2015; Konstantinou, 2014). At present, there is no information about the potential for energy savings and possible large-scale-renovation strategies for individual houses at a district level. As a result of which stakeholders such as local authorities and housing corporations cannot properly fulfil the aforementioned renovation task. Furthermore, there is a lack of knowledge of the bottlenecks and parameters which influence the decision-making process for these stakeholders. Analysing and predicting the energy performance combined with energy savings of existing buildings on a large scale can aid the decision process of large-scale renovation strategies. Since there is no publicly available data regarding the actual energy performance of individual houses at a large-scale, models can be of great use by quantifying this needed information. Furthermore, modelling techniques allow for a simplification of the complexities involved in the current renovation process, saving time. Witteveen+Bos is looking for such a new model that can be used in order to advise stakeholders, such as housing corporations or municipalities. This model should focus on the building related characteristics of the housing stock, and be applicable for the whole Netherlands.. 11.
(12) 1.2. Research objective and question. The objective of this research is as follows: Give insight into how the large-scale renovation strategy of existing houses can be optimized by predicting the energy performance and proposing renovation strategies by using a model, particularly in the Netherlands. To achieve this goal, the following research question must be answered: How can the large-scale renovation strategy of existing houses be optimized by predicting the energy performance and proposing renovation strategies by using a model, particularly in the Netherlands?. 1.3. Reading guide. The thesis is structured as follows: In chapter 1 the problem statement is presented. This is followed by the research methodology in chapter 2. In this chapter the research questions and design is described. Furthermore, an elaboration is given how the research was research carried out. The research consists of three parts. First, the concept regarding the energy performance of houses was analysed. This analysis is shown in chapter 3. Furthermore, the various techniques applied in literature to model the energy performance on a large-scale are shown. Energy performance parameters were drawn from this analysis. Chapter 4 includes the analysis of the various large-scale renovation strategies applied in literature and practice. In order to understand how this works on a large-scale, the renovation process for a single house was studied first. On top of that, the various parameters which influence the decision-making process for stakeholders such as housing corporations or municipalities are discussed. Based on this literature, presented in chapter 3 and 4, a model framework was developed. This framework is based on the combination of various tools and models. How these concepts of energy performance and large-scale renovation strategies were integrated into this framework is discussed in chapter 5. This is the second part of the conducted research. Subsequently, the developed tools and models were applied and tested in a case study, this is the third part of the research (test phase). This is described in chapter 6. This chapter discusses the test and the results. Improvements for the tools and models were drawn up on the basis of this case study. A short discussion and conclusion regarding the research design and results can be found in chapter 10. In addition, recommendations are given regarding the proposed model framework and follow-up studies.. 12.
(13) 2. RESEARCH STRATEGY AND METHOD. In this chapter the research framework and questions are presented and explained. Per sub-question a description is given what kind of research method was used, which sources were needed and how this resulted in answer for the sub-question.. 2.1. Research framework. The research framework (shown in Appendix I) gives insight into the theoretical framework, key concepts and conceptual model needed in order to form the research questions and strategy. The research objective is, or the desired result is the following: give insight in how the large-scale renovation strategy of existing houses can be improved by predicting the energy performance and proposing renovation strategies by using a model particularly in the Netherlands. This insight is needed for stakeholders such as housing corporations or policymakers (e.g. municipalities) which enables them to target specific districts with an optimal large-scale renovation strategy. This model can be used as a decision support instrument by Witteveen+Bos, targeted at individual houses on a district level. The output can be used for housing corporations or municipalities in order to evaluate the impact of certain large-scale renovation strategies to improve energy performances of existing houses. By generating and visualizing suitable large-scale renovation strategies, specific insight can be given on how the energy performance of individual houses on a district level can be improved. This model has to be applicable for the whole housing stock in the Netherlands. In order for the proposed model to be repeatable, it has to use widely available open source data. The model can be seen as the research objective. Input is needed for this model, that is, the model has to predict the energy performance of houses on the district level and propose certain large-scale renovation strategies. A conceptual model will function as the research perspective which was used to determine the relationship between large-scale renovation strategies and the improvement of the energy performance. This analysis was based on theory regarding energy performances of houses and large-scale renovation strategies in the Netherlands. In order to analyse how this works on a large scale, the renovation process of an individual house had to be analysed first. This theory resulted in a set of parameters which have an influence on the energy performance and decision process for determining an optimal large-scale renovation strategy. These parameters were integrated into the various tools and models. However, not all the parameters could be integrated into the tools and models. First of all, due to the limited timespan, not everything could be processed into the model framework. Secondly, the tools and models have to use data that is accessible and open source in order for the model framework to be usable on the entire housing stock in a fast and repeatable manner. This can be seen as the selection criteria. Only parameters related to building characteristics were used, with the exception of the statistical model. The statistical model used various parameters related to household characteristics in order to get a more reliable prediction of the energy performance. By testing the designed tools and models on a case the reliability and usability of the tools and models could be analysed.. 2.2. Research questions. The main research question is: How can the large-scale renovation strategy of existing houses be optimized by predicting the energy performance and proposing renovation strategies by using a model in particularly in the Netherlands? In order to answer this question, multiple sub-questions had to be answered, these are outlined below. 1.. Which parameters determine the energy performance of individual houses on a district level? 1.1 What role does the type of housing play in the energy performance? 13.
(14) 2.. Which parameters determine an optimal large-scale energy performance renovation strategy for individual houses on a district level? 2.1 What large-scale renovation strategies are used for existing houses on a district level?. 3.. How can the energy performance parameters and renovation strategies be implemented into a model framework to determine the optimal renovation strategy? 3.1 Which parameters can be used to determine the energy performance and optimal large-scale renovation strategy for individual houses on a district level, based on accessible open databases?. 4.. What improvement does the test case provide regarding the designed model? 4.1 What is the accuracy of the model?. 2.3. Defining key concepts. Below the key concepts in this research are defined. Large-scale renovation strategy: a long-term renovation strategy for improving the energy performance of multiple houses in an entire residential neighbourhood/district. This requires a collective renovation approach, engaging the various relevant stakeholders and using a combination of passive and active measures. Energy performance: the total energy demand of a building, based on aa normal use of the building, including energy used for heating, cooling, ventilation, hot water supply and lighting related to the standardized energy demand of buildings according to the current state of the art. Existing houses: residential buildings, including renovated and newly constructed dwellings, in the Netherlands. Districts: Part of a municipality in which residential uses dominates, or from a building point of view or socioeconomic structure, is homogeneously delineated as a residential area. Model framework: The model framework is the basic structure of the proposed model. This framework is based on the combination of multiple tools and models.. 2.4. Research strategy and method. In this paragraph the used research strategy and methods are described. The research strategy was based on a combination of desk research, various brainstorm sessions with experts in the renovation/building sector, an interview and a case study. The internal and external experts which were consulted in this research are listed in Appendix I. The following boundaries were set for this research: • •. •. the research focused on the renovation of the existing building stock, that is; existing houses that have been built, not to be constructed houses; the proposed model framework mainly focusses on the building related characteristic of the existing housing stock, not household and socio-economic characteristics such as the type of ownership and occupant’s behaviour. the renovation measures implemented in the proposed model framework will focus on passive measures, not active measures such as solar panels, heat pumps, lighting and ventilation.. For each sub-question, the method used to access and analyse data is described in the table below. An explanation is given regarding how data was gathered and validated. In addition, the specific results of each sub-question are given and how this related to the other sub-questions.. 14.
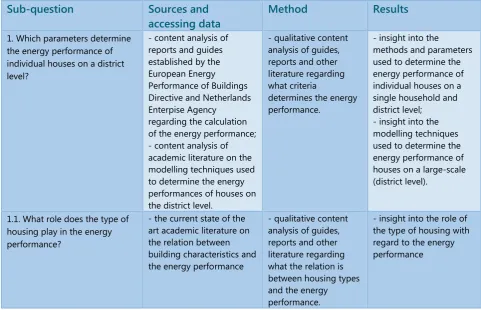
(15) Sub-question. Sources and accessing data. Method. Results. 1. Which parameters determine the energy performance of individual houses on a district level?. - content analysis of reports and guides established by the European Energy Performance of Buildings Directive and Netherlands Enterpise Agency regarding the calculation of the energy performance; - content analysis of academic literature on the modelling techniques used to determine the energy performances of houses on the district level. - the current state of the art academic literature on the relation between building characteristics and the energy performance. - qualitative content analysis of guides, reports and other literature regarding what criteria determines the energy performance.. - insight into the methods and parameters used to determine the energy performance of individual houses on a single household and district level; - insight into the modelling techniques used to determine the energy performance of houses on a large-scale (district level).. - qualitative content analysis of guides, reports and other literature regarding what the relation is between housing types and the energy performance.. - insight into the role of the type of housing with regard to the energy performance. 1.1. What role does the type of housing play in the energy performance?. Table 2.1 Research method sub-question 1 Sub-question 1 resulted in a set of parameters which determine the energy performance of individual houses on a single- and district level. In addition, the various modelling techniques used in literature to determine the energy performance of existing houses on a large-scale were summarized. The results from this sub-question functioned as input for the proposed model framework (sub-question 3).. Sub-question. Sources and accessing data. Method. Results. 2. Which parameters determine an optimal large-scale energy performance renovation strategy for individual houses on a district level?. - content analysis of documents from largescale renovation projects organized by housing corporations, municipalities and other governmental bodies; - content analysis of the academic literature on renovation strategies applied to houses on an individual level and largescale. - brainstorm sessions with multiple experts from Witteveen+Bos, ERA Contour and the Efficiator2;. - qualitative analysis of the parameters related to building-, household- and socioeconomic characteristics of the existing housing stock and to what extent they influence the decisionmaking process for stakeholders such as housing corporations or municipalities.. - description of the various parameters which influence the decisionmaking process for stakeholders such as housing corporations or municipalities for determining an optimal large-scale renovation strategy.. 2. The consulted experts are listed in Appendix I. Witteveen+Bos, ERA Contour and the Efficiator are organizations active in the building sector and renovation projects. Witteveen+Bos is an engineering company; ERA Contour is a constructor and the Efficiator is a start-up company.. 15.
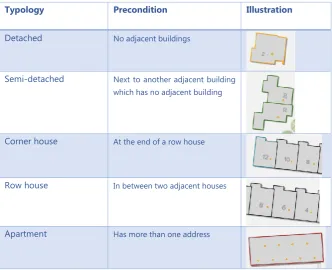
(16) - interview with S. Hartwig from the Efficiator.. - content analysis of documents from largescale renovation projects organized by housing corporations, municipalities and other governmental bodies. Table 2.2 Research method sub-question 2 2.1 What large-scale renovation strategies are used for existing houses on a district level?. - qualitative analysis of the renovation strategies and measurements used in these reference projects.. - a dataset of the applied renovation strategies and measures used in literature and reference projects.. Sub-question 2 resulted in an overview of the various parameters which are relevant for the renovation process of the existing housing stock, both for single houses or multiple houses on a large-scale. Furthermore, answering this sub-question resulted in a set of large-scale renovation strategies which are widely used in renovation projects. These strategies were analysed in sub question 3 regarding the effectiveness and efficiency to be added as input for the model.. Sub-question. Sources and accessing data. Method. Results. 3. How can the energy performance parameters and renovation strategies be implemented in a model to determine the optimal renovation strategy?. - results sub-questions 1 and 2 - brainstorm sessions with experts from Witteveen+Bos, ERA Contour and the Efficiator.. - a concept model framework that can reproduce the energy performance of districts and propose renovation measurements. 3.1. Which parameters can be used to determine the energy performance and optimal largescale renovation strategy for individual houses on a district level, based on accessible open data bases?. - results sub-questions 1 and 2; - data from the Central Bureau of Statistics, energy/network operators and Basis registration Addresses and Buildings (BAG). - based on the results from sub-questions 1 and 2 and by organizing (multiple) brainstorm sessions with experts from Witteveen+Bos, ERA Contour and the Efficiator a model framework was developed. - based on the results from sub-questions 1 and 2 and widely available datasets of parameters related to the building characteristics a selection was made of the parameters integrated into the concept model framework. - a set of parameters related to the buildingcharacteristic of the existing housing stock used in the concept model framework. Table 2.3 Research method sub-question 3 Sub-question 3 resulted in the first concept of the model framework. This is the structure of the model, which is based on the combination of various developed tools and models. The parameters related to the building characteristics were processed into two tools and two models. This was done based on desk research regarding the applied modelling techniques in various brainstorm sessions with experts from Witteveen+Bos, ERA Contour and the Eficiator.. 16.
(17) Sub-question. Sources and accessing data. Method. Results. 4. What improvement does the test case provide regarding the designed model?. - results case study. 4.1 What is the accuracy of the model?. - results test case - content analysis of documents and literature case study. - Based on the results the reliability and functionality of the proposed tools and models were evaluated on how they can be improved. - qualitative and quantitative analysis of the results to verify the model with the actual energy performance of the test case. - an advice in the way in which the model can be improved - insight into how the model can be used to optimize the large-scale renovation strategy - insight into the functioning and accuracy of the model. Table 2.4 Research method sub-question 4 The proposed model framework consists of a combination of various tools and models. These tools and models were tested on a case. This case was selected based upon the availability of open data regarding aspects such as actual energy performance of houses on a district level. The importance of this sub-question was to analyse how the tools and models work in practice.. 2.5. Ethics. Since the research involved humans (face to face interview and brainstorm sessions with experts), ethical considerations were relevant for data gathering. One interview and six brainstorm sessions were held. This research was conducted with full compliance of research ethics norms, and more specifically the codes of conducts of the University of Twente. When carrying out the research, the ethical standards were observed and during the data gathering the highest integrity was maintained at all times. The interviewee was informed of the nature and purpose of the interview, the purpose of the research and how the data from the interview was used and dispersed. Furthermore, a consent form was used for the interview.. 17.
(18) 3. ENERGY PERFORMANCE PARAMETERS. In this chapter insight is given into energy performance parameters. To understand how the energy performance of houses can be determined on a district level, the concept of energy performance for a single house needs to be analysed first. In paragraph 3.1 an explanation is given regarding how the energy performance is defined and what methods are used to do this. In addition, the relation between the various housing types present in the Netherlands and the energy performance is investigated. Secondly, a description is given how the energy performance of houses can be estimated at a district and city scale (§3.2). At the end of the chapter an answer is given to the following subquestion: •. 3.1. Which parameters determine the energy performance of individual houses on a district level?. Determining the energy performance on an individual building level. The energy performance is a widely used term which is often referred to as the calculated amount of energy needed to meet the energy demand related to a normal use of a building. In order to know how the energy performance can be determined for existing houses on a large-scale (e.g. district level), insight is needed in the methods used to determine this on the individual building level. Various methods are used to calculate the energy performance considering individual buildings, each with different purposes. In this paragraph these various methods are explained. The following methods are elaborated: 1. 2. 3.. Energy performance according to the Energy Label; Energy performance according to the EI; Energy performance according to the EPC/BENG.. The three methods (EPC, Energy label and EI) may look similar but they distinct themselves according to the target group, function and calculation method used. In the table below, this is shown. In the following paragraphs these methods are elaborated. Instrument Energy label. Target group To be built and existing houses. EI. Existing houses. EPC. To be built houses. Function A simple representation of the energy performance (Awareness tool) Detailed representation of the energy performance. Detailed representation of the energy performance. Method A simple calculation based on 10 characteristics Detailed calculation based on 150 characteristics for one house Detailed calculation for more than one house or apartment. Table 3.1 Difference energy performance methods These methods are based on the European Energy Performance of Buildings Directive (EPBD). In paragraph 3.1.1, a short description is given of this directive.. 3.1.1. Energy performance according to the EPBD. In 2002, the European Energy Performance of Buildings Directive (EPBD) was implemented to stimulate the reduction of the energy consumption among the building sector. Through the EPBD it became mandatory for buildings to have an energy performance certificate at the point of sale or rent. Furthermore, regulatory demands on existing buildings were established (Murpy, 2016). 18.
(19) The Dutch legislation and regulations on the energy performance of buildings are based on the European Energy Performance of Buildings Directive (EPBD) (Publicatieblad van de Europese Unie, 2010). The general requirements of the EPBD for residential buildings included the development of a system of energy certification for new and existing buildings, regular inspections of heating and air-conditioning systems and the introduction of minimum energy performance standards for new and extensively renovated existing buildings with a useable floor area of over 1000 m2. All European member states had implemented the directive by the end of 2009, some more effectively than others (Andaloro etal.,2012).(D. Majcen, L. C. M. Itard, & H. Visscher, 2013). In 2010 the directive was revitalized. A new definition was given for the energy performance of buildings, it stated: “energy performance of a building’ means the calculated or measured amount of energy needed to meet the energy demand associated with a typical use of the building, which includes, inter alia, energy used for heating, cooling, ventilation, hot water and lighting” (Publicatieblad van de Europese Unie, 2010). The methodology for calculating the energy performance of buildings is not defined in the directive and is the responsibility of individual member states. This methodology has to be in accordance with the general framework set out in the directive according to article 3 of the directive. In Appendix II this framework is shown.. 3.1.2. Energy performance according to the Energy Label. In the past, a certified Energy Performance Coefficient (EPC) calculation for new buildings was sufficient to demonstrate that a building meets the energy performance requirements. Today, a valid energy label must be handed over to the buyer or tenant upon completion of the building. For housing construction an energy label for homes is required and for utility buildings an energy label for utility buildings. The energy label indicates whether the home consumes much or little energy (the energy performance). The energy label also states which energysaving measures are possible in the home, e.g. double glazing or insulation of the roof. (Rijksdienst voor Ondernemend Nederland, n.d.6). The energy label for homes is an instrument that contributes to the achievement of the objectives laid down in the Energy Agreement. Energy labels are valid for 10 years (Rijksdienst voor Ondernemend Nederland, n.d.7). The energy label is determined on the basis of a model. This considers the most important architectural and technical data of a house. For this, the calculation model uses 10 characteristics, such as: • • • • • •. construction year of the house; floor insulation; house type; type of heating; type of glass; solar panels and solar water heater (Rijksdienst voor Ondernemend Nederland, n.d.7).. Any home sold, delivered or re-rented in the Netherlands must be in possession of an energy label, according to the implementation of the European directive the Energy Performance of Buildings Directive (EPBD). There are a few exceptions3 (Nederland, n.d.). The energy label represents the energy performance, indicated in the form of a letter G (lowest performance, bad label, low class) to A (highest performance, good label, high class). A house with a good label is therefore relatively energy-efficient. The energy performance of an existing building can be calculated based on the method as described in Appendix II (Gaalen & Staal-Guijt, 2014a). 3.1.3. Energy performance according to the EI. The energy performance of existing buildings can be calculated using the Energy-Index, or EI as well. The EI is a number which indicates the energy consumption on the basis of the amount of energy deemed necessary for the different needs related to a standardized energy use of a building (Regeling energieprestatie gebouwen, 2018).. 3. The energy label is not mandatory for monuments, (student) rooms, caravans and mobile homes smaller than 50 m2 (Nederland, 2017). 19.
(20) The index is mainly meant for landlords of houses below the rental liberalization limit4. The Energy Index partly determines the number of rental points5 for a house. The EI is a figure with which the rent can be determined on the basis of the Housing Valuation System (Rijksoverheid, 2018; Rijksoverheid, n.d.4). Unlike the simple method used for the energy label, the EI uses an extensive method. The EI can only be calculated by a certified energy consultant who analyses 150 different parameters of a house. In practice, this means that the energy consultant measures the dimensions of the house in detail, notes the insulation quality and identifies the installations that are present. Based on this extensive recording, he then calculates the EI. The energy performance of a building is then expressed by a number, ranging from ≤1.20 (extremely good performance) to >2.70 (extremely bad performance) (Rijksoverheid, n.d.8).. 3.1.4. Energy performance according to the EPC and BENG standards. Energy Performance Coefficient (EPC) The measure for energy efficiency is called Energy Performance Coefficient (EPC). The EPC lists an energy rating for a building on an A–G scale. This standard applies to new construction of residential and non-residential buildings. The EPC fully assesses the energy efficiency of a home / residential building or utility building. This is done on the basis of building characteristics, installations and standard user behaviour. Each year the EPC values of buildings are tightened. This process led to more energy-efficient buildings by applying better energetic measures and techniques. The lower the EPC value, the better the energy performance of the building (Rijksdienst voor Ondernemend Nederland, n.d.1). These requirements will be replaced by the introduction of the requirements for almost net-zero-energy buildings (in Dutch Bijna Energie Neutraal Gebouw, or BENG) on the 1st of January, 20206 (Rijksdienst voor Ondernemend Nederland, n.d.2). Bijna Energie Neutraal Gebouw (BENG) For all new buildings, both residential and non-residential construction, the buildings must comply with the requirements for net-zero-energy buildings (BENG) starting from 2020. BENG is the result of the Energy Agreement for sustainable growth and the European directive EPBD. Unlike the method used for the EPC (one value for the energy performance), the energy performance for BENG is based on three values: • • •. the maximum energy requirement in kWh/per m2/per year; the maximum primary fossil energy use, also in kWh/per m2/per year; the minimum share of renewable energy in percentages (Rijksdienst voor Ondernemend Nederland, n.d.5).. The energy requirement is the amount of energy needed to reduce the energy losses to compensate for transmission and ventilation, with the aim of achieving a comfortable indoor climate. This is determined under standard conditions. Parameters such as the user surface, cooling demand and heat demand (Rijksdienst voor Ondernemend Nederland, n.d.5). The total use of primary fossil energy is calculated by deducting the generated renewable energy from the total energy usage. To determine the share of renewable energy first the absolute amount of renewable energy is calculated. This amount of renewable energy includes, in addition to the yield of PV panels, the energy production of heat pumps, solar boilers, biomass boilers etc., minus the energy consumption of the device (Rijksdienst voor Ondernemend Nederland, 2017a). Like the EPC, these values will be tightened every year. No fixed method for BENG has been established yet. At the moment, the BENG indicators can only be determined from the interim results of the calculation of the EPC (Rijksdienst voor Ondernemend Nederland, n.d.5).. 3.1.5. Differences in energy consumption predictions and actual energy consumption. In many energy performance calculations, standardized values are used, as shown in Appendix II. These standardized values, such as a constant occupancy and constant indoor temperature, are used to ensure comparability between energy performance indicators (e.g. energy label). However, these values can differ in reality.. The rental liberalization limit determines if a house belongs to social housing, or private housing. In 2018 this limit was €710,68 (Rijksoverheid, 2018). 5 The rental point system determines the maximum rental price of a social rental house (Rijksoverheid, n.d.4). 4. 6. For governmental buildings, these new requirements are applicable starting from January 1st, 2019 (Rijksdienst voor Ondernemend Nederland, n.d.11). 20.
(21) Due to these standardized parameters, the calculated energy consumption can turn out to be very different, compared to the actual energy consumption. Since energy performance is directly related to the energy consumption, as shown in the equations in Appendix II, the calculated energy performance of a house may be unrealistic as well. This difference between the calculated and actual energy consumption is referred to as the ‘performance gap’ (Majcen, 2016). This performance gap was studied by Daša Majcen. In this study, the causes of the discrepancies between the calculated or ‘theoretical consumption’ and the actual energy use were analyzed in the Netherlands. As shown in figure 3.1, the theoretical gas consumption can be overpredicted up to 200% in the Netherlands (Majcen, 2016).. Figure 3.1 Actual and theoretical gas consumption per energy label (D. Majcen, L. Itard, & H. Visscher, 2013) On average, the calculated energy consumption is comparable with the actual energy consumption of houses. However, when looking at a detailed level, it can be noted that the actual gas consumption is much lower compared to the theoretical consumption. The opposite can be observed for the electricity consumption, which is actually higher than calculated (D. Majcen et al., 2013). This difference can be recognized as well when comparing the energy label classes. As shown in the figure above, the theoretical energy consumption for poor labels (C, D, E, F and G) is overpredicted. On average, houses with a poor label class consume 30% less energy than calculated. For houses with a rather good label (A and B), the theoretical energy consumption is underpredicted with approximately the same amount. The total theoretical energy consumption is calculated rather well since the two effects counteract to each other, compensating for the under- and overpredictions (Majcen, 2016; Majcen, Itard, & Visscher, 2015). Nonetheless, the performance gap results in misleading energy consumption and performance predictions, which can lead to inaccurate policy reduction targets. Furthermore, it sends an incorrect signal to stakeholders such as local governments, homeowners, housing corporations and the building industry. This performance gap is also analysed in other countries. A study in Norway indicated that the total theoretical energy consumption cannot be predicted more accurately than 35-40% compared to actual energy consumption data. This corresponds with the study by Majcen and other studies such as the research done by Sunikka-Blank and Galvin in 2012. In this research the performance gap was analysed in Germany. The study indicated that the actual energy consumption of households can be 30% lower than estimated (Sunikka-Blank & Galvin, 2012). The discrepancy in energy consumption in the Netherlands can be explained by aspects: 1. 2. 3.. dwelling characteristics; household characteristics; occupant behaviour (Majcen, 2016).. 21.
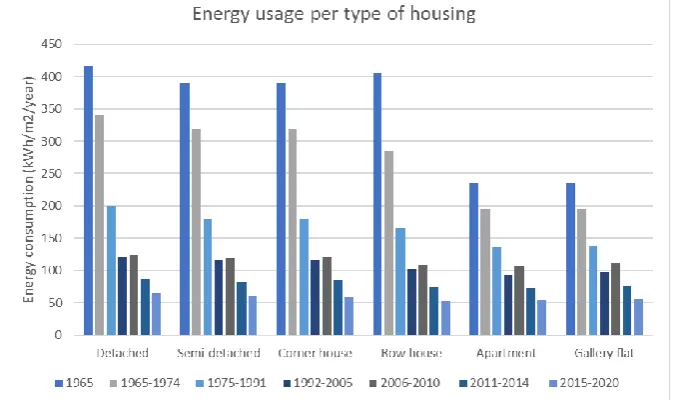
(22) In the figure below the effects of the different aspects is shown in relation to the gas consumption. In the following sections these aspects are elaborated.. Figure 3.2 Actual and theoretical gas consumption per energy label (D. Majcen, L. Itard, & H. Visscher, 2013) Dwelling characteristics The dwelling characteristics relate to parameters such as the type of housing, building age, heating type and surface area. These parameters have a strong influence on the theoretical energy consumption due to the to the assumptions made in the calculation methods. Assumptions like the standard heat gains and losses, standard heated surface area and efficiencies of boilers (Majcen, 2016). As shown by the calculation methods in Appendix II, the theoretical energy consumption of a house depends on the energy use for space heating, hot water usage, auxiliary electricity consumption and lighting. The energy usage for space heating is determined by the heat gains and losses of a house. To what extent heat is gained or lost depends on the technical and architectural characteristics of the house. Characteristics such as the thermal quality of the building, the building type used, floor area, type of heating installation and ventilation type (Guerra Santin, Itard, & Visscher, 2009). The type of housing, in combination with the building age is a good indicator of the energy usage. In general, the thermal quality of older buildings is often poor. This can be explained by the rather weak building regulations in the early- and mid-20th century (more on these regulations in §4.3.). When looking at the type of housing it can be noted that the energy consumption is different per archetype7.. Figure 3.3 Energy consumption per archetype (Agentschap NL, 2011b) As shown in the figure above, the energy consumption differs per archetype. This can be explained by the technical characteristics of the building, such as the geometry (building size and shape) and surface area. These characteristics determine the heat distribution, losses and gains in a building. A larger building results in a larger total surface of the building, and thus a larger transmission loss surface. The transmission loss surface is different for the various types of houses. 7. The archetype refers to the prototypical design in which houses can be distinguished (Agentschap NL, 2011a).. 22.
(23) For instance, a detached house has more surfaces, exposed to the outside environment, compared to a row house or an apartment. Therefore, detached houses have more heat losses than other types, resulting in a higher heating demand. Another aspect which explains the difference is the construction period (related to the constructive principles and materials). The construction period reflects the building practice and required energy performance of houses used in that period (Ballarini, Corgnati, & Corrado, 2014). Household characteristics Household characteristics are related to parameters such as the age of the occupant, number of occupants, household income and occupant behaviour. These parameters have a large effect on the actual energy consumption. According to numerous studies, age is a key characteristic which can be related to the energy consumption. Studies show that households with relatively older occupants tend to consume more energy than younger households. Older occupants tend to consume more energy required for space heating, due to the higher comfort standard with regard to the temperature setting (Liao & Chang, 2002; Linden et al., 2006). The number of occupants is a relevant parameter as well. Larger households tend to have bigger houses, as well as a higher hot tap water demand. The average income of a household is another decisive parameter regarding the energy consumption. Households with a relatively high income tend to consume more energy than households with a low income. In general, people with a higher income tend to have more electrical applications, tend to keep a warmer indoor temperature and have larger houses in overall (Guerra Santin, 2010). Poorer households on the other hand, use less energy since they have less money to spend on energy bills. Furthermore, these households often live in poorly insulated houses (Majcen, 2016). Occupant behaviour This aspect has to do with the energy behaviour of the household, such as the number of days present in the dwelling, temperature preferences, ventilation preferences, showers per week and average temperature during the day. The calculations shown in the previous paragraph either standardise or ignored these parameters. This can explain the difference in actual and calculated energy consumption and performance. The problem is that the effects of the occupant’s behaviour are complex and are associated with the building characteristics (Guerra Santin, 2010). For instance, people use higher temperature settings in houses which have good insulation, something which can be explained by the ´rebound effect´ (this is explained later on). Other factors such as the type of thermostat (manual or programmable) affect the behaviour as well. Households with a programmable thermostat use less energy than households with a manual thermostat. In the first case, occupants have direct feedback on the temperature setting (Guerra Santin, 2010). As stated before, occupants tend to increase their comfort demands when the energy performance increases, which in the literature is referred to as the ‘rebound effect’. The rebound effect means that the energy consumption increases, even though energy saving measures are implemented. This is caused by the increased comfort settings of the occupant, after applied measures. People unconsciously compensate for the energy savings: for instance, turning on the lights for a longer period after installing LED lights. This mechanism can explain the underpredictions of the energy consumption and performance in well-performing houses in the Netherlands (Majcen, 2016). The opposite effect can be observed as well. In contrary to the rebound effect, the ‘pre-bound effect’ explain the overpredictions of the energy consumption in houses with a poor energy performance. In general, poor households pay more attention to reducing the energy consumption in poor performing houses to save money. These households focus more on keeping a low indoor temperature, heat less rooms and use less hot tap water (Majcen, 2016; Sunikka-Blank & Galvin, 2012). The rebound and pre-bound effects are one of the causes of the over- and underprediction of calculated energy consumption, performance and reductions. These effects can limit the actual energy savings due to renovation measures. Studies show that the rebound and pre-bound effect can influence up to 30% of the actually saved energy through renovation measures (Majcen, 2016). Figure 5 shows the relation of the rebound and pre-bound effects and the actual energy savings. Both effects result in lower actual saved energy than calculated, causing an unrealistic image of the effects of renovation measures.. 23.
(24) Figure 3.4 The relation with the rebound and pre-bound effects and energy savings (Sunikka-Blank & Galvin, 2012). 3.2. Energy performance parameters on a district and city scale. In order to determine the energy performance on a larger scale, such as the district level, the energy usage of an individual building cannot be simply multiplied by the number of buildings in a district. As seen in the figure below, the energy demand of a district can vary, even when the buildings are from the same building type and characteristics. In order to combine groups of buildings while maintaining a reliable representation of energy interactions at the district or city level various parameters have to be accounted for. For instance, if a house, or group of houses is connected to a heat or gas network, or uses a biomass or electrical boiler (Fonseca, et. al, 2015; Monzón, et. al, 2018).. Figure 3.5 Differences in heating demand per housing block (Monzón, et. al, 2018) As stated in chapter 1, major efforts are needed to realize an energy- and CO2 neutral building stock by 2050. These efforts include means to analyse the energy performance of buildings, and by doing so, determining potential renovation strategies. By creating a systematic approach which can be used at any location that addresses existing houses at a district or city scale, stakeholders such as policy makers or housing corporations can identify an optimal renovation strategy for existing houses (Tardioli, Kerrigan, Oates, O‘Donnell, & Finn, 2015). In this paragraph a description is given regarding the various methods and models used to analyse the energy performance of existing houses on a district level. First of all, the modelling techniques are described. Then, numerous examples are given how these techniques and which parameters are used in practice. Large-scale modelling techniques of the energy performance Various studies regarding decision support models and tools have been performed to assess the energy performance of buildings and districts. When it comes to these models Swan, et. al. recognized two techniques to model energy consumption or performance: top-down and bottom-up (figure 3.6). 24.
(25) In the following paragraphs various top-down and bottom-up approaches are elaborated. Insight is given into the parameters which are used to determine the energy performance of houses on a district and city scale. In addition, the advantages and disadvantages of the two approaches are discussed.. Figure 3.6 Top-down and bottom-up techniques for determining energy consumption (Swan, et. al, 2009). 3.2.2. Top-down models. Top-down models predict the energy consumption or performance of existing houses at an aggregated level. These models are founded on the correlation between energy consumption and economic variables such as gross domestic product, income and unemployment. These values are then connected with econometric or technological indicators of the existing housing stock on a regional or national level (Kavgic et al., 2010). Top-down models are mainly used to analyse certain trends and long-term changes in the national building sector regarding energy consumption or performance. They can provide predictions or estimates in order to assess certain measures. For instance, improving the energy performance of a certain building type on a national scale (Kazas, Fabrizio, & Perino, 2017; Reinhart & Cerezo Davila, 2016). However, top-down models do have some disadvantages compared to bottom-up models. First of all, a huge amount of data is needed since it mainly focusses on macrolevel, e.g. entire building stock. Second of all, the models cannot be used to analyse individual buildings on a large scale. Specific characteristics of individual buildings, technologies or measures are not considered (Elci, Manrique Delgado, Henning, Henze, & Herkel, 2018). Therefore, it is limited to the general characteristics of the total building stock, which makes it difficult to predict the energy performance on a detailed level. In short, top-down models analyse the existing housing stock as one entity. Based on the aggregated characteristics of the housings stock, the energy demand or performance is modelled. Top-down models extrapolate from aggregated data on the macro-economic level and therefore, are not capable to analyse the energy consumption or performance of individual houses on a district level. This makes top-down models less suitable for the purpose if this study, which is to analyse individual houses on a large-scale, e.g. district or city level. Bottom-up models, on the other hand, are able to scale down in order to model individual houses on a large-scale (Frayssinet et al., 2018). According to Kazas et al and Reinhart & Cerezo Davila, bottom-up models are expected to become a crucial decision support tool for stakeholders such as municipalities, urban planners and policy makers (Kazas et al., 2017; Reinhart & Cerezo Davila, 2016).. 3.2.3. Bottom-up models. Bottom-up models are used to analyse the building stock on a meso- or micro level, e.g. predicting the energy consumption of individual houses. These models can offer more insight into the characteristics of the building stock and enable the assessment of measures at individual houses on a large-scale (Elci et al., 2018). The energy performance can be analysed by starting at a disaggregated level, such as separate building characteristics. By using numerous statistical methods, data can be aggregated to represent the entire building stock. This can be performed in a district, urban or national scale. A bottom-up approach can use both types of data, aggregated and disaggregated, unlike top-down approaches (Kazas et al., 2017). Parameters such as construction period, surface area, building type and level of education can be used in bottom-up models. 25.
(26) This data can be calibrated or benchmarked with available measured data such as gas consumption. This is especially important when analysing large numbers of buildings to assess the difference between the predicted and measured data (Boehme, Berger, & Massier, 2015). Usually, the predictions will be more accurate if more parameters are used, that is when the parameters used to correlate with aspects such as the energy consumption or performance. However, this does require more data (Boehme et al., 2015). In general, two different types of bottom-up models can be found in literature: statistical and engineering-based models. Engineering based models use specific quantitative data regarding characteristics of existing building to model the energy consumption or performance. The advantage of using engineering-based models is the capability of predicting the potential energy savings of buildings due to the implementation of renovation measures. However, these models are very complex, are limited to specific data of a certain district and require high-levelled data input (Mastrucci, Baume, Stazi, & Leopold, 2014). Statistically based models are rather simple compared to engineering approaches. In general, statistical models aim at analysing the correlation between end-use energy consumption of single buildings and a set of parameters. These parameters are related to occupant’s behaviour or building- and household-characteristics such as surface area, income and building type. The advantage of statistical models is the ability to consider the behaviour of occupants. Therefore, statistical models can offer reliable information about the energy characteristics of buildings. However, these approaches are not able to consider the impact of renovation measures (Mastrucci et al., 2014). The key advantage of bottom-up models is the capability to predict the energy consumption or performance at a detailed level (individual buildings) on a large-scale, e.g. neighbourhood, district and even city and national level. Various bottom-up models have been developed in the past decades. A couple of these relevant models and tools are described in the following sections. Data-driven energy usage predictive model on city-scale Constantine E. Kontokosta and Christopher Tull from the United States designed a bottom-up model which can be used for policy makers to predict the energy use at the building, district, and city level. The model uses actual energy usage data of more than 23.000 buildings, land use data, energy disclosure policies and predictors from property and zoning information. With the use of statistical models, the energy usage of 1.1 million buildings in New York City could be generated (figure 3.7). Building specific parameters such as building size, age, use, occupancy characteristics and construction type were utilized with the use of a regression model. By validating the output at the building level using zip code actual energy consumption and building data the accuracy could be assessed. The output of the model creates the ability for policy makers to evaluate the impact of policy alternatives to advance energy use reductions. This city level model enables to target regulations and incentives by clustering building types based on intensive energy users. For instance, incentives for renovations or building inspections and enforcement (Kontokosta, et. al, 2017).. Figure 3.7 Predicted energy usage in New York on different levels (Kontokosta, et. al, 2017). 26.
Figure

+7


Related documents
This section outlines the method to find the best allocation of n distinguishable processors to m dis- tinguishable blocks so as to minimize the execution time.. Therefore,
The series has expanded with additional publications including Forging Positive Partnerships in Florida, Project Highlights, Statewide Curriculum & Degree Program
This is the first course of a 2-semester course sequence in which students study the anatomy and physiology of the human body.. The course includes introductions to basic
public class XorSocket extends Socket { private final byte pattern;}. private InputStream in
They are (1) as the purpose of this study was to identify the reaction of African American students to a culturally relevant (Ladson-Billings, 1992, 1995a, 1995b, 2009) visual tool
This paper proposes to extend the jerk-limited profile (JL) properties to time-varying vibration problem by using a jerk-limited profile with different maximum jerk values (i.e.
to analyze the test data sets that will be provided • gain robust experience with statistical methods, regression techniques, correlation, dimensionality reductions,
