Master thesis
Predicting persistency of usability problems based on
error classification
A longitudinal study on improving mobility for the elderly
Ruud Zandbergen
April 2015
Faculty of Behavioural, Management and Social sciences (BMS)
University of Twente
Table of contents
PREFACE ... 2
ABSTRACT ... 3
ENGLISH ... 3
DUTCH ... 4
INTRODUCTION ... 5
DEVELOPING FOR THE ELDERLY ... 5
PROBLEM SEVERITY AND PERSISTENCY ... 6
LONGITUDINALITY ... 8
TOWARDS AN ERROR CLASSIFICATION ... 11
ERROR CLASSIFICATION METHODS ... 13
INDIVIDUAL DIFFERENCES ... 20
STUDY GOAL AND HYPOTHESES ... 21
METHODS ... 23
SAMPLE ... 23
MATERIAL... 23
APPARATUS... 26
PROCEDURE ... 27
DATA GATHERING &ANALYSIS ... 28
RESULTS ... 32
ERROR CLASSIFICATIONS ... 34
INDIVIDUAL DIFFERENCES ... 36
PERSISTENCY PATTERNS ... 37
DISCUSSION ... 40
FINDINGS ... 40
RELEVANT IMPLICATIONS ... 42
STUDY LIMITATIONS ... 44
FUTURE RESEARCH ... 45
CONCLUSIONS ... 46
REFERENCES ... 48
APPENDIX A: QUESTIONNAIRES... 58
APPENDIX B: GUIDELINES ... 65
APPENDIX C: RULES FOR BINARY CODING ... 82
APPENDIX D: ADDITIONAL ANALYSES AND RESULTS ... 84
DISCOVERY RATES ... 84
TIME ON TASK ... 86
ASQ SCORES ... 88
APPENDIX E: LIST OF USABILITY PROBLEMS ... 91
APPENDIX F: CHECKING OF ASSUMPTIONS FOR GEE ... 92
Preface
This study was performed as a master thesis for psychology at the University of Twente. The data collection took place during an internship at the National Fund for the Elderly (NFE). I want to thank a number of people who have helped me greatly in finishing this master thesis. First of all I would like to thank my supervisors Martin Schmettow, Matthijs Noordzij (University of Twente) and Nina van der Vaart (NFE) for their support, expertise, feedback and fresh thoughts about the thesis and project.
I would also like to thank Deborah Oosting for helping me throughout the course of the thesis. It was very valuable to exchange ideas and discuss with you about our theses.
I would like to thank everyone at the NFE and the consortium of the MOBILE.OLD project for helping me to obtain hands-on experience in a very pleasant work environment and treating me like an equal in the discussions and project meetings. Going to London and partaking in one of the project meetings was one of the highlights of the internship.
A big thanks to the participants of this study and to the NFE and the Koperhorst for finding the participants and providing a testing location.
Abstract
EnglishNederlands
Introduction
Social isolation and loneliness are becoming increasingly serious problems among the elderly. With events like getting a retirement from work, loss of a partner, family member or friend and a decrease in mobility, loneliness is lurking for the elderly of 65 years and over (Centraal Bureau voor de Statistiek [CBS], 2012). Social isolation is also negatively influencing the psychological state of the elderly (Tomaka, Thompson & Palacios, 2006), with a higher percentage of the elderly showing depressive symptoms due to social isolation than often is thought (van’t Veer-Tazelaar et al., 2008). With a population that is ageing more every year, it is very important to address the problems which elderly are facing and to keep them socially engaged. New and innovative ways to help elderly stay mobile and socially engaged are always sought after. In this day and age the possibilities to help elderly with socially oriented activities have become wider than they have ever been as wireless internet is available almost everywhere for mobile devices. Bargh & McKenna (2004) called the internet the latest in a series of technological breakthroughs in interpersonal communication, following the telegraph, telephone, radio and television, but mobile internet seems to be another big step further in technological advancement. The new possibilities have led to a number of projects focussed on helping elderly to become engaged more in society and to become more mobile by using mobile applications to prevent them from becoming lonely and isolated. The European Union has started to subsidise a number of projects which try to solve problems that elderly face by utilizing innovative technologies. One of these projects is the MOBILE.OLD project, which is a collaboration of companies throughout Europe that focusses on supporting elderly to stay independent, healthy and mobile. This is accomplished by introducing mobile devices with highly specialized residential and outdoor services (Ambient assisted living joint programme [AAL], 2012). The National Fund for the Elderly (NFE) from the Netherlands, which is one of the end-user testing partners in the MOBILE.OLD consortium, commissioned a study to evaluate the usability of the designed prototype services. Besides the usability evaluation, the way elderly learned to use the prototypes and what kind of problems they faced in the process was a big focus point of this study.
Developing for the elderly
that number was expected to double in 2013 (Portio Research Limited, 2013). Even though there are so many existing applications, using them for the MOBILE.OLD project proved to be rather difficult, because the elderly are a very different kind of user group than the ‘average’ computer users (Hawthorn, 2003; Shneiderman, 2000). Existing applications are therefore not always appropriate for them to use. Elderly users are often overlooked by design companies when new services and applications are introduced (Rice & Alm, 2008), as not many elderly are expected to use the applications anyway. The elderly are often reluctant to use new technical devices as they are uncertain about how to get started with new devices and think of them as too complicated (Eastin and LaRose, 2006). To help the elderly overcome these fears, the project chose to develop new, user-friendly applications that would be delivered in a highly personalised and intuitive way for elderly. According to Hawthorn (2003) it is not enough to look at guidelines that were made for elderly to accomplish this, but you also need to involve the elderly in the testing and really need to listen to their wishes for improving the applications. To achieve this in the MOBILE.OLD project, the elderly were personally involved in the design and redesign of the applications during the various testing phases. User interviews, card sorting tests and mock-up tests were performed with elderly users during earlier stages of the MOBILE.OLD project, leading to prototype versions of the mobile services that incorporated the earlier received feedback of the elderly. These prototypes were capable of executing almost all basic functions and some advanced functions that were designed. This study took place during the first prototype testing phase, where usability testing was performed for the project to investigate how the elderly users would interact with the services and which parts of the services would be problematic to them. These problems could then be used as input for the next design phase.
Problem severity and persistency
trouble users will experience, as well as a recommendation about allocating the aforementioned resources based on the urgency of fixing problems (Hertzum, 2006). According to Nielsen (1995), severity consists of three factors:
Frequency: How many times does the problem occur? Is it common or rare?
Impact: How hard is it to overcome this problem?
Persistence: Does the problem fade after a number of tries or do users keep on being
bothered by it? In other words, do users learn from the previously encountered problem? From these factors, the severity rate can be determined by using equation 1. As is reflected by the equation, the three factors can be seen as equally important.
Severity = frequency * impact * persistence (1)
These effects during the first time a product is used seem to be especially true for elderly users. Elderly have typically been found ‘to perform more slowly, to request more assistance during training, and to take longer to acquire computer-based skills’ (Westerman, Davies, Glendon, Stammers & Matthews, 1995, p. 313). However, many of these results on the capabilities of elderly users may show a distorted view as they are based on testing first time experience. Westerman et al. (1995) showed in their study that even though elderly had slower response times at first in an information retrieval task, they approached the faster response times of their younger counterparts after some time. Interestingly, the study showed a massive improvement for the elderly between the first and second trial compared to the younger users, indicating that elderly users were mostly at a disadvantage during early stages of learning. These results show that it is very important look at persistency of problems for elderly users when you want to get a clear image of how well your new product is learned by them, as the elderly need a little bit more time to ‘get started’. This study wants to focus on investigating problem severity and in particular the factor of persistency. Since many studies opt for a use of severity without identifying persistence, it seems important to understand what the consequences are on the results you acquire.
Longitudinality
methods differs from usability testing mostly because it generally does not require any users (Molich & Dumas, 2008). Rather, it asks a small group of usability specialists and domain experts to review the product or service and predict what problems a user will possibly encounter (Fu et al., 2002; Molich & Dumas, 2008; Agarwal & Venkatesh, 2002). Due to the testing without users, this method can be performed in less time and without the effort of finding a lot of participants, helping reduce the costs of the evaluation. We want to build on the use of inspection methods to predict persistency as a cheaper alternative to the longitudinal design. This way companies are able to assess persistency and use this to calculate the severity rating for a problem, while still using the affordable cross-sectional study design.
Contribution of persistency
Beside the main focus of this study to investigate the possibility of predicting problem persistency, this study will also look into the contribution of persistency to severity and usability research. As stated earlier, most studies in the field of usability evaluation opt for a cross-sectional study design and do not gather data about persistency. The consequences of these choices were investigated earlier by Kjeldskov et al. (2010), by looking at the proportion of problems that persisted over a large period of time. They compared the usability problems found by nurses interacting with an ERP system during first time use and after a year of extensive use. The nurses were regarded as novices at the first trial and experts in the last trial.
study wants to make a case for incorporating persistency more often in usability evaluation, we will use the data of this study to replicate the study of Kjeldskov et al. (2010) and will compare the results of both studies. A favourable proportion of persistent problems, comparable to the 66% found by Kjeldskov et al. (2010), will indicate that persistency could contribute to a better form of problem prioritisation.
Learning and persistency
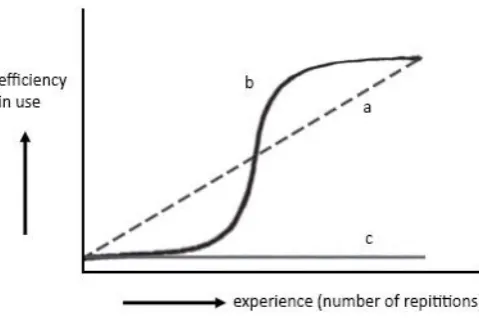
Figure 1. Examples of different learning curves. Line a represents a gradual improvement, line b an instant improvement and line c represents a lack of improvement.
This study will use a discrete approximation of the learning curve to determine persistency of a user for a certain problem. This approximation, consisting of a binary pattern that shows the presence of a problem over a number of trials, will be called a persistency pattern. An example of a persistency pattern can be seen in figure 2. As is visible the persistency pattern consists of a value of ‘one’ or ‘zero’ which reflects if the problem was detected or not during a certain trial. Note that this means that an increase in ability for a user would eventually lead to a decrease in the persistency pattern. The persistency patterns also reflects the focus in usability research on the problems in a system, rather than the performance of a user.
Figure 2. Example of a persistency pattern. Towards an error classification
[image:12.595.72.312.481.631.2]cross-sectional study. Usability studies have made distinctions between usability problems before based on error classifications. In a study that compared inspection and user testing methods, Fu et al. (2002) proposed that different usability problems occur at different levels of human performance. These levels of human performance were classified using an error classification method by Rasmussen (1983). Barendregt et al. (2006) used a similar error classification method by Zapf, Brodbeck and Prümper (1989) to classify usability problems in a study on identifying usability and fun problems in a computer game. Even though these studies are able to classify usability problems, they did not take persistency of problems into account. This study wants to extend the use of the classification methods and use the error classifications to distinguish between usability problems to predict the persistency of different problems over time. In this study it is hypothesized that different levels of human performance and different classifications for errors could potentially lead to different persistency patterns. To investigate this, the error classifications will be used to classify incidents. Incidents can be seen as separate occasions of errors that the users encounter during interaction with a system. These incidents will then be matched to form usability problems. Matching is the process of grouping problem descriptions together that are similar, to reduce the number of problems to fix. The classifications in this study are different from those that were performed in the studies by Fu et al. (2002) and Barendregt et al. (2006), as these studies classified the usability problems, instead of the incidents. Since the classifications are going to be performed in a different way, an extended matching protocol is necessary for this study.
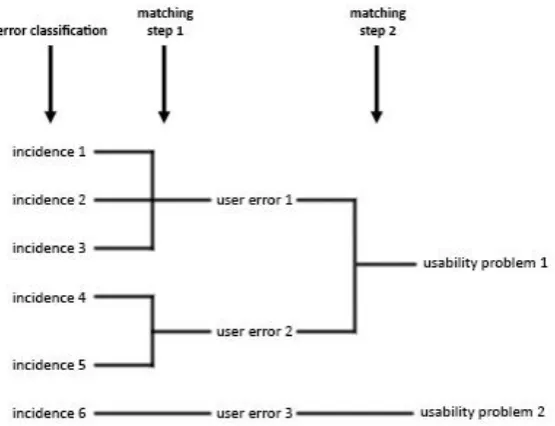
As an expansion on the existing method of Lavery et al. (1997), this study proposes to use an extended matching scheme that includes a step between the matching of incidents to usability problems, where incidents are classified in different error categories. Figure 3 illustrates all steps that are taken in the extended matching scheme. As can be seen in this figure, the incidents are first classified into error categories, before any matching. After the error classification, incidents are matched using the method by Lavery et al. (1997) and the acquired error categories to create what will be called ‘user errors’. These user errors can be seen as more generally described error description consisting of a group of incidents with the same error classification that also show similarities in their descriptions. Incidents that are the same based on the method by Lavery et al. (1997) that do not have the same error classification can be checked to see if they lead to different user errors, or that an error classification was wrong. Incidents that were classified as unknown at first can also be matched to user errors based on the method by Lavery et al. (1997) and will take on the error classification of the user error. The user errors that are retrieved from the added matching step can then be matched a second time to form usability problems. These usability problems can potentially consist of multiple error classifications, as a usability problem can be encountered as a consequence of various different types of behaviours.
Figure 3. Extended matching protocol. Error classification methods
problems and show some similarities: the skills, rules and knowledge framework by Rasmussen (1983) and an error classification taxonomy based on action theory by Zapf et al. (1989). Both of these classification methods will be discussed briefly.
Skills, rules and knowledge
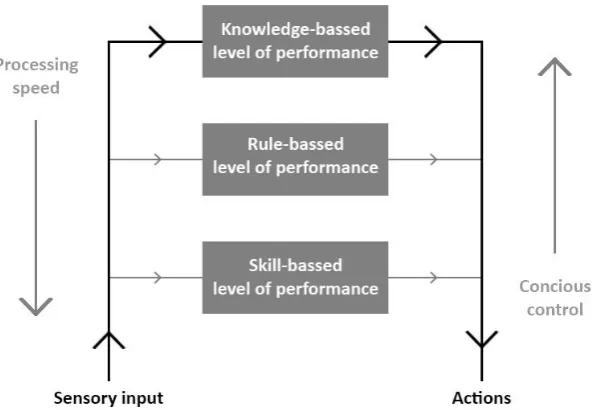
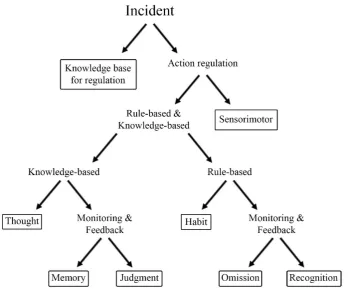
Rasmussen (1983) proposed that human performance can either be at a skill-based, rule-based or knowledge-based level. Based on the situation that a user is experiencing, a behaviour can be triggered at different levels of consciousness. Sometimes a stimulus triggers an automatic reaction that a user does not even need to think about, or a user recognises a situation and therefore immediately knows what he has to do. At other times a user will need time to consciously evaluate a complex situation before actually performing an action. The three levels of Rasmussen (1983) reflect these degrees of conscious control exercised by a user (Rasmussen, 1983; Barendregt et al., 2006).
are creating new and complex plans for certain situations with this type of performance, it can be applied at any time and regardless of the prior experience of a user (Rasmussen, 1983; Barendregt et al., 2006). The different levels of performance can also be related to the different kinds of learning curves (review figure 1). Skill-based and rule-based learning often show a gradual improvement due to the needed repetitions of action patterns to perform the task well. This type of learning is reflected by line a in figure 1. Knowledge-based learning complies with the (lack of) acquisition of knowledge necessary to perform a task instantly, as shown in line b or c in figure 1.
Figure 4. Simplified version of the behavioural model by Rasmussen (1983) showing the processing of actions on different levels of behaviour.
Reason (1990) used the framework by Rasmussen (1983) to classify errors in the human performance based on the three levels of conscious control and linked different error types to these levels. Reason (1990) made a distinction between errors that were made intentionally and unintentionally. He stated that on the skill-based level, when an action does not fit the intention of the individual, users can encounter either slips or lapses. Slips are errors that are made when the execution is wrong, while lapses are made when the retrieval of a plan goes wrong, most often due to a failure of memory. Even though slips and lapses are both made unintentional and not affected by the correctness of a plan, they are still very different in detectability. A slip is an easily detectable action that goes wrong, while a lapse is a more covert failure in memory that often does not become an action at all. Users will often be the only one aware of a lapse, while the rest of the environment can become aware of a slip when it occurs.
knowledge-based mistakes can be difficult, but can be made by the presence of the earlier mentioned indicative conditional reasoning statement that is associated with rule-based actions (Rasmussen, 1983; Haar et al., 2013).
Action theory
Another method which can be used to classify behaviour is action theory. This is a behavioural-oriented theory for information processing that tries to analyse actions by looking at regulation and cognitions. Even though Rasmussen did not mention action theory in their work, the similarities are striking and multiple researchers have linked the two methods (Zapf, Brodbeck, Frese, Peters & Prümper, 1992; Frese & Zapf, 1994; Barendregt et al., 2006).
According to action theory, an action can be described from two points of view, namely the action process and the hierarchical structure of the action (Frese & Zapf, 1994). The action process is an iterative process consisting of five steps, from forming a goal and creating a plan, to executing the plan and receiving feedback (Frese & Stewart, 1984). The feedback that is gathered by performing an action can be used to create a new goal, potentially starting the process over again, reflecting the aforementioned iterative nature of the model (Frese & Zapf, 1994). The hierarchical structure reflects the level of conscious regulation by actions using cognitions. The higher levels of regulation are associated with conscious problem solving and have a more flexible, heuristic-like nature, while the lower levels of regulation consist of more rigid algorithmic plans that are fast, processed in parallel, situation-specific and often automatized that are highly stable over time.(Frese & Zapf, 1994; Frese & Stewart, 1984). This structure resembles the skills, rules and knowledge framework by Rasmussen (1983) to a point where they can be seen as almost interchangeable (Frese & Zapf, 1994; Barendregt et al., 2006; Zapf et al., 1992). The biggest difference from the skills, rules and knowledge framework is the addition of the knowledge base for regulation, which does not have an equivalent in the framework by Rasmussen (1983) (Zapf et al., 1992). The knowledge base for regulation can be seen as prerequisites for the regulation processes and as guiding functions in preparing for an action. It consists of at least three aspects that are necessary to regulate actions: knowledge of facts, knowledge of procedures, and understanding in the sense of mental models (Barendregt et al., 2006; Frese & Zapf, 1994).
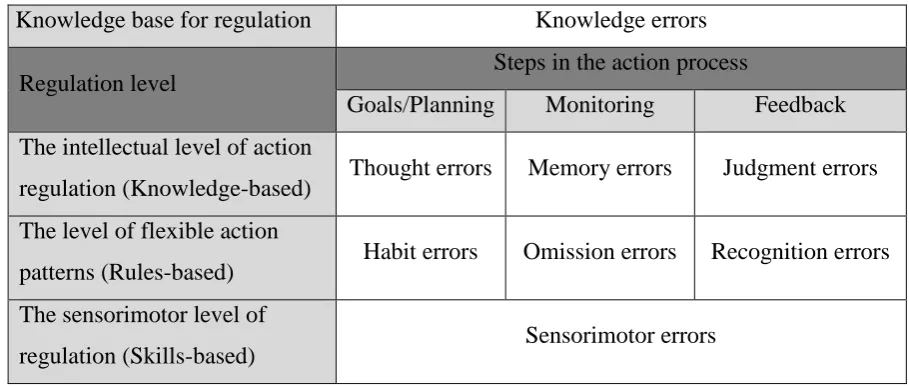
as levels of classification. The five steps from the action process were brought down to three in the taxonomy to make it easier to discriminate between the steps. The new three steps were goals/planning, monitoring and feedback, reflecting the stages before the action, during the action and after the action, respectively. For the skill-based level, the three steps were even combined into one, as it is empirically very difficult to differentiate between steps at this level, since actions are performed without much conscious control (Zapf et al., 1992). The knowledge base for regulation is placed separately in the taxonomy. The equivalents of the skills, rules and knowledge framework (Barendregt et al., 2006) were also added to the corresponding regulation levels in figure 5.
Knowledge base for regulation Knowledge errors
Regulation level Steps in the action process
Goals/Planning Monitoring Feedback The intellectual level of action
regulation (Knowledge-based) Thought errors Memory errors Judgment errors The level of flexible action
patterns (Rules-based) Habit errors Omission errors Recognition errors The sensorimotor level of
[image:19.595.67.522.274.467.2]regulation (Skills-based) Sensorimotor errors
Figure 5. A taxonomy of errors by Zapf et al. (1989), which classifies errors using action regulation and steps in the action process (Zapf et al., 1992).
The eight different error types that are incorporated in the taxonomy are explained briefly below.
Error types
Knowledge errors: The knowledge base for regulation can be seen as a prerequisite for actions
and the error type at this level is related to this concept. Knowledge errors appear when a user does not know the right commands, functions keys or rules in a program. These errors can for example be caused by inadequate instruction about the program or task (Zapf et al., 1992; Barendregt et al., 2006).
Thought errors: Thought errors occur at on the intellectual level during the goals/planning
even though they do have enough knowledge about the system’s functions and features (Zapf et al., 1992; Barendregt et al., 2006). Zapf et al. (1992) give the example for this error of a user who wants to place a 12-columnwide table on a single page, but then finds out the column width has been chosen too wide for it to fit.
Memory errors: Memory errors are found in the taxonomy at the intellectual level during the
monitoring phase of the action process. These kind of errors occur when a user forgets to perform a certain part of the plan, even though the plan itself was adequate (Zapf et al., 1992; Barendregt et al., 2006). Zapf et al. (1992) used the creation of table again as an example for this error. They described how a user plans to print a table with a number of labelled columns. After printing, the user sees that one of the planned columns has been forgotten in the table.
Judgment errors: The last error at the intellectual regulation level is the judgment error,
occurring during the feedback phase of the action process. When a user does not understand feedback after an action or is unable to interpret it, this is a judgment error (Zapf et al., 1992; Barendregt et al., 2006). Barendregt et al. (2006) give the example of a user that receives feedback on an action during computer game, but is not able to understand from the feedback if the action was right or not.
Habit errors: Habit errors are placed on the level of flexible action patterns in the taxonomy,
during the goals/planning step. Habit errors occur when a user executes an action correctly, but in the wrong situation. In other words, an action program was executed that worked in another known situation, but was wrong in this particular situation (Zapf et al., 1992; Barendregt et al., 2006). This type of error can for example occur when users switch to a new program for an old task, or after the redesign of the interface of a known program. The users will try to use the same function keys that they knew from the old situation, but these do not work in the new situation (Barendregt et al., 2006).
Omission errors: Omission errors occur at the level of flexible action patterns during the
Recognition errors: The third type of error from the level of flexible action patterns, found during the feedback step, is the recognition error. This error occurs when a user does not notice a well-known feedback message or is confused by it (Zapf et al., 1992; Barendregt et al., 2006). It might be important to note that the difference between the recognition error and the judgment error from the intellectual level is that the judgment error has to do with newly received feedback, while recognition errors have to do with interpreting feedback that has been received (and understood) before.
Sensorimotor errors: The last error type is the only one at the sensorimotor level of regulation.
The sensorimotor errors are related to the motor-skill that is required to execute an action. Examples of sensorimotor errors are accidentally clicking the wrong mouse button or pressing a button next to the one you planned on pressing.
Error classification guidelines
As stated earlier, this study wanted to create step-by-step error classification guidelines based on a clear and analytical framework to help evaluators classify incidents to an error category and use this classifications for the extended matching scheme. Since the taxonomy by Zapf et al. (1989) can be seen as an expansion on the model by Rasmussen (1983) and has more extensive descriptions of the error categories, the error taxonomy was chosen as the main inspiration for the classification guidelines. However, the classification guidelines did have an extensive introduction that presented the theoretical background of the taxonomy, including the concepts of Rasmussen (1983) and Reason (1990). The classified incidents will be matched in two steps to form usability problems that have a single or mixed error classification assigned to them. These different types of classifications will probably need different types of learning and support for a user to overcome them (Frese & Stewart, 1984; Zapf et al., 1992). As not all problems seem to require the same type of learning, different problems will also show a different persistency pattern. As the persistency patterns are dependent on the learning curves of users, it is also very important to take a look into individual differences.
Individual differences
impossible to ‘average’ them as a whole group, since you are designing for a very diverse group with a lot of different backgrounds and possible disabilities that come naturally with old age (Hawthorn, 2003; Shneiderman, 2000). To account for this individual differences, previous experience and technology enthusiasm or geekism will also be used as predictors for the persistency patterns.
Previous experience
According to Hurtienne, Horn, Langdon and Clarkson (2013), previous experience is one of the main factors influencing the performance of older adults with technology, positively influencing the speed and effectiveness of interaction (Czaja & Sharit, 1993; Fisk, Rogers, Charness, Czaja & Sharit, 2009; Langdon, Lewis & Clarkson, 2007; Lewis, Langdon & Clarkson, 2008) and should therefore be taken into account. If users practice more and gain experience, their performance will become better. Most elderly users have very little experience with technical devices and can be seen as novice users. (Hawthorn, 2003). Novice users are known to encounter much more critical and serious problems than experts (Kjeldskov et al., 2010) This means that elderly users with a lot of previous experience are expected to encounter fewer incidents in total than users with less experience.
Geekism
In their effort to investigate differences in users, Schmettow, Noordzij and Mundt (2013) tried to capture a trait of users that is associated with exploring and tinkering with technological devices. They proposed this was caused by a motivational predisposition they called technological enthusiasm, or geekism. They defined geekism as ‘an individual’s strong urge and endurance to understand the inner workings of a computer system’ (Schmettow et al. (2013), p. 2042). They tested this by a variation on the Stroop priming task, showing that subjects with a geek predisposition showed stronger association with geekism words (Schmettow, 2013). It is thought in this study that users with a geek predisposition are going to be motivated to get better at the tasks and are going to try and tinker with all options and try to look for functions beyond the task. Therefore, it is expected that ‘geeks’ will encounter more incidents on the knowledge-based level than the users which do not have this trait.
Study goal and hypotheses
severity ratings for design projects that are not able to implement a longitudinal study design. Of course, users are very different from each other and they do not always show the same learning curve. Therefore, individual differences will also be used as predictors for determining the persistency patterns of the problems. These predictors will be previous experience with the used devices and geekism. The data of the study will also be used to try and prove that measuring persistency is worth the extra effort to obtain useful and relevant information. This will be done by replicating the study by Kjeldskov et al. (2010) and comparing results. We will test the following hypotheses to investigate the mentioned objectives:
H1.Comparable to the study by Kjeldskov et al. (2010), a little over half of the usability problems that are found will be persistent. Such a proportion supports the relevancy of investigating persistency as a part of severity and problem prioritisation.
H2. A higher score on previous experience will lead to fewer encountered incidents in total.
H3. A high score on geekism will lead to a higher number of encountered knowledge-based incidents.
H4. The usability problems encountered on the knowledge-based level and level of knowledge base for regulation will disappears suddenly or not at all. The problem will be persistent, until the knowledge is acquired. Then the persistency pattern will decrease very strongly in a short time. When the knowledge is not acquired the pattern will stay at the same level. Knowledge-based problems and level of knowledge base for regulation will therefore either be persistent or disappear early. H5. Usability problems at the rule-based level will show persistency pattern that gradually decreases with more experience with the devices. Due to formed habits from earlier trials, it is also possible for problems to appear in later trials. Rule-based problems will therefore either be persistent or appear late.
Methods
SampleFor this test phase of the MOBILE.OLD project a sample was needed with elderly users over 60 years old who were interested in helping the development process of services for elderly. The NFE provided a sample as large as possible, consisting of twenty elderly users from Bunnik, where the main office of the NFE is located, and a care centre in Amersfoort. The NFE used its own network of known elderly and elderly activity groups in the Bunnik area to get participants. In Amersfoort, a supervisor of the care centre helped to find participants by asking the elderly in the care centre if they would be willing to participate. Every participant signed an informed consent form that was provided by the NFE. The participants received a small token of gratitude for their help after the first session was finished.
Unfortunately, the video files of one user (User 7) were corrupted and it was not possible to analyse his video clips. User 7 was therefore removed from the dataset and the data analysis was performed with 19 users between the age of 61 and 82 (M=70.68, SD=5.38). Six of these users were male, thirteen were female and all users had a Dutch nationality.
Material
Services
MOBILE.OLD prototype applications were developed by a number of technical partners from Greece, Romania and Austria that were all involved in the consortium of the MOBILE.OLD project. Ten types of services were developed in the MOBILE.OLD project in total, which focussed on providing information, physical training support, orientation services and fun. The applications run on Android and were specifically developed for High Definition televisions, smartphones and tablets. All the applications were translated to Dutch before using them in the tests. Every application was only tested on one of the three devices, the one that seemed most suited for the type of service. This division of services over the devices was an agreement between multiple project partners of the consortium, to make sure every testing site would use the same division. The individual services will be described further below:
My Activity (Smartphone): This application uses the GPS to track users when they are hiking,
My Checklist (Tablet): This application can be used to create and edit lists. The items on a list can be checked and unchecked. The items can be added to the list by inserting text, recording an audio message or by making a photo of something (for example of an old packing of something you need from the grocery store). It is also possible to add a (recurring) alarm for a list.
My First Aid (Tablet): This application shares information about how to perform basic first
aid. The instructions are shown in text and images and can also be read out loud by the application. The application has a phonebook with all the phone numbers of emergency services in a certain country as well.
My News (Television): This application shares live traffic news and weather reports. Users can
find possible delays for travel by car, public transport, airplane and information about the current weather on their location when they use this application.
My Orientation (Smartphone): This application can be used to find the location of points of
interest in your direct area. These locations can be saved to the device and a route can be calculated to a location.
My Quiz (Smartphone): This application can be used to create somewhat of a scavenger hunt.
The device can be used to (manually or automatically) select locations, which a user needs to find and travel to with the help of a compass that points in the direction of the next location. When users arrive at the correct location, they are asked two questions about the location or the area.
My Safety (Smartphone): This application was made for a more specific group of elderly,
who have psychological disorders. A caretaker can use a program to draw safe zones and hazard zones on a map for someone, which is also called ‘geo-fencing’. The application uses the GPS signal to detect if a user is in a safe zone or not. If the user leaves this a safe zone, he/she gets a message that asks the user to return to the safe zone or if they need help. If they do not respond before a certain time, the caretaker gets a message with the last known location of the user.
Due to the different focus of this application and the different user group it targeted, it was later removed from the analyses in this study.
My Training (Television): This application shares exercise videos for physical training and
can be accessed in the application. When you are scheduled to do an exercise, the system gives you a reminder.
My Trip planner (Television): This application uses Google maps to calculate and/or save a
route. After inserting your destination of choice in this application or selecting a saved route, Google maps is started with your route. The navigation of Google maps can then be used to navigate to your destination.
My View (Tablet): This application uses Google Street view to give users a virtual tour of
chosen locations. After you choose the location you want to view from a library in the application, Google Street view is launched at the chosen location. This application can be used to view locations someone wants to visit, or to show where you have already travelled.
Questionnaires
A number of questionnaires were used to assess usability as well as the predictors for the classification. All of these questionnaires can be found in appendix A. For assessing user satisfaction, the after-scenario questionnaire (ASQ) (Lewis, 1995; Lewis, 2002) was used. The ASQ has been found to be a good way of assessing subjective usability and was administered after each task during all three trials. It consists of a three scales between one and seven, asking about how satisfied a user is about a certain aspect of a product. Experience was assessed by a questionnaire developed for this study. This questionnaire, consisting of 13 items, focussed on experience with mobile phones and television rather than smartphones and smart TV, as it was expected that almost no elderly user would have had much experience with the newer devices. The score on the experience questionnaire could vary between zero and 36. To assess geekism, a questionnaire by Schmettow et al. (2013) was used. This questionnaire consisted of 19 items that a user had to answer using a six-point Likert scale. The questionnaire also featured a separate category for if the users did not know which answer to choose, which was given the scales mean value of 3.5. The scores of the 19 items were averaged to get one geekism score for each user.
Think aloud procedures
judgment of usability (Ericsson and Simon, 1993). There are two forms of think aloud procedures: concurrent think aloud (CTA) and retrospective think aloud (RTA). While CTA asks users to think aloud while working through the tasks, RTA records all actions by the user and then plays the footage back to the user self. The user can then think-aloud and verbalise his thoughts and actions (Van den Haak, de Jong & Schellens, 2003). For this study, we chose a hybrid form where CTA was used as a default technique, but users could also be asked about their thoughts and actions after the task was done (RTA). The users were not shown the footage of the actions, but the researcher asked them about a certain part of the task directly after the task was done. As RTA takes longer and could bias the users for their next trials, these questions were only asked if something was unclear to the researcher during the testing.
Apparatus
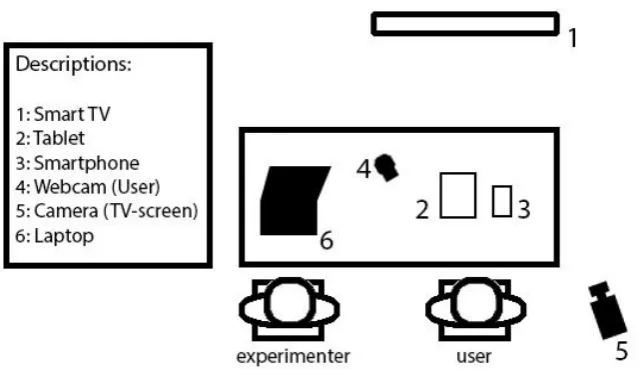
The users performed tests with applications on a Samsung Galaxy Note Smartphone, a Samsung Galaxy Tab 3 and a High Definition television. An Android Set-Top box was connected via HDMI to the High Definition televisions and used to present the applications on the televisions. The Set Top Box was controlled by a wireless Android remote that controlled the mouse pointer on the screen and featured a keyboard for typing in the applications. All testing locations had a Wi-Fi network, which was necessary for the applications.
Figure 6. Setup of the experiment. Procedure
The elderly users were invited to come by the head office of the NFE in Bunnik, a care centre in Amersfoort, or were visited at home. The complete study consisted of two sessions, one week apart. The first session featured the first and second trial and the second session featured only the third trial. When users started the first session, they were first explained about MOBILE.OLD and its goals. They were then presented with an informed consent, a task list and a workbook featuring all the questionnaires for this study. The users were also explained and encouraged to think aloud during tasks, according to the described think aloud procedures. Lastly, the users were asked for permission to be recorded on video for analysis. The workbook was divided in four chapters. The first chapter featured the questionnaires which were used to collect information demographic and individual information of the users. The second, third and fourth chapter featured the ASQ-scales for the first, second and third trials, respectively.
(thus interaction with the touchscreen) and the other filming the activity on the TV-screen. The program BBQ screen recorded the touchscreen, so no camera was needed to record this. After all tasks were finished, the PSSUQ and a market survey were also filled in by the user. The results of these questionnaires were not used in this study, but were provided to the MOBILE.OLD project, as they requested.
Once the users completed the first trial, they got a 15-minute break to drink some coffee or tea. It was the aim in this study to keep the time limited to a maximum of 90 minutes for each trial, to take guidelines for running experiments with elderly users into account (Barrett & Kirk, 2000; Lines & Hone, 2004). After the break, the users were asked to start on the next chapter of the workbook, which featured the second trial. They were asked to repeat the 13 tasks and fill in the related ASQ scales. After completion of the second trial, the respondents had finished the first session.
After approximately a week, the users were again invited or visited for the second session and the third trial was performed. The users repeated the tasks for the third and last time and filled in the ASQ scales, completing the entire workbook. The users were thanked for their cooperation and were given a voucher as a token of gratitude when they had finished the second session.
Data Gathering & Analysis
The video recordings were analysed using Morae, looking for incidents. When something happened in a recording that needed to be reviewed, a marker was placed in Morae. Almost 3000 markers were placed and investigated, leading to a total of 1424 incidents. These incidents were then classified using newly created guidelines based on the work of Zapf et al. (1989) & Zapf et al. (1992). After obtaining the classifications, the incidents were matched to form user errors and usability problems, respectively.
Problem classification guidelines
put in the text to help with the navigation of the guidelines. An overview of the steps in the classification guidelines can be seen in figure 7.
Figure 7. Overview of the steps that are taken in the classification guidelines. Every step consists of a choice between two alternatives until an error category is reached. These error categories were marked by a rectangular box.
options to go forward in the steps. When a choice led to a final category, control statements and examples were given to do a final check on the category. When it was unclear to what category an error needed to be assigned, errors were put in the unknown category. Approximately 10% of the incidents were assigned to the unknown category. The error classification guidelines that was used can also be found in appendix B.
Matching process
The incidents were first matched to create user errors using the method by Lavery et al. (1997) (Hornbæk & Frøkjær, 2008; Haar et al., 2013), and the error classifications. The method by Lavery et al. (1997) consists of dividing and describing the incident in a number of components such as context, cause, breakdown and outcomes (Lavery et al., 1997). By extensively describing the incident, it is possible to compare multiple aspects of the incident among one another. For the matching in this study, incidents were combined when they resembled each other very much in multiple categories and combined each other in the error classification that was determined by the guidelines. Incidents in the unknown error category were also reviewed, to see if incidents that did have a classification resembled incidents in the unknown category on multiple components. If possible, the incidents from the unknown category were added to a user error. Since this study wanted to find as many different errors as possible, user errors that were represented by just one user were still included, other than some studies choose to do (Fu et al., 2002; Følstad, Law & Hornbæk, 2012). As advised by Følstad, Law and Hornbæk (2012), these errors were checked to see if they were artefacts from the test situation. If this was true, the errors were disregarded and removed from the dataset.
These user errors, which accounted for 4% of the total number of user errors, were therefore disregarded and were not represented in the obtained usability problems Figure 3 can be reviewed for a visual representation of the described steps in the extended matching scheme. As is visible in this figure, the situation where one user error leads to multiple usability problems is disregarded in this study.
The error classifications were used as input to form usability problems, but it often happened that a usability problem consisted of user errors from different error categories. This can happen when user errors are caused by the same design issue, but this design issue leads to different kinds of behaviour. To be able to still see the error classification for the usability problems, a different approach was chosen. The number of incidents in a certain error classification that were matched to a usability problem, were divided by the total of incidents matched to that usability problem. This was done to acquire the percentages of how many incidents that were added to a usability problem via user errors were classified as a skill-based, rule-based, knowledge-based, unknown or knowledge base for regulation error. The regulation levels were not further specified in the steps of the action process, as some error categories were almost unused. Each percentage was used as a predictor in the statistical model during analysis.
Binary coding
We made a detection matrix for usability problems for each separate trial. By combining the three matrices from each trial, it was possible to create a binary code reflecting the presence of a problem over the three trials for a certain user. These binary codes all reflected a specific persistency pattern, but some of these patterns reflected the same trend. The codes were combined to create three groups, each consisting of three binary codes reflecting the same trend for a problem:
Group 1: Problem appears early, then disappears (100, 010, 110)
Group 2 Problem appears in later trial (001, 011, 010)
Group 3 Problem is persistent over time (011, 111, 101)
The three groups reflected trends of problems that are interesting to designers. The persistent problems are the most interesting to designers and should always get the highest priority in the next redesign phase. Problems that appear in later trials could be caused by flaws in the advanced options that users encounter when they are more acquainted with the services, or due to wrongly formed habits. Not all users will encounter these problems, as not all users will be interested in advanced functions. However, these problems are still interesting to the designers, as the advanced functions will let you use the service to the full extent. These problems should therefore be a significant priority during re-design, but problems to the basic functions of the application should always get a higher priority. Problems appearing early and then disappearing can be often disregarded by designers if resources are not available.
Contribution of persistency
This study also used its data to investigate a sub goal about the relevance of testing persistency. The testing of persistence can only be useful if the proportion of persistent problems is not too large and not too small, as this would both make persistency irrelevant to problem prioritization. The relevancy of persistency was tested by replicating the study by Kjeldskov et al. (2010). As discussed earlier, Kjeldskov et al. (2010) tested a user group twice, with the sessions a year apart. They looked at how many usability problems were gone, how many had persisted and which problems were newly encountered. These three groups were compared to the disappear early, persistent and appear late trends from this study, respectively. To compare the results from this study to the study by Kjeldskov et al. (2010), the data was structured in the same manner. Kjeldskov et al. (2010) disregarded usability problems that were only found by one user. To account for this, only the usability problems found by more than one user in a certain trial were used for this comparison. As a consequence, seven usability problems were not taken into account, meaning that the total number of usability problems that were used was 42. Kjeldskov et al. (2010) divided their usability problems into three different categories: critical problems, serious problems and cosmetic problems. As this study did not use such a division, all problems from the study by Kjeldskov et al. (2010) were computed into a single score.
Results
Kjeldskov et al. (2010), the error classifications and the persistency patterns. The analyses for the discovery rates for the user errors and problems, the ASQ scores for satisfaction and time on task scores can be found in appendix D. A list of all the found usability problems can be found in appendix E.
Contribution of persistency
[image:34.595.79.356.331.561.2]The results of the study by Kjeldskov et al. (2010) were compared to the scores of users in the current study after the third trial. The presence of a problem at first use were compared to the presence of a problem after a year of extensive or in the third trial of the study by Kjeldskov et al. (2010) or the current study, respectively. Figure 8 shows the number of usability problems for the three different levels of severity by Kjeldskov et al. (2010) as seen in their article. These three levels of severity were ‘critical problems’, ‘serious problems’ and ‘cosmetic problems’.
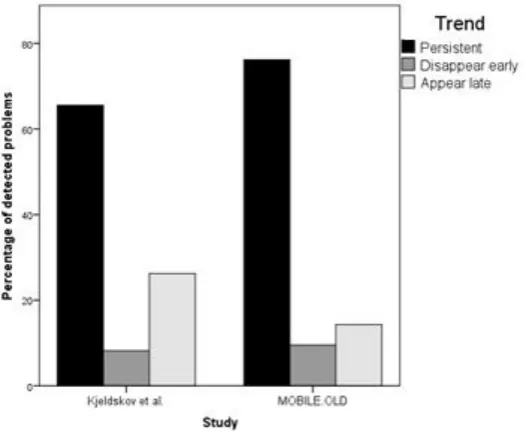
Figure 8. Representation of persistency in the study by Kjeldskov et al. (2010).
problems than the study by Kjeldskov et al. (2010) with 67% to 76%, respectively. The percentages still seem to be relatively alike, or at least of the same order of magnitude.
Figure 9. Comparison of problem persistency in the study by Kjeldskov et al. (2010) and the current study. Error classifications
Figure 10. Distribution of the eight different classifications and the unknown category for incidents, user errors and problems.
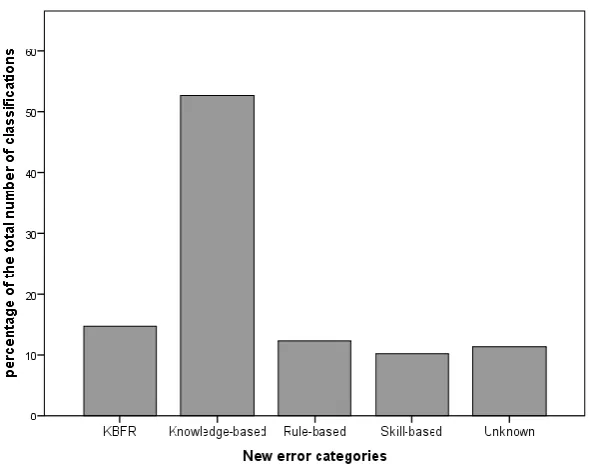
Figure 11. Distribution of new classifications for usability problems.
During the testing, one of the five covariates that explained the error classifications in a problem became redundant in the statistic model due to an unknown reason. This was always the last covariate in the model in the SPSS editor window. To account for this, it was decided to remove one of the covariates from the model, which neutralised this effect. As the unknown classification was the only classification that was not necessary to accept or reject the hypotheses, this classification was removed from the model.
Individual differences
by Zuur, Leno and Elphick (2010), which can be found in appendix F. These checks showed the possible presence of overdispersion. As the dependent variable consisted of count data that could only take on integer values a negative binomial distribution was used. This was chosen in favour of the often used Poisson model, due to the violations in the assumptions for that statistical model. To account for possible effects of learning and fatigue, autoregressive generalized estimated equations were performed. The results of the analysis can be found in table 1 and the syntax for the regression in appendix G.
Table 1
Results from generalized estimated equations with Poisson distribution for previous experience Parameter Beta Standard Error
95% Confidence Interval
Lower bound Upper bound Significance QICC Intercept 5.127 1.895 1.414 8.841 0.007 421.509 Previous experience 0.021 0.112 -0.198 0.241 0.850
Age 0.017 0.027 -0.035 0.069 0.519
Previous experience * age -0.001 0.002 -0.004 0.002 0.670 Geekism -0.028 0.067 -0.159 0.104 0.679 Geekism * KBFR 0.343 0.134 0.081 0.605 0.010 Geekism * knowledge-based -0.120 0.083 -0.283 0.043 0.150 Note. Due to an unknown reason, one of the classification covariates always became redundant in the statistic model. Therefore, the unknown classification was removed as a covariate from the model.
The main effect for both previous experience and age and the interaction effect between previous experience and age can be seen at the top of the table. No significant results were found for these predictors. The results showed very low beta values for all predictors and the confidence intervals around zero made it impossible to view the direction of the effects. The results also showed no main effect for geekism or interaction effect for geekism and the percentage of knowledge-based problems, with low beta values and no clear direction of the relation shown by the confidence intervals. However, there was a significant interaction effect found for geekism and the percentage of knowledge base for regulation problems. The positive beta value of .343 indicated that users with a high score on geekism encountered a more incidents that were classified as KBFR than users with a low score on geekism. Exponentiation of the beta value showed that an increase of one unit on geekism led to a raise of 1.4 in the number of encountered incidents.
Persistency patterns
Disappear early
would be appropriate (Zuur et al., 2010) and showed a violation of the normality assumption. These checks can be found in appendix F. As stated by Zuur et al. (2010), linear regression is relatively robust against such a violation and transforming the data could make differences harder to detect. Therefore it was chosen to not transform the data and use the generalized estimated equations regardless of the violation. Due to the binary dependent variable, a binary logistic distribution was chosen with an autoregressive model to account for possible learning effects and effects of fatigue. The results for the percentages of KBFR and Knowledge-based classifications are shown in table 2. The syntax for the regression can be found in appendix G.
The table shows that no main effects for were found for knowledge-based problems and KBFR problems on the trend to disappear early. The beta values are large enough to indicate an effect, but the confidence intervals are too wide to show certainty for a direction of the effect or a relation at all. The results did indicate a significant negative effect for rule-based problems, indicated by the beta value of -1.390. Exponentiation of the beta value for a binary logistic value gives us the odds ratio of .87, which means that the odds of disappearing early for a rule-based problem are 1.14 times smaller (1/.87=1.14) than the odds for other problems types. This effect would indicate that a lower number of rule-based problems will disappear early compared to other problems, but this is not a very large effect.
Appear late
With the presence of the appear late trend selected as a dependent variable, the generalized estimated equations were performed once again. As can be seen in appendix F, the assumptions were once again checked. This showed that the data violated the same normality assumption as the disappear early pattern showed. Despite the violation, the generalized estimated equations were again deemed to be robust enough to account for the violation (Zuur et al., 2010) and used. Due to the binary dependent variable, a binary logistic distribution was chosen again with an autoregressive model to account for possible learning effects and effects of fatigue. The results Table 2
Generalized estimated equations for problems that disappear early Parameter Beta Standard Error
95% Confidence Interval
Lower bound Upper bound Significance QICC Intercept 0.725 3.972 -7.059 8.509 0.855 920.886 Knowledge-based -0.961 0.591 -2.119 -0.197 0.104
for the percentages of rule-based classifications are shown in table 3. The syntax for the regression can be found in appendix G.
Table 3
Generalized estimated equations for problems that appear late Parameter Beta Standard Error
95% Confidence Interval
Lower bound Upper bound Significance QICC Intercept -2.051 6.115 -14.036 9.935 0.737 848.018 Rule-based 0.276 0.362 -0.433 0.986 0.445
Note. Due to an unknown reason, one of the classification covariates always became redundant in the statistic model. Therefore, the unknown classification was removed as a covariate from the model.
The results did not show any significant effects for the trend to appear late. The results showed a confidence interval around zero, making it impossible to indicate if there is a relation between the rule-based classification and the appear late trend.
Persistent
Generalized estimated equations were performed a last time, after the data was checked on statistical assumptions (Zuur et al., 2010). These checks can be found in appendix F. Besides the presence of heteroscedasticity and some outliers, no violations were found. Due to the binary dependent variable, we chose a binary logistic distribution here as well with an autoregressive model to account for possible learning effects and effects of fatigue. The results for percentages of error classifications are shown in table 4. The syntax for the regression can be found in appendix G.
[image:40.595.73.519.518.600.2]As visible in table 4, there were no significant effects found for the persistent trend. Even though the beta values often indicated an effect, the confidence intervals were too large to interpret the direction of the relations or if there was a relation at all.
Table 4
Generalized estimated equations for problems that are persistent Parameter Beta Standard Error
95% Confidence Interval
Lower bound Upper bound Significance QICC Intercept 4.619 6.499 -8.119 17.356 0.477 402.409 Skill-based 0.102 0.569 -1.014 1.217 0.858
Rule-based -0.172 0.965 -2.062 1.719 0.859 Knowledge-based 0.492 2.321 -4.058 5.042 0.832
KBFR 0.951 2.713 -4.367 6.269 0.726
Discussion
FindingsContribution of persistency
The replication of het study by Kjeldskov et al. (2010) showed a very comparable level of problem persistency in both studies and hypothesis H1 will therefore be accepted. The level of persistency was a little higher in the current study, but this was not surprising. The difference between time that users had to interact with the system in the study by Kjeldskov et al. (2010) and the current study would explain this difference. Users in the study by Kjeldskov et al. (2010) had a whole year to work with the ERP system and still 66% of the problems persisted, compared to 76% of the problems over three trials in the current study. It seems that testing three times will give you an adequate approximation of an expert level performance in these kind of situations.
As the results of both studies are very much alike, the conclusions by Kjeldskov et al. (2010) will translate to these results as well. Both studies support the idea that it is important to investigate the persistency of problems, as some problems will not fade away just by becoming more experienced with a system or service. The percentage of persistent problems in both studies show that it should be worthwhile to investigate the persistency. It will help developers in prioritizing their problems, as about 25% of their total number of problems could receive a lower priority with regard to persistency. Prioritization can of course not be done based only on these kind of numbers of persistency, as the frequency and impact would then be disregarded. However, the numbers from both studies support the idea that persistency is an equally important component of severity as frequency and impact, since persistency was able to discriminate between problems in a way that frequency and impact could not.
Individual differences
also not taken into account in the results for previous experience. This may be of influence on the results of this study.
The results showed only a relation for geekism with knowledge base for regulation (KBFR) incidents but no effect for knowledge-based incidents, so hypothesis H3 can be partially accepted. Users with the geek trait were hypothesised to be very curious of new features and would try out functions that they did not yet know. It was also hypothesised that the same curiosity would also lead to more knowledge-based problems, but this was not the case. Every user encountered mostly knowledge-based problems when faced with a new device, not just the geeks.
Persistency patterns
The results of this study showed no relation between KBFR problems and the disappear early trend. Likewise, no relation was found between the knowledge-based problems and the disappear early trend. For this reason hypothesis H4 is rejected. Something that did became apparent is that the knowledge-based problems accounted for a very large part of the total number of problems compared to other classifications. This large proportion, more than half of all classifications, could indicate that knowledge-based problems are the main category that developers and designers should target when trying to support elderly users during their first interactions with technical devices, as this is the most common error classification.
Furthermore, no significant effects were found for the relation between rule-based problems and the appear late and persistent trend as well. The analysis for the disappear early trend did find a significant negative effect for rule-based problems. If rule-based problems are less often found to disappear early, this is in support of the hypothesis H5 that rule-based problems either appear late or are persistent. However, this effect was so small that the hypothesis H5 will still be rejected.
Relevant implications
The results of this study have several relevant implications for usability research. This study set out to provide researchers with an easier and possibly cheaper way to assess persistency for severity ratings, as well as to show that these efforts are worth it by showing the relevancy of persistency to severity. It proved difficult to predict the persistency of the problems that elderly encountered during their learning efforts based on error classification. We found no insightful relations between the persistency patterns and the classifications, so there is no proof at this point that it is possible to predict persistency using error classifications. Despite not finding possibilities to predict persistency, we found persistency itself to be a very useful concept to usability research. The comparison between the current study and the study by Kjeldskov et al. (2010) showed that the results of both studies are in favour of measuring persistency in usability research. Persistency was able to make distinctions in prioritization that a severity rating based on frequency and impact was unable to do. If resources are available, it is valuable to use a longitudinal design early in the project to help with determining the severity of problems. The costs of alterations to your product in a later stage of development are known to be vastly higher (Boehm & Basili, 2005) than early stages, so this can make the extra effort in early stages worthwhile in the long run.
The significance of persistency to usability research also has implications for the much debated subject in usability testing of how many subjects are necessary for a successful usability evaluation. A lot researchers believe that four or five users should be sufficient during testing to find up to 85% of the possible usability problems and that this percentage should be enough. This idea is based on the equation
𝐹𝑜𝑢𝑛𝑑(𝑖) = 𝑁(1 − (1 − 𝜆)𝑖) (2)
is different probability for finding a problem in a second or third trial. If the probability for finding a certain problem would remain the same, this would mean that one user tested three times is worth the same as three users. If there is no additional detection for a single user at all during later trials, this mean that multiple trials are irrelevant for the detection rate of usability problems. Of course, the truth will be somewhere in the middle, but it may be interesting to investigate this further and to test the appropriateness of equation 2 (Nielsen & Landauer, 1993) for longitudinal designs.
working career, so the use of smartphones among the elderly will surely increase in the not too distant future. However, specialized designs will be remain necessary to support this age group and problem severity is very useful in the process of developing these designs.
It is not clear if the found results on persistency and error classifications can be generalized, since elderly users have been marked as a specific user group (Hawthorn, 2003; Shneiderman, 2000). Some studies have argued that adults learn vastly different from children and adopted the concept of androgyny, which differentiates between the learning processes of these two age groups (Purdie & Boulton-Lewis, 2003; Knowles, 1996). This is also supported by the described differences in the number of knowledge-based problems and KBFR problems found by children in the study by Barendregt et al. (2006) and by elderly in the current study. Purdie and Boulton-Lewis (2003) stated that it may be most productive to look at the learning needs of users of different ages, rather than the age itself. This may also be true for the learning of elderly users, as they will probably have other learning needs than their younger counterparts. For example, Purdie and Boulton-Lewis (2003) found in their study that transportation was one of the most important learning needs for the elderly, as they had often lost their driving license. This is a need that would be very different in other age groups. Learning needs may not only be found to be different for age groups, but also for other subgroups in the population. The concept of learning needs could show to be good addition to predictors for the persistency patterns besides the individual traits that users show.
Study limitations
was difficult to make strong arguments about the error types that were not found often. Fourth, the classification guidelines that were used were not used before. A number of cases were encountered that were difficult to classify. These cases were registered to be able to use them to improve the guidelines. Last, an important limitation for the results section was the overlap in use of binary codes for the trends. For example, the code 010 was used in the appear late trend as well as in the disappear early trend. As some cases were used more than once, it could have potentially lead to overrepresentation of significant effects. However, even with this overlap no clear results were found for predicting the trends, so the limitation did not lead to different conclusions.
Future research
The results of this study indicate that predicting problem persistency based on error classifications is not very promising. Predicting persistency based on the intuition of a usability expert may deliver better results than the use of the classification guidelines, but this would have to be researched before any definitive conclusions about predicting persistency can be made. Even though the prediction of persistency did not show any real results, persistency itself was proven to be very relevant to the field of usability testing. We were able to make distinctions between problems based on persistency that frequency and impact could not. We strongly advise developers to consider using longitudinal designs more often and to use the retrieved results as input for an objectively calculated severity rating. As stated, it seems necessary to investigate how well problem persistency can be predicted by expert intuition before any definitive conclusions about predicting persistency can be made.