1
Faculty of Engineering Technology
Route choice and speeds of
cyclists in S˜ao Paulo
Rutger Meester
Bachelor Thesis - Final Version 20th of July 2018
Supervisors:
Preface
In the curriculum of the Civil Engineering bachelor at the University of Twente, students com-plete a ten week research in which they use their gained knowledge of the past three years into a project in the field of civil engineering. Personally, I have performed an internship at the Escola Polit´ecnica (POLI) of the University of S˜ao Paulo, which took place between April and July 2018.
Contents
1 Introduction 1
1.1 Project context . . . 1
1.2 Objective . . . 2
1.3 Research questions . . . 2
1.4 Research method . . . 3
2 Theoretical framework 5 2.1 Cycling in S˜ao Paulo . . . 5
2.2 Factors of cycling speed . . . 8
2.3 Factors of route choice . . . 9
3 Methodology 12 3.1 Data collection . . . 12
3.2 Data processing . . . 14
3.3 Composing expected routes . . . 15
4 Data preparation 16 4.1 GPS point cleaning . . . 16
4.2 Raw data quality . . . 18
5 Results 23 5.1 General characteristics . . . 24
5.2 Cycling speeds . . . 26
5.3 Route choice . . . 28
6 Conclusion 32
7 Discussion 33
References 35
A Pedaladas app 38
B Survey questions 40
List of Figures
1.1 Conceptual model research method . . . 3
2.1 Schematic overview of the cycling infrastructures in S˜ao Paulo . . . 7
2.2 Spreading of cycling facilities among S˜ao Paulo . . . 7
2.3 Land use within the city of S˜ao Paulo . . . 10
2.4 Slopes within the city of S˜ao Paulo . . . 11
3.1 Shared bicycle stations and their capacity . . . 13
3.2 Method to process the raw data into the desired results . . . 14
3.3 Visual overview of the route choice comparing . . . 15
4.1 Places of excluded points of trips . . . 18
4.2 Amount of excluded points per weather condition or temperature . . . 19
4.3 Amount of points per user . . . 19
4.4 Amount of captured and excluded points per day . . . 20
4.5 Percentages of excluded points per reason per day . . . 20
4.6 Amount of excluded points per hour of the day . . . 21
4.7 Difference between collected and actual altitude of captured GPS points . . . 21
4.8 Difference between collected and actual speed between captured GPS points 22 5.1 Routes of users in S˜ao Paulo . . . 23
5.2 Amount of average trips and users per day . . . 24
5.3 Amount of average trips per weather condition . . . 25
5.4 Amount of average trips and users per day . . . 25
5.5 Speed of cyclists in S˜ao Paulo . . . 26
5.6 Speed on different slopes in S˜ao Paulo . . . 27
5.7 Differences between lengths expected and collected route . . . 28
5.8 Differences between average percentage of distance on cycling infrastructure 29 5.9 Differences of distance on cycling infrastructure . . . 29
5.10 Difference between average amount of slopes on routes . . . 30
5.11 Land use along the collected and expected routes . . . 31
7.1 Percentage of total cycling infrastructure per neighbourhood . . . 33
List of Tables
2.1 History of cycling in S˜ao Paulo . . . 6
4.1 Points after data cleaning . . . 16
4.2 Histogram of accuracy points . . . 17
5.1 Speeds on road section in So Paulo . . . 26
5.2 Percentages for land use along routes . . . 31
7.1 Automatic cycling trips detection . . . 34
List of acronyms and abbreviations
BSS Bike Sharing System
CEM Centro de Estudos da Metr´opole
GPS Global Positioning System
NGO Non-Governmental Organisation
POLI Escola Polit´ecnica
RMSP Regi˜ao Metropolitana de S˜ao Paulo
Abstract
Over the past decades, cycling has become a more important aspect of traffic in S˜ao Paulo. In order to increase the number of bike users in the city, different improvements have been introduced. New infrastructure has been built to guarantee cyclists their own spot on the road, new regulations have been implemented to guarantee safety and awareness to other road users, as well as more room for cycling on Sundays and holidays to introduce cycling to new users.
This thesis focuses on the collection, processing and analysing of cyclist trips in the city of S˜ao Paulo. Goal of the thesis is to gain more insight in the different aspects of cycling speed and route choice within S˜ao Paulo. The approach of cycling parties CicloCidade, BikeAnjo and Tembici, along with inviting people directly from the streets, led to 26 volunteers in-stalling the Footprints travel app. Only 6 people made a total of 59 useful trips that could be used within this research. Almost 40% of the GPS points was not useful for data processing.
A GIS comparison between the expected and collected routes showed a distance favour of 15% for collected routes. 75% of the road networks contained an average speed between 10 and 30 km/h. Highest speeds are being obtained on flat surfaces, with speeds decreasing as slope increases both uphill and downhill.
Expected and collected distance on cycling facilities had a large overlap, with both routes having on average respectively around 10% and 9% of their distance on a cycling lane (ci-clofaixa). Expected routes (14%) had, compared to the collected routes (10%), on average more distance on a cycling boulevard (ciclovia). Most common land use along the routes is residential, however when taking into account the average land use in S˜ao Paulo cyclists prefer to cycle along mixed, commercial and public land use. Cyclists take on average a route that is more hilly than (35% of routes), or as hilly as (25% of routes) the expected route.
Chapter 1
Introduction
This thesis presents an approach to the collection, mapping, and analysis of cyclists expe-riences in S˜ao Paulo, starting with the associated theoretical framework. This research will explicitly focus on cycling speeds and cyclists’ route choice within the municipality of S˜ao Paulo.
1.1 Project context
Disparity is a very common appearance within the city of S˜ao Paulo. According to Watts & Forner (2017), at least 15.000 people are living on the streets. On the other hand S˜ao Paulo has the largest helicopter fleet in the world, indicating the amount of wealthy people living in the city. This disparity does not benefit the daily living in the city, and diverges the inhabitants further away from each other. To gain more equity among the inhabitants, everyone should be given a minimal solution to their needs. One of the basic and most important aspects of equity will be the one regarding accessibility. Despite the transport mode that the inhabitant uses, all people should be given opportunities to travel in a comfortable and safe way. In or-der to measure this equity among the inhabitants, more knowledge should be gained about the different transport modes. Especially more information is needed about cycling, since there is not much information available on cycling within the city.
1.2 Objective
The main objective of this research is to gain more knowledge about the characteristics of cycling trips in S˜ao Paulo. Looking at the fact that there are many uncertainties about the current travel times in S˜ao Paulo, more knowledge is needed to get a better calibration of the constructed model (Pritchard 2018). How can the different trips in S˜ao Paulo be captured, what characteristics of the network influence the cycling speed and what causes the cyclists to take certain routes? Answers on these questions will give more insight on the travel times of cyclists on the network and therefore a better working model.
1.3 Research questions
In order to reach the objective stated above, a main goal and some different sub goal are composed. These goals will give directions to the research, as well as some clear goals that should be reached. Methods to reach these research aims can be found at the end of this section in Figure 1.1.
Main research aim of this thesis is:
‘To gain more knowledge about the factors that influence the route choice and cycling speed of cyclists in S ˜ao Paulo’
This main aim can be divided into different sub aims. First of all, more knowledge about route choice in general has to be gained. Specifically, route choice in urban areas should be investigated, since this research will focus on the city of S˜ao Paulo. With this information the different characteristics to look at can be composed.
‘What factors influence cyclists’ route choice in urban areas?’
Additionally, the same knowledge should be gained about the factors that cause longer travel times in urban areas and S˜ao Paulo specifically. Therefore more insight in the cycling speeds in S˜ao Paulo will be obtained, as well as the characteristics that influence these cycling speeds.
‘What factors influence cycling speeds in urban areas?’
Also, since this research will mostly work with GPS data, more information about the col-lected points is necessary. When is the GPS data useful for processing, what information can be gathered when using the GPS data and is all information that is being collected reliable enough?
‘What data can be collected with the collection of GPS points, and what are the constraints when working with this data?’
‘Which routes do cyclists take in S ˜ao Paulo, and what is the cycling speed on these routes?’
Additionally, after finding the preferred routes in S˜ao Paulo, finding the cause of having certain route preferences is necessary. Why are certain routes more popular than others and why do these characteristics have influence on the route choice. Especially the influence of cycling speeds on route choice should be investigated.
‘What is the motivation on routes chosen by cyclists in S ˜ao Paulo?’
1.4 Research method
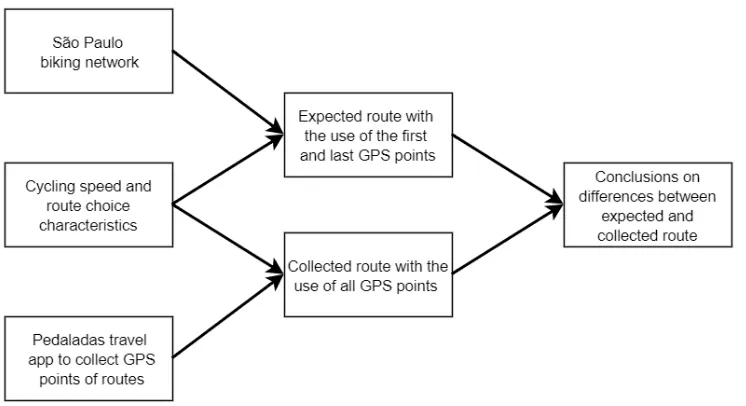
[image:10.595.126.499.326.529.2]To get the answers on all the research questions, a conceptual model has been made that helps giving the research directions. This model can be found in Figure 1.1 and is further clarified in the text underneath.
Figure 1.1: Conceptual model research method
The first step in the process is to find more information on the cycleability in urban areas. This will be done by conducting a literature study on research that has been performed in other metropolitan areas. Besides the characteristics, also more information about the sta-tus of cycling in S˜ao Paulo should be gathered. This will help in evaluating the current habits of cycling trips in S˜ao Paulo, and will give a clear overview of what role cyclists play in traffic.
Additionally, trip data will be collected with a travel app. This app collects GPS points with the use of their own mobile device. The app will help in finding the routes taken within S˜ao Paulo, and how they deviate from the expected routes. More information about the travel diary app can be found in Section 3.1.
With the use of the app two different routes can be composed. One route with just the first and the last captured GPS points which represents the expected route, the route which has been composed with the use of the bike network of S˜ao Paulo (Pritchard 2018). And another route with the use of all the collected GPS points of the trip, which will represent the actual route the cyclists has taken.
Chapter 2
Theoretical framework
Within this section, earlier research is being used to gain a better foundation for this re-search. First of all the current status of cycling in S˜ao Paulo has been investigated. Secondly the characteristics that influence the cycling speed are researched and finally the things that influence route choice are examined.
2.1 Cycling in S˜ao Paulo
The streets in S˜ao Paulo have always been characterised by a distinct hierarchy between motorised and non-motorised vehicles. Having to share the network with the motorised traf-fic, cyclists are mostly expelled to the roadsides with many obstacles like lampposts, water drainage systems or parked cars. Also, on the side walk on the other hand, cyclists con-flict with pedestrians and suffer from the kiosks and streets vendors that are present. Thus, apart from the specifically designated biking infrastructure that is only present in a minority of the streets, cyclists often do not have a reserved spot on the streets. Cycling therefore cannot be perceived as safe within S˜ao Paulo by a number of cyclists.
Not only perceived safety, also actual safety is a concern. Within the city of S˜ao Paulo, cy-cling trips represent less than 1% of the total daily trips (Sa et al. 2016). However, cyclists fatalities in road accidents are much higher at 7% of total victims, pedestrians not included (Lemas & Neto 2014). This suggests that cyclists lack a lot of safety on their routes. Safety however is rising within S˜ao Paulo, with cycling deaths decreasing from 0,76 to 0,56 per 1000 inhabitants between 2007 and 2012 while having a rise in the amount of total distance travelled by bike (Sa et al. 2016). Not only cycling safety is an issue in S˜ao Paulo, bike theft and robberies also take place more than average in Brazil. According to Freitas & Maciel (2017), 43.6% of the respondents in their survey on cycling in Brazil declared that they had a bicycle stolen.
healthy. Nevertheless, de Hartog et al. (2010) mentions that exercising by means of cycling outweighs the risk caused by air pollution. This reference also states that cycling exercise on a daily basis would benefit the life expectancy by 3 to 14 months, while inhaling pollutants would harm life expectancy by only 1 to 40 days. Also, air quality has improved over the few decades in S˜ao Paulo. As stated by Andrade et al. (2017) most of the concentrations of primary pollutants have decreased over the last 30 years. The main issue right now is to decrease the emissions of ozone and fine particles which are mostly there because of the transportation sector. Ribeiro et al. (2015) complements these statements by inform-ing about the fact that ozone particles are currently the most frequently exceeded emission standards.
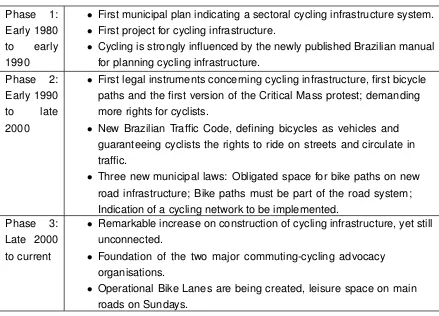
[image:13.595.90.529.448.764.2]As declared by Rolnik & Klintowitz (2011), average car speed in S˜ao Paulo during morning and evening peaks is respectively 27 and 22 km/h. This indicates that cyclist can com-pete with driving motorised vehicles during working hours. Governmental plans as well as cyclist groups, caused a lot of new options to start cycling within S˜ao Paulo over the past decades. Mainly, three different phases can be distinguished (Lemas & Neto 2014). First of all the phase where first plans and projects of cycling infrastructure were presented. Second phase indicated many legal concerns on cycling, such as defining bicycles as vehicles. In the last phase a large increase of cycling infrastructure construction started. A schematic overview of these phases can be found in Table 2.1.
Table 2.1: History of cycling in S ˜ao Paulo (Lemas & Neto 2014)
Phase 1: Early 1980 to early 1990
• First municipal plan indicating a sectoral cycling infrastructure system. • First project for cycling infrastructure.
• Cycling is strongly influenced by the newly published Brazilian manual
for planning cycling infrastructure. Phase 2:
Early 1990 to late 2000
• First legal instruments concerning cycling infrastructure, first bicycle
paths and the first version of the Critical Mass protest; demanding more rights for cyclists.
• New Brazilian Traffic Code, defining bicycles as vehicles and
guaranteeing cyclists the rights to ride on streets and circulate in traffic.
• Three new municipal laws: Obligated space for bike paths on new
road infrastructure; Bike paths must be part of the road system; Indication of a cycling network to be implemented.
Phase 3: Late 2000 to current
• Remarkable increase on construction of cycling infrastructure, yet still
unconnected.
• Foundation of the two major commuting-cycling advocacy
organisations.
• Operational Bike Lanes are being created, leisure space on main
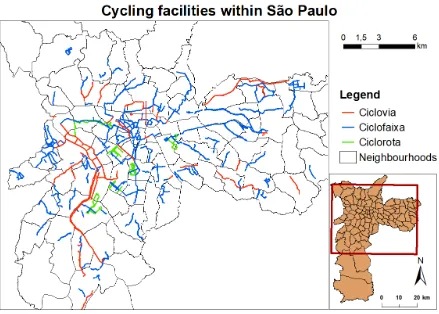
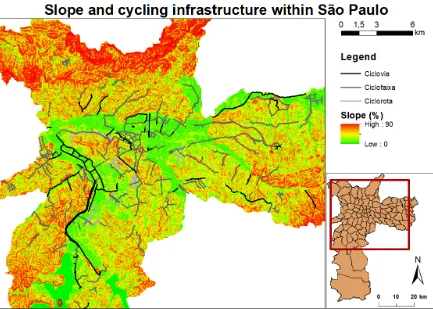
The amount of cycling trips in S˜ao Paulo has almost doubled between 1997 and 2007 (Lemas & Neto 2014). Mostly constructed between 2012 and 2017, different kinds of cy-cling infrastructure are present within S˜ao Paulo. For a schematic overview, see Figure 2.1. The spread of the infrastructure among S˜ao Paulo can be found in Figure 2.2. As seen in this Figure, most of the cycling infrastructure in S˜ao Paulo is located near the city centre and on the marginal and radial routes, the main access roads to S˜ao Paulo.
Figure 2.1: Schematic overview of the cycling infrastructures in S ˜ao Paulo(Orenstein 2017)
S˜ao Paulo’s biking infrastructure is centered around the cycling paths, ciclovias, which are present in some of the cities districts. These ciclovias are only accessible by bike and are in most cases physically separated from other traffic. However, these lanes are mostly con-structed on the central reservation, after the original driveway was finished. Therefore it has to avoid obstacles like trees and lampposts, causing it to have many turns instead of going in a straight line. Another downside of the ciclovia is that they are often very narrow, making it impossible to overtake low-speed cyclists or pedestrians, who often use ciclovias as well.
Another cycling facility within the city of S˜ao Paulo is the ciclofaixa. This facility can be com-pared with a cycling lane, which is only a marked area on a street designated for cyclists. Cyclofaixas are always combined on one side of the street, causing users to have the need to cross the street to get on one. The ciclofaixa often has no physical separation from the motorised vehicles however it is sometimes being separated with cat’s eyes or turtles, a larger variant of the cat’s eyes.
The last and most uncommon cycling infrastructure is the ciclorota. This cycling facility has no physical characteristics whatsoever, however painted icons or signs are present that in-dicate that these facilities are commonly used by cyclists. Also these streets often have traffic calming facilities, such as narrowed roads and speed bumps, in combination with a low maximum allowed speed.
On Sundays and holidays cyclists are able to use even more streets with the use of so called”conviva” streets, meaning live together in Portuguese. These cycling facilities make
up almost 30% of the total cycling infrastructure (Lemas & Neto 2014), causing a huge lift in availability. During these days one driveway on the main streets is turned into a cycling lane, offering safety with the use of pylons and traffic controllers. These days are often used by inexperienced cyclists to learn to cycle, as well as by experienced cyclists for leisure trips around the city.
2.2 Factors of cycling speed
Many factors on the route are influencing cycling speeds and therefore travel time on the network. In this section, the different factors defined in the literature are discussed.
Traffic volumes: Both Broach et al. (2012) and Sener et al. (2009) consider traffic volume to have a large impact on cycling speeds. Especially on non-separated bike lanes the influence of the mixed traffic volume was significant, as a result of less space on the cycling facilities. The researches also show that high speed limits on the adjacent road have a large negative impact on the cycling experiences, however only if the cyclists are not experienced in biking and have trips of five miles or shorter. Not only traffic volume but also pedestrians, who also make use of the cycling infrastructure, have an influence on the network speeds of cyclists. Regarding to Bernardi & Rupi (2015), a drop in cycling speed of more than 10% is present when a pedestrian is encountered on the route.
Cycling facilities: Many studies have proven that the use of separated cycling infrastruc-ture improves the cycle speed on the network (Broach et al. 2012) (Buehler & Dill 2016) (Heinen et al. 2010) (Hood et al. 2011) (Pucher & Buehler 2008) (Zimmerman et al. 2016). Besides,(Dill 2009) states that in most of the trips separated bicycle facilities were being used in their study, implying that these facilities provide fastest connections. Sener et al. (2009) also describes that small lane widths and the absence of bicycle lanes cause longer travel times on both short and long commute distances.
Pavement conditions: There are not many studies that identify the role of the quality of the facility. Mostly because the fact that the quality of the pavement is location specific and might vary within a road section. However, Brezina et al. (2012) mentions that differences between road surfaces can lead to an increase in energy expenditure of more than 100%. From this we can conclude that cycling speeds will deviate on different road surfaces, with preferences for good lane evenness and plain asphalt.
2.3 Factors of route choice
Some different factors can influence the cycling experience in a positive or negative way. As stated by Kuiper & Braakman (2009) and Sustrans (2014) five different requirements can be summarized to have a look into the wishes and demands of cyclists.
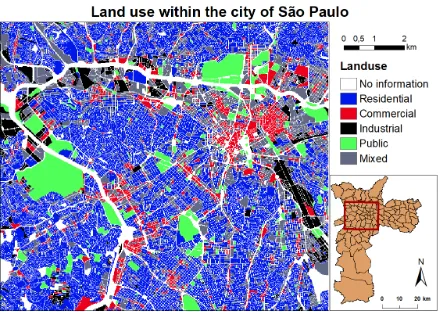
Figure 2.3: Land use within the city of S ˜ao Paulo (GeoSampa 2018)
Coherence: The cycling infrastructure has to provide connections between origins and des-tination, such that the network forms a coherent whole. As described by Winters et al. (2013) the amount of intersections also influences the coherence of a network, since highly con-nected road networks allow more routes and efficient travel. Looking at earlier statements about junctions, we can conclude that they are great for different route choices but less opti-mal looking at cycling speeds. Also Dill (2009) states that cycling is a main mode of transport in well connected street grids.
Comfort: Nuisance and delay caused by bottlenecks, crowded routes and shortcomings in the infrastructure do have a negative impact on the cyclists’ travel experience. Additional physical effort produced by this delay discourages cycling. Besides, the terrain can have an enormous impact on the cyclists’ experience on the biking network. As seen in Figure 2.4, the amount of slopes in S˜ao Paulo is critically high. This will cause a large fluctuation in cycling speed depending on the direction, as well as a large loss of human energy. However in the figure can also be seen that most of the cycling infrastructure within S˜ao Paulo has been build on places with the least amount of slopes.
Figure 2.4: Slopes within the city of S ˜ao Paulo (Trimble Data 2015) (Centro de Estudos da Metr ´opole 2018)
the route is and thereby indicates whether the cyclist had to make choices between left or right several times. The necessity to make left or right turns suggest that the directness of the route is diminished.
Chapter 3
Methodology
Within this chapter the main principles of the data collection and processing will be ex-plained. Starting with an explanation of the different data that will be collected, followed by the processing of the data.
3.1 Data collection
To gain the most knowledge about cycling in S˜ao Paulo, as much volunteers as possible have been asked to collect data for the research. Three different parties have been approached, which are further defined in the itemisation below. To grow the amount of volunteers even more, flyers have been handed out to cyclists in the Faria Lima neighbourhood to invite them to help collecting data. Faria Lima is a location with a lot of different cycling purposes, such as commuting cyclists that use the metro and transfer to a bike or leisure cyclists that use the excellent cycling infrastructure in Faria Lima.
BikeAnjo: A group of biking fanatics founded in 2010 that helps new people to ride a bike, as well as organising cycling trips around the city of S˜ao Paulo. With the use of BikeAnjo a large variety of cyclists can be reached, since both experienced and inexperienced cyclists will be part of this community. It is expected that deviations of the mean speeds will be high, but the average speed tends to be a good representation since there will be cyclists from both sides of the spectrum. However, as stated by Stinson & Bhat (2004), there is a differ-ence in route choice factors between different levels of experidiffer-ence. Inexperidiffer-enced cyclists tend to give more value to factor related to separation from cars, while experienced cyclists are more sensitive to factors related to travel time.
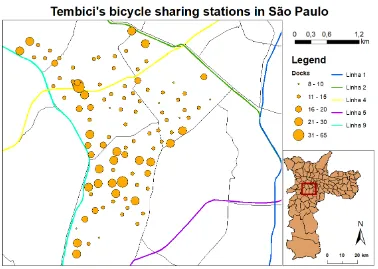
Tembici: The main operator of the BikeSampa bicycle shared system (BSS) in S˜ao Paulo. With biking stations mostly in the centre and south western part of the city, trips will mainly be generated in these areas. Places and capacity of the docking stations of Tembici can be found in Figure 3.1. As seen in this figure most of the large stations are near the public transport station, where commuters take the bicycle for the distance to their job or school. Trips made with the Tembici bikes will most likely be leisure trips or commuters that facilitate the first or last mile to public transport stations.
[image:20.595.123.501.330.599.2]As mentioned in Bikeplus (2017), nearly 25% of the people that use the BSS in their survey started or restarted cycling with a break of at least 5 years, indicating the amount of inex-perienced cyclists. Also bus and train implementation in their trips was very common, with respectively 25 and 40% of the respondents stating to use the bike in conjunction with the bus or train. Almost 70% of the shared cycling trips were between 2 and 4 miles long, with respectively 21 and 18% being made for commuting or for leisure or exercising.
Figure 3.1: Shared bicycle stations and their capacity
To gain even more knowledge about the perception on cycling in S˜ao Paulo, a follow-up survey has been held among the volunteers. Within this survey their stated preference on route choice and cycling speeds, as well as socio-economic characteristics have been collected. With the use of the data of the survey, which has been linked to the people’s trips, more information can be gathered about the different volunteers and therefore the inhabitants of S˜ao Paulo. The full survey set-up can be found in Appendix B.
3.2 Data processing
Data processing is necessary to come to the desired results in a later stadium of the re-search. To do so, a flow chart has been produced in Figure 3.2 that shows the processing of the collected data in a schematic way. This scheme shows the data cleaning of the GPS points, as well as the process from point to trip to results for every trip the cyclists have made.
As seen in this figure, first thing to do is to exclude all invalid point. This which will be further clarified in Section 4.1. Secondly every trip that has been captured by the app will be selected. After selecting the trip there are two possibilities. Depending on the calculation being an expected route or a collected route either all of the points or just the first and last point that intersect with this line will be selected. These points are being used to solve the route with the use of the network, as well as to calculate the slope and speed between these points. The route that has been composed will then be used to measure the overlap with cycling facilities and the neighbouring land use to find statistics on these characteristics.
3.3 Composing expected routes
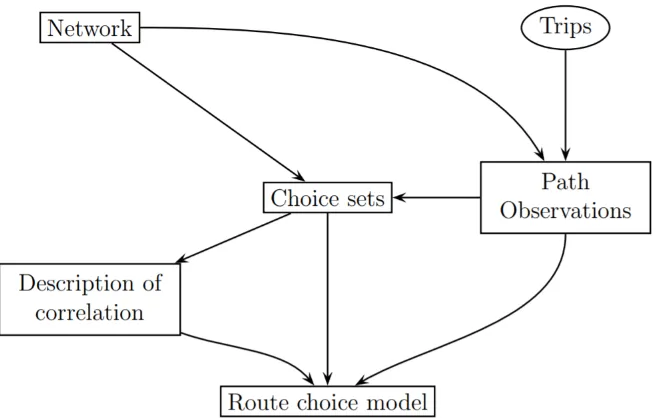
[image:22.595.150.478.185.394.2]The process from GPS points to routes via a model, further called the expected routes, is probably best explained by Frejinger (2008). A visual description of this process can be seen in Figure 3.3.
Figure 3.3: Visual overview of the route choice comparing (Frejinger 2008)
Starting with the GPS points and the cycling network of S˜ao Paulo, different paths can be made between the points. For this research only the first and last captured points of a trip will be used for the processing of the expected route.
These points have been implemented in a dense and complete biking network layer of S˜ao Paulo, which is available within the GeoLab of the University of S˜ao Paulo. A full overview of this network which is used in the data processing can be seen in Appendix C. The network has been created by the ”Centro de Estudos da Metr ´opole” (CEM), located in S˜ao Paulo.
CEM is an institution for advanced research in social sciences and investigates themes on the subject of inequalities and the formulation of public policies in contemporary metropolises (Centro de Estudos da Metr´opole 2018).
Chapter 4
Data preparation
This chapter focusses on the processing of the raw data points. What points can be excluded from the processing, based on a number of rules that are applied the GPS points. What is the quality of the data captured by the app and what can already be concluded from this data.
4.1 GPS point cleaning
Not all GPS points will be useful to use within the data processing. Table 4.1 shows the amount of points that have been excluded from the data, as well as the reason for the exclusion. Points can be excluded twice for different reasons, causing the total amount of excluded points to not match the sum of the different excluded points. Underneath the table more information about the rules is given.
Table 4.1: Points after data cleaning
Description of rule Amount of points Percentage Points in raw data 16912 100% Points not in S˜ao Paulo 1242 7,3% Points not assigned to a trip 3030 17,9% Points with accuracy less than 20m 1442 8,5% Points within trip with speed higher than 50 km/h 2504 14,8% Points useful for data processing 10478 62,0%
Points not in S˜ao Paulo: All points that do not intersect with the shapefile of the munici-pality of S˜ao Paulo have been excluded from the database. Trips that start within, but end outside the municipality boundaries, are therefore used within the data processing until the trip leaves the city borders.
points to a trip, since it judges the point to be wrongly captured. Or the algorithm does not capture a whole trip, however the reason for this could not be found.
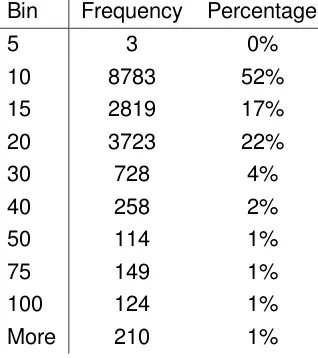
[image:24.595.231.390.225.404.2]Points with accuracy less than 20 meter: After looking at the histogram of the accuracy of the points, which can be seen in Table 4.2, it can be concluded that when taking a boundary of 20 meter accuracy the sample will still include 90% of the total points.
Table 4.2: Histogram of accuracy points
Bin Frequency Percentage
5 3 0%
10 8783 52% 15 2819 17% 20 3723 22% 30 728 4% 40 258 2% 50 114 1% 75 149 1% 100 124 1% More 210 1%
4.2 Raw data quality
Within this section, more information about the excluded points will be given. Differences in place, time, conditions will be searched for, as well as differences between the users.
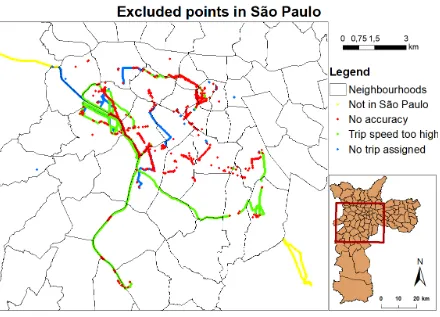
[image:25.595.90.530.234.551.2]Excluded points per place: Different points have different reasons to be excluded. Figure 4.1 shows the places of these points. As seen in the figure most of the excluded points be-cause of the high speed are on two roads, which represent major roads in S˜ao Paulo. Also no specific places in the city could be found that have clusters of points with low accuracy.
Figure 4.1: Places of excluded points of trips
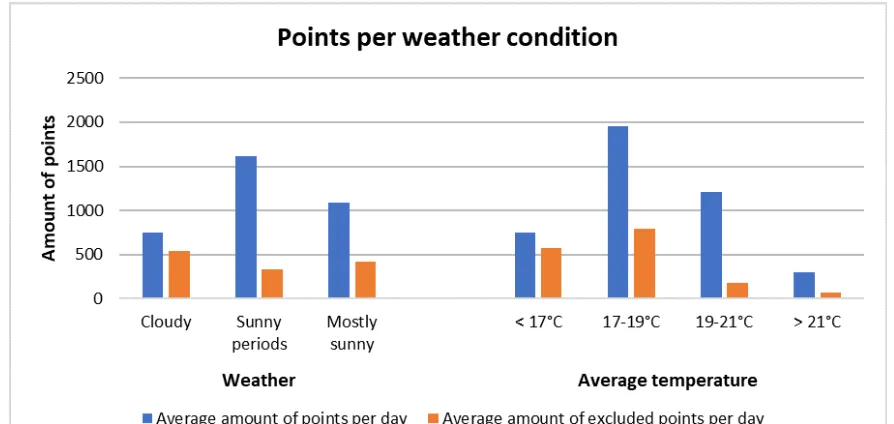
Figure 4.2: Amount of excluded points per weather condition or temperature
Excluded points per user: From the 26 people that installed the app, only nine people actually collected points with their device. As seen in Figure 4.3, three of these nine users did not collect enough points to compose trips, leaving only six people with useful trips to be used. No link can be made between the amount of points collected and the percentage of useful points.
Figure 4.3: Amount of points per user
[image:26.595.89.532.453.673.2]this figure is that points collected on Friday or Sunday will most likely be excluded from the database. The reasons of this exclusions can be seen in Figure 4.5, which shows that on Sunday most of the points have been excluded because of non-cycling trips while on Friday a mix of reasons causes the points to be excluded.
Figure 4.4: Amount of captured and excluded points per day
[image:27.595.90.530.447.721.2]Excluded points per hour: Figure 4.6 illustrates the amount of collected and excluded points per hour of the day. As seen in this figure the most amount of points have been collected between 10h and 12h in the morning, as well as between 18h and 21h. It can also be concluded that the least amount of points have been excluded in the early morning, as well as on hours where many points have been collected.
Figure 4.6: Amount of excluded points per hour of the day
Captured altitude: The footprints app collects an altitude via the mobile device of the vol-unteer. To get more information about the quality of the data, the captured altitude has been compared with the altitude of the elevation map of S˜ao Paulo (Trimble Data 2015), which is being assumed to be correct. As seen in Figure 4.7 the two altitudes do differ. Collected altitudes are on average almost ten meters lower than the ones considered as correct.
[image:28.595.92.534.511.738.2]Captured speed: The Footprints app collects a speed between two collected points. To get more information about the quality of this data, the actual speed has been calculated by finding the distance between two points using the longitude and latitude coordinates, divided by the difference in capture time of the GPS points. Figure 4.8 shows the difference between the collected and the calculated speed, showing again that the collected speed is lower than the calculated one. In the figure it can be seen that all high speed points have been excluded from the data processing. Also a large amount of collected points with a speed of zero km/h can be seen, showing the inconsistency of the speed collecting device.
Chapter 5
Results
[image:30.595.102.521.427.721.2]During the data collection, a total of 26 volunteers have installed the app on their device. However only 9 volunteers made trips that could be used within this research. A total of 59 trips could be used within this thesis, which can be seen in Figure 5.1. Almost none of the volunteers made use of the annotation environment which was made available on the internet, therefore this data is not used. Because the survey has only been filled in by 6 of the 26 volunteers, results of the survey have not been included in this section. At first the general characteristics of the trips have been composed, secondly the speeds will be discussed and at last the route choice of the cyclists will be evaluated.
5.1 General characteristics
Within this section the cyclists’ trips have been evaluated. Days and weather condition of the captured trips, amount of data per user and time of trip start have been distinguished.
Figure 5.2 shows the amount of users and trips per day or kind of day. As seen in this figure most trips are being made on days early in the week, while less trips are being made on Fridays and on weekend days. Especially Sunday is a day with almost no captured trips. A conclusion for this could be that most of the trips have a commuting purpose. On average the amount of users per day is more or less the same, except for Sundays. Thus the high amount of trips on certain days is being caused by only a few cyclists that make different trips.
[image:31.595.99.520.359.617.2]In Figure 5.3 the amount of trips per weather condition can be found. This figure shows that most of the trips are being made on days with mediocre weather conditions, days that are mostly sunny and have average temperatures between 17◦C and 21◦C.
Figure 5.3: Amount of average trips per weather condition
The amount of starting trips per hour can be found in Figure 5.4. This figure shows that most of the trips are being started during daytime, as well as an avoidance of the morning rush hours. Cyclists start a lot of trips around six o’clock in the afternoon, probably because this is close to sunset and close to ending times of workdays as well.
[image:32.595.100.524.463.718.2]5.2 Cycling speeds
The data from the collected GPS points has been used to determine the speeds on the network. With the longitude and latitude coordinates, the distance between points has been found. Also the duration between two point collections resulted in the time spent. Both the distance and time have been used to compose the speeds for every road section of the network. Figure 5.5 shows the different average speeds of the road sections in S˜ao Paulo. As seen in this figure, there is a large difference between the different routes in S˜ao Paulo. Especially in the city centre, presented by the north-eastern trips, the average speed on road section is low. Parts in the south-western area of the research area show higher speeds. Table 5.1 shows the spreading of the speeds, which presents that 75% of the road sections have a speed between 10 and 30 km/h.
Table 5.1: Speeds on road section in So Paulo
[image:33.595.99.517.391.724.2]Speed Amount of road sections Percentage Between 0 and 10 km/h 1461 14,1 Between 10 and 15 km/h 2050 19,8 Between 15 and 20 km/h 2645 25,5 Between 20 and 30 km/h 3315 32,0 More than 30 km/h 904 8,8
Speeds on slopes
Now that average speeds on road sections are found, the different speeds on distinct char-acteristics can be evaluated. Since the slope of the road section will most likely have a large impact on the speed, the relation between these two characteristics has been examined. Figure 5.6 shows the relationship between the speeds and the different slopes between -20 and 20 percent.
[image:34.595.107.521.444.718.2]This figure shows that speed will decrease as the slope uphill increases. The fact that speeds decrease when cycling uphill on a larger slope can be explained rationally. After all, an increase of slope will require more effort from the cyclist. Largest speeds are being obtained on slopes downhill varying from 2 to 6%, while higher slopes downhill will cause a decrease in speed. This can be caused by the cyclists feeling the urge to break more if the slope is increasing, causing the cyclists to have a lower speed. Another hypothesis can be that higher speeds on nearly flat surfaces are not being obtained on these roads because of the slope but because of the type of infrastructure. The main cycling infrastructures have been created mostly on flat to nearly flat surfaces and can benefit from a better traffic flow, more green-time on junctions and a higher road capacity, which will cause an increase in cycling speed.
5.3 Route choice
Within the theoretical framework a lot of different characteristics that influence route choice have been found. In this section four of these characteristics will be evaluated for the trips in S˜ao Paulo: Total distance, use of the different cycling facilities, slope of the route and land use along the road. Where possible, a 95% confidence interval has been calculated and added to the figures.
Distance
[image:35.595.101.520.374.592.2]As mentioned earlier the characteristic of the route that has the most impact on the chosen route is the distance. Using either all the captured GPS points or only the starting and ending point of a trip the different routes have been composed. Figure 5.7 shows the difference between the average length of the collected and the expected route. As seen, the average length of the collected trips is nearly 15% higher than the expected trip. Thus people are likely increasing their travelled distance in order for them to have other benefits on their route. Another possible explanation is the fact that many cyclists in S˜ao Paulo use the bike for leisure or exercising trips.
Cycling facilities
[image:36.595.102.521.225.441.2]The overlap between both the routes and the cycling facilities has been measured to calcu-late the differences between the collected and the expected route. The average numbers for the routes on the cycling facilities can be found in Figure 5.8. App users make on average less use of ciclovias and ciclofaixas on their routes, however the amount of distance on a ciclovia differs more. Figure 5.9 shows the difference between the distances on cycling fa-cilities per route.
Figure 5.8: Differences between average percentage of distance on cycling infrastructure
[image:36.595.104.520.486.724.2]Slope
[image:37.595.100.518.293.526.2]Large slopes will require a lot more effort from the cyclists. Cyclists may be avoiding these slopes by composing their routes via other areas. Figure 5.10 displays the difference of slopes between the collected and expected routes of the cyclists. This figure indicates that there is a large difference between the collected and expected routes, with expected routes being on average less hilly. Thus cyclists in S˜ao Paulo possibly do not take steepness into account as much as the model expected. These indifferences might also be caused by difference between the slope calculations of the two different routes. Slopes of collected routes have been composed using the altitude of the GPS points. Expected routes did not include the GPS points and therefore the elevation raster map of S˜ao Paulo has been used to determine slopes on these routes. As stated in Section 4.2 there are differences in elevations between these two methods which may cause this variation.
Figure 5.10: Difference between average amount of slopes on routes
Land use
Figure 5.11: Land use along the collected and expected routes
Table 5.2: Percentages for land use along routes
Group Land use Collected route Expected route S˜ao Paulo average No information No information
Other 1,2 1,6 8,5 Residential Residential high-rise
Residential low-rise 46,9 45,2 57,0 Commercial Shops
Services 12,6 12,7 6,5
Industrial
Industrial buildings Garages Vacant land
2,4 2,4 4,3
Public Schools
Public spaces 11,4 10,0 5,6 Mixed Mixed
[image:38.595.93.570.486.720.2]Chapter 6
Conclusion
With the use of 26 volunteers, trips within S˜ao Paulo have been collected. Only 6 of this vol-unteers made useful trips, with a total of 59 trips being useful within this research. Almost all users who signed up to participate in the data collection did not make use of the annotation environment on an external website and only used the app instead. Also the survey has not been filled in by every user. With only 6 out of 26 volunteers responding, a total response rate of 23%, data from the survey could not be used in this research.
Nearly over 60% of all GPS points could be used to calculate the cyclists’ routes, with most of the excluded points being in a car trip or not being assigned to a trip by the app algorithm. Most of the points and trips are being captured on days with sunny periods with intermediate temperatures, while on cold cloudy days most points were excluded from the data process-ing. Most points are being collected on weekdays, while most points are being excluded on Fridays and Sundays. Most trips are being made on Mondays to Thursdays. Cyclists pre-fer to start their trips during daytime, mostly between 10 and 14 or close to sunrise or sunset.
Chapter 7
Discussion
Within this chapter the different opportunities for improvement have been explained, as well as the options for further research as an answer on this document.
Capture areas: Almost all trips that have been generated within this research are within the south western area of the centre of S˜ao Paulo. Within this area a high-level of cycling can be achieved, since there are a lot of cycling facilities, This can also be seen in Figure 7.1, which shows the percentage of total cycling infrastructure per neighbourhood. In order to guarantee that the results are representative for the whole city of S˜ao Paulo, more cyclists are needed and also the dispersion of the cycling trips should be larger.
[image:40.595.110.518.438.720.2]Data collection: With the use of the app, detailed routes of the users could be found. How-ever the annotation environment within the app has barely been used during this research. Since the app is using two different ways to collect the data, both from the app itself and from the annotation environment in a web browser, the user needs to invest a lot of time in order to take part in the research. Besides taking part in the data collection is entirely voluntary, the volunteers need to be given the least amount of nuisance. For future research it would therefore be useful to merge both environments into one. This could be done by implementing a feedback phase within the app, which asks people to annotate the trips they just made. Another important aspect for future research would be the collection of possi-ble volunteers. Within this research success rate was very high when approaching people personally, whereas online approach of volunteers turned out to be disappointing. No expla-nation for this could be found, which makes it interesting for future studies.
Identifying car and bicycle trips: Because the GPS tracker of this research was within the smartphone of the users, all of the trips from the users were captured. Thus a mixture of all transport modes could have been present in the data processing, with only obvious car trips with speeds higher than 50 km/h to be filtered out. Being able to filter out only the cycling trips would highly benefit the validity of the research. Sch¨ussler & Axhausen (2015) comes up with numbers to automatically distinguish the different transport modes with the use of the GPS points. With this numbers the differences in transport mode can be found, making it easier to process the data. No acceleration could be found with the existing data. However future data collection could captured and include this data to deal with this issue.
Table 7.1: Automatic cycling trips detection, adapted from Sch ¨ussler & Axhausen (2015)
Median Speed 95 Percentile Acceleration 95 Percentile Speed Option 1 0-2 m/s 0.5-1.2 m/s2
-Option 2 0-2 m/s More than 1 m/s2
-Option 3 1.5-6 m/s Less than 0.6 m/s2 0-8 m/s
Bibliography
Andrade, M. F., Kumar, P., de Freitas, E. D., Ynoue, R. Y., Martins, J., Martins, L. D., Nogueira, T., Perez-Martinez, P., de Miranda, R. M., Albuquerque, T., Gonc¸alves, F. L. T., Oyama, B. & Zhang, Y. (2017), ‘Air quality in the megacity of S˜ao Paulo: Evolution over the last 30 years and future perspectives’,Atmospheric Environment159, 66–82.
Ben-Akiva, M. & Bierlaire, M. (1999),Discrete choice methods and their applications to short term travel decisions, Vol. 23, Springer, Boston Massachusetts.
Bernardi, S., Puello, L. L. P. & Geurs, K. (2017), ‘Evaluation of dutch cycling patterns: Evi-dence from smartphone data’,Journal of Transport and Land Use. Conference version.
Bernardi, S. & Rupi, F. (2015), ‘An analysis of bicycle travel speed and disturbances on off-street and on-street facilities’,Transportation Research Procedia5, 82–94.
Bikeplus (2017), ‘Public bike share users survey results 2017’.
Brezina, T., Ibesisch, N., Niegl, M. & Lemmerer, H. (2012), ‘Requirements for high quality cycling infrastructure design’, International Conference on Road and Rail Infrastructure.
Conference version.
Broach, J., Dill, J. & Gliebe, J. (2012), ‘Where do cyclists ride? A route choice model devel-oped with revealed preference GPS data’,Transportation Research Part A46, 1730–1740.
Buehler, R. & Dill, J. (2016), ‘Bikeway networks: A review of effects on cycling’, Transporta-tion Reviews36, 9–27.
Centro de Estudos da Metr´opole (2018), ‘Cycling infrastructure road network’,http://web. fflch.usp.br/centrodametropole/en/.
Chandra, S., Jimenez, J. & Radhakrishnan, R. (2017), ‘Accessibility evaluations for night-time walking and bicycling for low income shift workers’,Journal of Transport Geography 64, 97–108.
de Hartog, J. J., Boogaard, H., Nijland, H. & Hoek, G. (2010), ‘Do the health benefits of cycling outweigh the risks?’,Environmental Health Perspectives118, 1109–1116.
Fishman, E. (2016), ‘Cycling for transport’,Transport Reviews36, 1–8.
Freitas, A. L. P. & Maciel, A. B. L. (2017), ‘Cycling in a Brazilian city’,Procedia Engineering 198, 411–418.
Frejinger, E. (2008), Route Choice Analysis: Data, Models, Algorithms and Applications, PhD thesis, ´Ecole Polytechnique F´ed´erale de Lausanne.
GeoSampa (2018), ‘Mapa digital da cidade de S˜ao Paulo’,http://geosampa.prefeitura. sp.gov.br/PaginasPublicas/_SBC.aspx#.
Heinen, E., van Wee, B. & Maat, K. (2010), ‘Commuting by bicycle: An overview of the literature’,Transport Reviews30, 59–96.
Hood, J., Sall, E. & Charlton, B. (2011), ‘A GPS-based bicycle route choice model for San Francisco, California’,The International Journal of Transportation Research3, 63–75.
Kuiper, D. & Braakman, B. (2009),Five main requirements for cycling-inclusive infrastruc-ture. In Interface for Cycling Expertise, Cycling Inclusive Policy Development: A Hand-book.
Lemas, L. L. & Neto, H. W. (2014), ‘Cycling infrastruture in S˜ao Paulo: Impacts of a leisure-oriented model’,12th Annual Conference of the International Association for the History of Transport, Traffic and Mobility.
Lowry, M. B., Callister, D., Gresham, M. & Moore, B. (2013), ‘Using bicycle level of service to sssess community-wide bikeability’, Trasnportation Research Record: Journal of the Transportation Research Board2314, 41–48.
MEILI Devs (2018), ‘Pedaladas Beta GPS tracking app’.
URL:https://play.google.com/store/apps/details?id=com.airmee.footprints.staging
Menghini, G., Carrasco, N., Schssler, N. & Axhausen, K. (2010), ‘Route choice of cyclists in Zurich’,Transportation Research Part A44, 754–765.
Orenstein, J. (2017), ‘Qual ´e a diferenc¸a entre ciclovia, ciclofaixa e ciclorrota. e para quais situac¸˜oes elas servem’,Nexo Jornal.
Pritchard, J. P. (2018),Bike network S ˜ao Paulo.
Pucher, J. & Buehler, R. (2008), ‘Making cycling irresistible: Lessons from the Netherlands, Denmark and Germany’,Transport Reviews28, 495–528.
Rolnik, R. & Klintowitz, D. (2011), ‘(Im)mobility in the city of S˜ao Paulo’,Estudos Avan˜cados 25.
Sa, T. H., Duran, A. C., Tainio, M., Monteiro, C. A. & Woodcock, J. (2016), ‘Cycling in S˜ao Paulo: Correlates, time trends and health consequences’, Preventive Medicine Reports 4, 540–545.
Sch¨ussler, N. & Axhausen, K. W. (2015), ‘Processing GPS raw data without additional infor-mation’,Transportation Research Record2105, 28–36.
Sener, I. N., Eluru, N. & Bhat, C. R. (2009), ‘An analysis of bicycle route choice preferences in Texas, U.S.’,Transportation36, 511–539.
Snizek, B., Nielsen, T. A. S. & Skov-Petersen, H. (2013), ‘Mapping bicylists’ experiences in Copenhagen’,Journal of Transport Geography30, 227–233.
Stinson, M. A. & Bhat, C. R. (2004), ‘A comparison of the route preferences of experienced and inexperienced bicycle commuters’,Transportation Research Board.
Sustrans (2014), ‘Principles and processes for cycle friendly design (draft)’,Sustrans design manual.
Trimble Data (2015), ‘Elevation shapefile of S˜ao Paulo’,https://data.trimble.com/.
Watts, J. & Forner, F. (2017), ‘Resistance! S˜ao Paulo’s homeless seize the city’, The Guardian.
Winters, M., Brauer, M., Setton, E. M. & Teschke, K. (2013), ‘Mapping bikeability: a spatial tool to support sustainable travel’, Environment and Planning B: Planning and Design 40, 865–883.
Appendix A
Pedaladas app
Within this appendix a manual for the app has been written, as well as the options that can be annotated in the browser environment.
Manual
The Pedaladas Beta app can be installed on Android via the Google Play Store. After down-loading, an account needs to be made in order to be able to distinguish the different users. Login in with your own credentials will bring you to the home screen, where a switch will make you able to start collecting data (it will turn red). After turning on the data collection, keep the app running on the background and it will automatically store the GPS points every 15-20 seconds and record all your trips to the database.
At the end of every day, all the trips will be available at the annotation environment of the app. This environment can be reached throughout your web browser by going to the following link: http://footprints-staging.airmee.com.s3-website-eu-west-1.amazonaws.com/ dash. In the annotation environment the trips will be presented in chronological order,
mak-ing you able to correct any mistakes or add notes to the made trips. Options that are available within this environment can be seen in Section A.
Annotation options
Table A.1: Pedaladas options
Characteristic Options
Wrong data collection Missed stop between trips or merge with next trip Travel time Start and finishing time
Transfer time Start and finishing time
Transport mode By foot Bicycle Electric bicycle Car Train Bus Metro Other Facility rating Point on map: rating between 1 and 5 stars Destination Point on map
Problem on the road Point on map
Purpose
Return home Travel to work Travel to school
Pick-up or drop-off children Business travel
Shopping
Sport/hobby related travel Other private related travel
Feedback
Rating between 1 and 5 stars and one of the following: This route is the fastest
This route is the calmest This route is the least polluted This route has the best bike paths This route has the least amount of traffic This route is the flattest
Appendix B
Survey questions
Q1: Thank you for taking part in our research on cycling in S˜ao Paulo. This research is part of a collaboration between the University of Twente (UT) in the Netherlands, and the Polytechnic School of the University of S˜ao Paulo (USP). This questionnaire will take approx-imately 5 minutes to complete. In addition to the questionnaire, our research also makes use of an application that collects data on the way that cyclists use the bicycle in S˜ao Paulo. The installation of this application is entirely voluntary and all information obtained by it will be anonymised and kept confidential.
Q2: What is your gender?
• Male • Female
Q3: What is your age?
• Under the age of 18 • 18 - 24 years old • 25 - 34 years old • 35 - 44 years old • 45 - 54 years old • 55 - 65 years old • 65 years or older
Q4: What is your occupation?
• Student
• Employed with a formal contract • Employed without a formal contract • Unemployed
• Retired due to disability • Retired
• Other:
Q5: Do you own a bicycle yourself?
• Yes • No
Q6: Do you own another mode of transport?
• Yes, a car and a motor • Yes, only a car
• Yes, only a motor • No
Q7: How often are you using the bike as a transport mode?
• Never
• Less than 6 times a year • Between 6 and 11 times a year • Around three times a month • One, two or three times a week • Four or more times a week
Q8: How much experience do you have with cycling in S˜ao Paulo?
• I started cycling less than a month ago
• I started cycling between one and two years ago • I started cycling between two and five years ago • I started cycling more than five years ago
Q9What is your main purpose when cycling?
• Work • Study • Shopping • Exercising • Leisure • Other:
Q10: What is the e-mail address that you used in the Footprints App?
Q11: What is the importance of the following factors when choosing your route? Not
important
A bit
important Important
Very important
The most important Existence of cycling path ◦ ◦ ◦ ◦ ◦
Existence of cycling lanes ◦ ◦ ◦ ◦ ◦
Well paved streets ◦ ◦ ◦ ◦ ◦
Streets without steep slopes ◦ ◦ ◦ ◦ ◦
Streets without signal
controlled intersections ◦ ◦ ◦ ◦ ◦ Streets without
motorised traffic ◦ ◦ ◦ ◦ ◦ Streets without
Q12: What is the importance of the following factors when choosing your route? Not
important
A bit
important Important
Very important
The most important The route is the fastest ◦ ◦ ◦ ◦ ◦
The route has
the least amount of slopes ◦ ◦ ◦ ◦ ◦ This route is
the most attractive ◦ ◦ ◦ ◦ ◦ This route provides
the most security ◦ ◦ ◦ ◦ ◦ This route provides