Individual versus collaborative concept mapping in a simulation-based
inquiry learning environment
Britt Meenderink
Master Educational Science and Technology University of Twente, Enschede
2
Table of contents
Abstract ... 3
Introduction and theoretical framework ... 4
Concept mapping ... 5
Collaborative processes ... 5
Collaborative concept mapping ... 7
Research questions and hypotheses ... 8
Research design ... 9
Research methods ... 10
Participants ... 10
Instrumentation ... 10
Procedure ... 13
Analyses ... 14
Results ... 16
Prior knowledge of the participants ... 17
Test results ... 18
Time spent on each part of the research session ... 19
Concept maps ... 21
Communication of collaborating pairs ... 23
Conclusion and discussion ... 26
References ... 29
3
Abstract
Research about collaborative learning versus individual learning, concept mapping and simulation-based inquiry was mostly done with two of these topics, but not often with all these topics together. Also, such research was done with students of middle school and high school, and not yetwith university students.
The goal of this research is to study the effect of collaboration on university students’ learning outcomes and construction of a concept map after engaging in a simulation-based inquiry learning environment. This was investigated with a collaborative condition with 22 dyads of 44 participants and an individual condition with 23 participants.
Results showed that the number of correct answers on multiple knowledge tests and the concept map scores were not significantly higher in the collaborative condition than in the individual condition. Thus, no significant differences were found between the collaborative condition and the individual condition. However, the pairs in the collaborative condition spent significantly more time on the first part of the learning environment and the concept mapping than the participants in the individual condition. Possible reasons might include the difficult topic of the learning environment and the short preparation time. Furthermore, the pairs did not use collaboration to its full potential and might need some support.
More research should be done about collaborative concept mapping in an inquiry learning environment with students of several other universities in different countries and with learning environments about other topics. The outcomes of such studies might be useful for universities that apply collaboration as a learning strategy for their courses and want to optimize the quality of such courses and their students’ learning.
Samenvatting
Onderzoek naar samenwerkend leren versus individueel leren, concept mapping en onderzoekend leren met simulaties werd meestal gedaan over twee van deze onderwerpen, maar nog niet vaak over al deze onderwerpen samen. Daarnaast werden zulke onderzoeken meestal uitgevoerd met leerlingen van de middelbare school, en nog niet met universitaire studenten. Het doel van dit onderzoek is om erachter te komen wat het effect is van samenwerken op de leerresultaten van studenten en hun zelfgemaakte concept maps, nadat ze gewerkt hebben met een leeromgeving. Dit is onderzocht met een samenwerkende conditie met 22 tweetallen van 44 participanten en individuele conditie met 23 participanten.
4 Er moet meer onderzoek worden gedaan naar het samenwerken aan een concept map in een onderzoekende leeromgeving met studenten van meerdere andere universiteiten uit verschillende landen en met leeromgevingen over andere onderwerpen. De uitkomsten van zulke onderzoeken kunnen bruikbaar zijn voor universiteiten die samenwerken toepassen als leerstrategie in hun vakken of cursussen en die resultaten daarvan en van de studenten willen optimaliseren.
Introduction and theoretical framework1
The skills of working independently and working collaboratively were identified as very important for students’ future jobs and lives. To be able to work independently, it is important to focus on a task, to plan and monitor it for yourself, to realize purposeful behaviour, to make choices, to solve a problem individually, and to take responsibility for your own actions. To collaborate well with others, you have to be able to work together to achieve a common goal, to explain your opinion, to listen to each other, to discuss and communicate in a clear and effective manner, to support and complement others, to make decisions together, and to share responsibility (Thijs, Fisser, & van der Hoeven, 2014).
In comparison with individual learning, collaborative learning has an added value because of the group members’ contributions, which can provide new ideas and point of views, extra information, and feedback on how to correct errors. Besides, collaboration makes it possible for group members to develop a shared understanding and, potentially also for each individual, a deeper or more innovative understanding the group members did not thought of themselves (Chi, 2009). Collaboration also stimulates students to verbalize their ideas and to make their thoughts explicit (van Boxtel, van der Linden, Roelofs, & Erkens, 2002). In addition, several studies have found that collaboration can enhance learning and understanding (e.g., Nussbaum, 2008; van Boxtel, 2004). In short, collaboration stimulates several processes that have the potential to promote the construction of knowledge.
One of the learning activities being used to enhance collaboration is concept mapping (Kinchin & Hay, 2005). A concept map reflects the important concepts within a specific knowledge domain and the interrelationships between those concepts (Novak & Gowin, 1984). In that way, it provides a visual representation of the knowledge structure a student possesses (Kinchin & Hay, 2005). Collaborative concept mapping gives students the possibility to talk about concepts and use them to describe and explain a topic. Therefore, a concept map can be useful as a tool to stimulate meaningful student interaction and to contribute to concept learning (van Boxtel et al., 2002).
In this study, individual and collaborative concept mapping will be investigated with participants in a simulation-based inquiry learning environment. Inquiry learning is “an approach to learning that involves a process of exploring the natural or material world, and that leads to asking questions, making discoveries, and rigorously testing those discoveries in the search for new understanding” (National Science Foundation [NSF], 2000, p. 1). In several simulation-based inquiry learning environments, a concept mapping tool can be incorporated
5 (de Jong, 2006). Research indicates that learning environments where students carry out their own investigations and/or create visualizations are suited for collaboration (e.g., van Joolingen, de Jong, Lazonder, Savelsbergh, & Manlove, 2005; de Jong, 2007; van Joolingen, de Jong, & Dimitrakopoulou, 2007).
Concept mapping
In an inquiry learning environment, concept mapping can help students to represent and visualize a topic in a schematic way. According to Novak and Gowin (1984), a concept map is “intended to represent meaningful relationships between concepts in the form of propositions. Propositions are two or more concept labels linked by words in a semantic unit” (p. 15). In other words, a concept map is “a schematic device for representing a set of concept meanings embedded in a framework of propositions” (Novak & Gowin, 1984, p. 15).
Constructing a concept map helps students to see the meanings of a concept (Novak & Gowin, 1984). The meaning of a concept includes all the propositional connections that could be made for that concept in all contexts the student knows (Novak, 1990; Novak & Musonda, 1991). Concept maps are a way to express concepts and their relations in a visual representation (Novak & Gowin, 1984). They show the key concepts that have to be learned and the pathways to organize concept meanings (Novak & Gowin, 1984). Concept maps reveal the cognitive structure of students about a specific knowledge domain. Therefore, it is helpful to use a concept map for students to reflect on their prior knowledge about the topic (Kinchin & Hay, 2005). Besides, teachers can use concept maps to identify students’ misconceptions and to negotiate meanings with students (Novak & Gowin, 1984). Therefore, concept maps can be used in an inquiry learning environment in, for example, the orientation phase to find out the prior knowledge about the subject domain or the conclusion phase to make a summary of the topic. In this study, the students will construct a concept map after they worked on an inquiry learning environment. Making a concept map can be helpful for the students to visualize the knowledge domain including the relations between concepts.
Collaborative processes
Students can work on a learning environment alone or together in dyads. When students work together, they can talk about the task they are working on. Different researchers tried to categorise forms of talk that contribute to successful collaboration. These categorisations contain different terms for good communication. Examples of such terms are: transactive discussion, communicative functions of collaborative talk, exploratory talk, joint dialogues,and social modes of co-construction. These terms can complement each other and might sometimes overlap. Below, these terms will be explained in relation to productive communication and non-productive communication.
6 (Berkowitz, 1980). Dyads who had a transactive discussion showed better learning results than dyads who had a non-transactive discussion (Teasley, 1997).
Van Boxtel (2000) and Erkens & Janssen (2008) distinguish five main communicative functions of collaborative talk, defined as the communicative intentions expressed by students who are collaborating on a task. These communicative functions are: (1) argumentative (indicating argumentation or reasoning) or evaluative (a judgment or personal opinion), (2) responsive (giving a response or reaction to an utterance, e.g., a confirmation, denial, acceptance, or repetition), (3) elicitative (questions, requests or proposals to stimulate the partner to give an answer), (4) informative (expressing information), and (5) imperative (commanding the partner to act).
Other researchers are studying ground rules for good collaboration. According to Mercer (1996), the best way for students to discuss with each other during collaboration, is by means of exploratory talk: students talk with each other about their ideas in a constructive and critical way. There are different ground rules for exploratory talk. Information and thoughts are shared and discussed, but can also be challenged and counterchallenged by offering alternatives and giving justifications. Decisions are made together and reasoning is visible during the conversation. Less effective ways of communicating are disagreeing with each other, acting like competitors, making decisions alone instead of together, and not or barely giving constructive criticism.
In addition, Chi (2009) names joint dialogues in which all group members contribute substantively to the conversation, talking about the topic or a concept. Examples of such contributions are: “building on each other’s contribution, defending and arguing a position, challenging and criticizing each other on the same concept or point, asking and answering each other’s questions” (Chi, 2009, p. 83). These examples are largely similar to some of the communicative functions (van Boxtel, 2000; Erkens & Janssen, 2008) and the ground rules mentioned by Mercer (1996).
More specifically, Fischer et al. (2002) mention collaborative knowledge construction processes, which Weinberger and Fischer (2006) call social modes of co-construction, based on to what extent students refer to their partner’s contributions. These processes or modes are: externalization, elicitation, quick consensus building, integration-oriented consensus building, and conflict-oriented consensus building. Externalization and elicitation are largely similar to the informative and elicitative functions of collaborative talk of van Boxtel (2000) and Erkens and Janssen (2008) mentioned before. Quick consensus building is when the partner’s contributions are accepted to be able to go on with the task. Integration-oriented consensus building is when a student takes over and builds upon the partner’s contributions. Lastly, conflict-oriented consensus building is when a student critiques or adjust the partner’s contributions (Fischer et al., 2002; Weinberger & Fischer, 2006).
7 contributions are barely initiated or each other’s non-substantive contributions are ignored. Therefore, individual dialogues are not interactive (Chi, 2009).
In short, there are different characteristics of good collaboration: contributions of all group members, sharing information, explaining point of views, giving reasons and arguments (Mercer, 1996; van Boxtel, 2000; Erkens & Janssen, 2008; Fischer et al., 2002; Weinberger & Fischer, 2006), building on other’s contributions (Mercer, 1996; Fischer et al., 2002; Weinberger & Fischer, 2006; Chi, 2009), asking and answering each other’s questions (Mercer, 1996; van Boxtel, 2000; Erkens & Janssen, 2008; Chi, 2009), giving constructive criticism (Mercer, 1996; Weinberger & Fischer, 2006; Chi, 2009), shared responsibility, reaching agreement, and joint decision-making (Mercer, 1996).
Collaborative concept mapping
Collaboration can be combined with different learning activities. One of the activities being used to enhance collaborative learning is concept mapping (Kinchin & Hay, 2005). A concept map can be useful to stimulate interaction between students or group members. When students construct a concept map together, students need to explore a particular knowledge domain. They have to talk about the topic in their own words and verbalize and exchange their ideas (Novak, 1995). Also, the other way around, collaboration between students may add an additional value to concept mapping and concept learning, because collaborative concept mapping enables the students to discuss the concepts with each other and to apply the concepts in describing and explaining a topic (van Boxtel et al., 2002). There are several characteristics of peer interaction that promote concept learning: talking about the concepts and their relations, the contribution and elaboration from group members, co-construction for shared meaning-making, and using the available tools in a productive way (van Boxtel, 2004; van Boxtel et al., 2002). Thus, it might be valuable to combine concept maps and collaborative learning into collaborative concept mapping to stimulate the collaboration between students and enhance the knowledge construction process.
It is important that the collaborating students have a feeling of ownership of and responsibility for both the process and the product of collaborative concept mapping. To this end, all group members have to go through the concept mapping process together to be able to deliver a jointly constructed concept map (Mattessich & Monsey, 1992). Therefore, students have to participate actively and meaningfully to be able to learn from collaborative concept mapping. How the students mentally interact with the subject matter to be learned during the concept mapping process is crucial to the students’ achievements (Cañas et al., 2003).
8 and Cifuentes (2009), middle school students who applied collaborative concept mapping created concept maps of higher quality than students who created concept maps individually.
In short, research showed positive results for collaboration and concept mapping as well as the combination of collaborative concept mapping. Research has combined collaboration with concept mapping and inquiry learning to study collaborative concept mapping in an simulation-based inquiry learning context. For example, Gijlers and de Jong (2013) concluded that collaborative concept mapping had a positive effect on high school students’ chat dialogues and their outcomes on knowledge tests in an inquiry learning environment.
However, such studies focused on high school students and did not compare individual learning and collaborative learning. In this study, pairs of two university students work together on a simulation-based inquiry learning environment, complete every phase with each other by discussing it and making joint decisions, and in the meantime try to learn about a specific science-related topic. Other university students work alone on the learning environment. The purpose for this study is to investigate whether collaboration would also get positive results among university students in the context of a simulation-based inquiry learning environment with concept mapping. This is compared with a collaborative learning condition and an individual learning condition.
Research questions and hypotheses
The research question for this study is: What is the effect of collaboration on university students’ learning outcomes and construction of a concept map after engaging in a simulation-based inquiry learning environment? In addition, several sub questions are formulated. The following sub questions apply to both the collaborative condition and the individual condition: 1. What are the participants’ test scores on the pre-test, intermediate test, and final test? 2. Are there differences between the collaborative condition and the individual condition with
respect to the knowledge outcomes based on the test scores? And to what extent?
3. What do the concept maps look like, and how are the participants’ scores on the concept maps?
4. Are there differences between the collaborative condition and the individual condition with respect to the quality of the concept maps? And to what extent?
From here, the sub questions are only for the collaborative condition:
1. What types of collaboration occur between the pairs in the collaborative condition during the research sessions?
2. Based on the frequency and the quality of their communication, are there differences in the conversations between the collaborating pairs? And to what extent?
9 the learning environment, for both the individual condition and the collaborative condition, so it is expected that the students in the collaborative condition will score better on the intermediate test and the final test than the students in the individual conditionand show more progress from the pre-test to the intermediate test and the final test.
Another expectation is that collaborating students will construct concept maps of higher quality, because group members can both contribute to the concept map and thereby help each other by coming up with new ideas and correcting errors (e.g., Chi, 2009). Besides, research indicates that the concepts maps of collaborating students were better in quality than those of individual students (e.g., Kwon and Cifuentes, 2009). Also, by making the concept map, the students are forming an overview of the subject domain and thereby they should learn about the topic (e.g., van Boxtel et al., 2002). Therefore, it is expected that for both conditions, because of working on the learning environment and making the concept map, the scores on the final test will be higher than the scores on the pre-test and intermediate test.
In short, it is hypothesized that the students in the collaborative condition will perform better on the concept map, the intermediate test and the final test than the students in the individual condition.
In addition, it is expected that collaborating students who have communication of higher quality will perform better overall. For example, students will perform better if they correct each other when they think that something is wrong and they give constructive criticism (e.g., Mercer, 1996; Weinberger & Fischer, 2006; Chi, 2009). Also, it is important that the students communicate enough in terms of frequency and show approximately equal contributions in order to be able to benefit from each other.
The hypotheses are as follows: 1) the students in the collaborative condition have higher knowledge outcomes on the intermediate test and the final test than the students in the individual condition; 2) the students in both conditions will show progress in their test scores between the pre-test, the intermediate test and the final test; 3) the students in the collaborative condition make concept maps of higher quality than the students in the individual condition; 4) the collaborating pairs who collaborate better in terms of quality and frequency of their communication will perform better than the other pairs and the students in the individual condition.
Research design
10
Research methods
Participants
The participants were 67 undergraduate students from psychology or communication science. The students were recruited through the course credit system SONA and volunteered to participate in this study for course credits. In total, 45 female students and 22 male students participated, with a mean age of 20.16 years (SD = 1.87). The students were randomly assigned to either the collaborative condition or the individual condition. In the collaborative condition, 44 participants were randomly paired into 22 dyads. There were 9 female pairs, 3 male pairs and 10 pairs of male and female students. The individual condition consisted of 23 individual participants, including 17 female students and 6 male students.
Instrumentation
For this research, a simulation-based inquiry learning environment with a concept mapping tool and three knowledge tests were used.
Learning environment. Both the collaborative condition and the individual condition received the learning environment. The participants in both learning conditions worked on an inquiry learning task about factors influencing the rising and descending of different balloons (a hot air balloon, a rigid hollow sphere, and a helium balloon). For the purpose of this study, an inquiry learning space using the Graasp content manager was created, consisting of a PhET simulation about the topic ‘balloons and buoyancy’. The created learning space was segmented in the following phases: orientation, hypothesis generation, experimentation, and conclusion, followed by a concept mapping phase based on the inquiry learning processes in the previous phases. The learning space was divided into two parts, so the participants could not move on to the second part without completing all phases of the first part. Part one of the learning environment is from the orientation phase to the conclusion phase. Part two of the learning environment includes the concept mapping phase. Before working on the learning environment, the participants make a pre-test. After concluding part one of the learning environment, the participants make an intermediate test. After part two of the learning environment, the participants fill in the final test.
In the orientation phase (in part one of the learning environment), the participants could orientate themselves on the topic by watching a short video about rising a balloon without helium. Besides, they had the possibility to get acquainted with the learning environment by taking a quick look at the different phases.
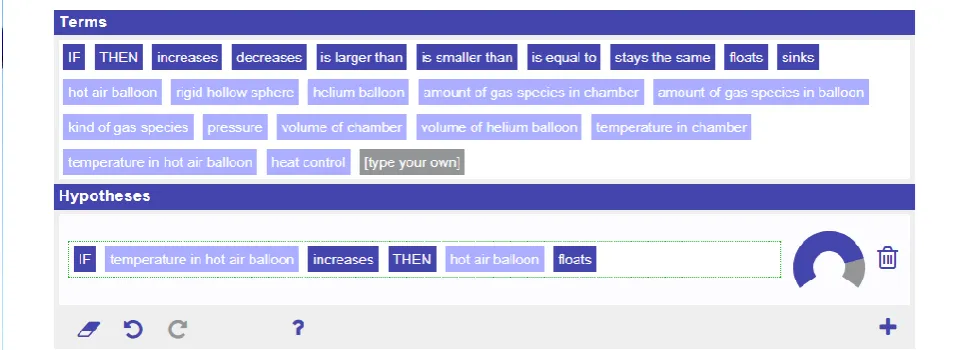
11 Figure 1
A screenshot from the hypothesis scratchpad
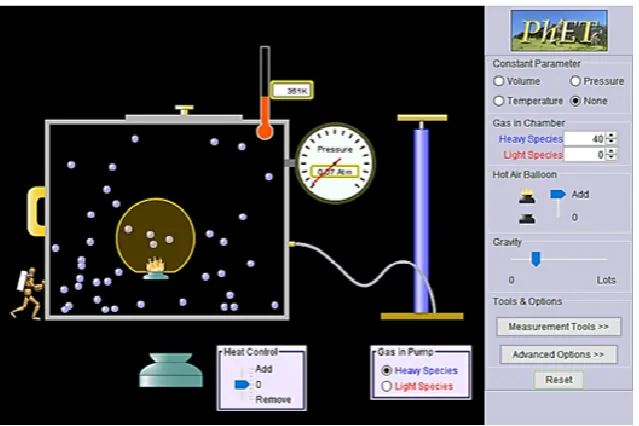
Figure 2
A screenshot from the observation tool (left) and the simulation (right)
[image:11.595.80.556.464.678.2]12 In the conclusion phase, the participants wrote down their conclusions and answered the research question. Therefore, they had the possibility to go back to the simulation and their notes. After this phase, they made the intermediate test.
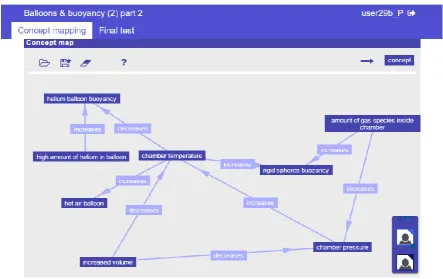
[image:12.595.71.528.369.692.2]In the concept mapping phase (in part two of the learning environment), the participants constructed a concept map about the topic. In the individual condition, they worked alone with an individual concept mapping tool, where the pairs in the collaborative condition worked together with a collaborative concept mapping tool. This tool is shown in Figure 3. Both participants of each pair needed a laptop and their usernames to log into the learning environment to enable both of them to see the concept mapping tool and contribute to it in order to construct the concept map together. The collaborative tool had a partner icon that allowed users to connect and work with each other on the concept map. Both members of the pair could add a concept or a relation to the concept map and see the changes in the concept map. The two versions of the tool have largely the same functionalities, except for the mentioned collaborative functions.
Figure 3
A screenshot from the collaborative concept mapping tool, with the beginning of a concept map and the user help under ‘?’
13 the two learning conditions. The pre-test consisted of 21 multiple choice questions about the subject domain of the learning environment, which is ‘balloons and buoyancy’. An example of a test question is shown in Figure 4. All test questions are stated in the Appendix. The goal of the pre-test was to find out the participants’ prior knowledge and learning experiences before they started working on the learning environment.
The intermediate test took place after the participants worked with the first part of the learning environment and before they constructed the concept map. The goal was to examine what the participants learned from working with the learning environment including the simulation. Therefore, the questions in the intermediate test were the same as those in the pre-test.
[image:13.595.111.431.390.603.2]The final test contains the same questions as the pre-test and intermediate test. The final test was about finding out what the participants learned after working with the learning environment and constructing the concept map.
Figure 4
Example of a test question
Procedure
14 the same experimental procedures. At the beginning of each session, the experimenter gave a short introduction of 5 to 10 minutes about the assignment. The students in the collaborative condition were told that they had to work together on the learning environment (except the tests), and some collaboration rules were stated to them. Before students interacted with the learning environment, they completed a pre-test individually to assess their prior knowledge and previous experiences with the simulated domain. Next, the experimenter gave a demonstration of the learning environment in 15 minutes. Then, the participants worked with the first part of the inquiry learning environment including the simulation; the collaborative condition worked together in pairs, the individual condition worked alone. The students had approximately 45 to 60 minutes to complete the first part of the learning environment. Individually, they made an intermediate test about their knowledge after working with the simulation. After that, they constructed a concept map about the simulated domain (the collaborative condition worked together in pairs, the individual condition worked alone), where they had the possibility to look at the simulation and conclusion again. The students had approximately 30 to 45 minutes to complete the concept mapping. The interaction with the learning environment was logged by the system. The communication of the collaborating students in the collaborative condition was recorded by means of video cameras with audio. Finally, all the students filled in a final test individually about their knowledge afterwards to assess the learning outcomes. They had 30 minutes at most to complete each of the three tests. The students had a maximum of three hours to complete the entire research session.
Analyses
The pre-tests, intermediate tests and final tests of the participants were corrected.For the score of each test, the number of correct answers out of a maximum of 21 was used (because each test comprised 21 questions). The Kolmogorov-Smirnov test was used to find out whether the data are normally distributed or not. After that, the Mann-Whitney test is used for non-normally distributed data or the Independent Samples T-test for normally distributed data to test the background variables, the results of the three tests, and the amount of time spent on each part of the research session to see whether there were differences between the collaborative condition and the individual condition. Friedman’s ANOVA was used to test whether there were differences between the three knowledge tests, with Wilcoxon signed-rank tests as post-hoc analysis.
15 The communication of the collaborating pairs was recorded with video cameras so analysis would be possible. For the analysis, the parts of the video files where the pairs made the concept map were chosen, because the concept mapping phase of the learning environment is one of the most important components of this research. These parts of the video files were analysed by listening to the videos and searching forthemes, patterns and illustrative excerpts in the communication of the pairs based on the amount of communicated utterances and on how the pairs collaborated, for example, the degree of co-construction and/or task division. After that, the Kruskal-Wallis test was used to test to what extent the knowledge test scores and concept map scores were affected by how the pairs collaborated and communicated, with Mann-Whitney tests as post-hoc analysis.
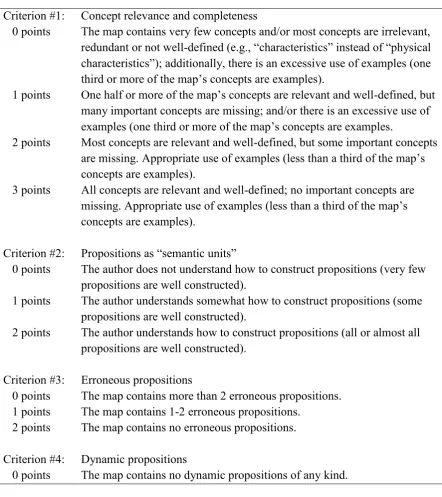
Table 1
Semantic scoring rubric for concept maps
Criterion #1: Concept relevance and completeness
0 points The map contains very few concepts and/or most concepts are irrelevant, redundant or not well-defined (e.g., “characteristics” instead of “physical characteristics”); additionally, there is an excessive use of examples (one third or more of the map’s concepts are examples).
1 points One half or more of the map’s concepts are relevant and well-defined, but many important concepts are missing; and/or there is an excessive use of examples (one third or more of the map’s concepts are examples.
2 points Most concepts are relevant and well-defined, but some important concepts are missing. Appropriate use of examples (less than a third of the map’s concepts are examples).
3 points All concepts are relevant and well-defined; no important concepts are missing. Appropriate use of examples (less than a third of the map’s concepts are examples).
Criterion #2: Propositions as “semantic units”
0 points The author does not understand how to construct propositions (very few propositions are well constructed).
1 points The author understands somewhat how to construct propositions (some propositions are well constructed).
2 points The author understands how to construct propositions (all or almost all propositions are well constructed).
Criterion #3: Erroneous propositions
0 points The map contains more than 2 erroneous propositions. 1 points The map contains 1-2 erroneous propositions.
2 points The map contains no erroneous propositions.
Criterion #4: Dynamic propositions
16 1 points The map contains only non-causative dynamic propositions.
2 points The map contains 1-2 causative dynamic propositions with physically separate links.
3 points The map contains more than 2 causative dynamic propositions with physically separate links.
4 points The map contains quantified causative dynamic propositions.
Criterion #5: Quantity and quality of cross-links
0 points The map contains cross-links, but they are all erroneous (false). 1 points The map contains no cross-links.
2 points The map contains cross-links and these establish correct (true)
relationships. However, they are redundant or not particularly relevant or adequate.
3 points The map contains 1-2 correct, relevant and adequate cross-links with physically separate links. However, based on the concepts present in the map, important and/or evident cross-links are missing.
4 points The map contains more than 2 correct, relevant and adequate cross-links with physically separate links. However, based on the concepts present in the map, important and/or evident cross-links are missing.
5 points The map contains more than 2 correct, relevant and adequate cross-links with physically separate links. Based on the concepts present in the map, no important or evident cross-links are missing.
Criterion #6: Presence of cycles
0 points The map contains no cycles.
1 points The map contains at least 1 cycle, but some propositions in the cycle do not satisfy criterion # 2.
2 points The map contains at least 1 cycle and all propositions in the cycle satisfy criterion # 2.
Adapted from “A semantic scoring rubric for concept maps: design and reliability”, by N. L. Miller and A. J. Cañas, 2008, Proceedings of the Third International Conference on Concept Mapping, pp. 66-67.
Results
17 in both learning conditions and the communication of the pairs in the collaborative condition will be explained.
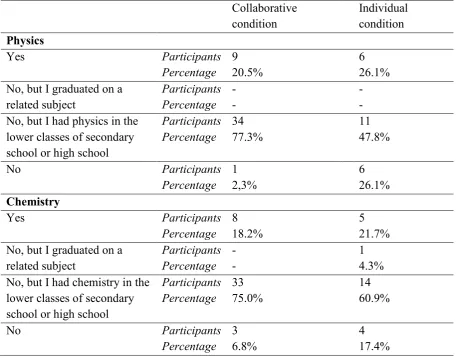
Prior knowledge of the participants
[image:17.595.70.527.263.621.2]The results of the participants’ prior knowledge of physics and chemistry are in Table 2. In both the collaborative condition and the individual condition, most participants had physics and chemistry onlyin the lower classes of secondary school or high school and did not choose either of the subjects in (the higher classes of) high school to graduate in.
Table 2
The participants’ prior knowledge results of physics and chemistry
Collaborative condition
Individual condition
Physics
Yes Participants 9 6
Percentage 20.5% 26.1%
No, but I graduated on a Participants - -
related subject Percentage - -
No, but I had physics in the lower classes of secondary
Participants Percentage
34 77.3%
11 47.8%
school or high school
No Participants 1 6
Percentage 2,3% 26.1%
Chemistry
Yes Participants 8 5
Percentage 18.2% 21.7%
No, but I graduated on a Participants - 1
related subject Percentage - 4.3%
No, but I had chemistry in the lower classes of secondary
Participants Percentage
33 75.0%
14 60.9%
school or high school
No Participants 3 4
Percentage 6.8% 17.4%
18 The participants having and graduating in chemistry (or not) in the collaborative condition is significantly different from a normal distribution, D(44) = 0.454, p < 0.001. Also in the individual condition, the participants having and graduating in chemistry (or not) is significantly different from a normal distribution, D(23) = 0.378, p < 0.001. Having and graduating in chemistry in the collaborative condition (Mdn = 3 = No, but I had it in lower classes) did not differ significantly from the individual condition (Mdn = 3 = No, but I had it in lower classes), U = 498.50, z = -0.12, p > 0.05, r = -0.02.
Also, the participants made a pre-test before they started working with the learning environment. The pre-test scores for the collaborative condition are not significantly different from a normal distribution, D(44) = 0.114, p > 0.05. Also, the pre-test scores for the individual condition are not significantly different from a normal distribution, D(23) = 0.146, p > 0.05. There was no significant difference in the number of correct answers in the pre-test between the participants in the collaborative condition (M = 10.68) and the participants in the individual condition (M = 10.65), t65 = 0.051, p > 0.05.
Test results
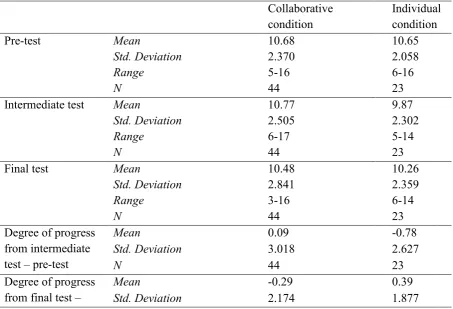
[image:18.595.72.526.453.762.2]The results of the pre-test, intermediate test, and the final test will be discussed. The descriptive results of the scores on the three knowledge tests and the degree of progress between these test scores are summarized in Table 3.
Table 3
Descriptive results of the scores on the three knowledge tests in the two learning conditions and the degree of progress between the test scores
Collaborative condition
Individual condition
Pre-test Mean 10.68 10.65
Std. Deviation 2.370 2.058
Range 5-16 6-16
N 44 23
Intermediate test Mean 10.77 9.87
Std. Deviation 2.505 2.302
Range 6-17 5-14
N 44 23
Final test Mean 10.48 10.26
Std. Deviation 2.841 2.359
Range 3-16 6-14
N 44 23
Degree of progress from intermediate test – pre-test
Mean 0.09 -0.78
Std. Deviation 3.018 2.627
N 44 23
Degree of progress from final test –
Mean -0.29 0.39
19
intermediate test N 44 23
Degree of progress from final test – pre-test
Mean -0.20 -0.39
Std. Deviation 3.196 2.856
N 44 23
As shown in Table 3, the differences in the test scores between the two learning conditions are minimal and not significant. For the intermediate test, the number of correct answers is higher in the collaborative condition (M = 10.77) than in the individual condition (M = 9.87), but this difference was not significant, t65 = 1.44, p > 0.05. Also, the progress or improvement between
the knowledge tests was (largely) absent. The number of correct answers of the participants in the collaborative condition did not significantly change over the three knowledge tests, χ2(2) =
1.09, p > 0.05. This was also found for the number of correct answers of the participants in the individual condition, χ2(2) = 0.97, p > 0.05.
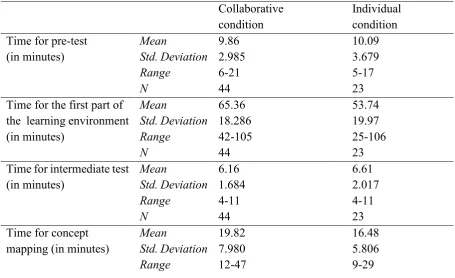
Time spent on each part of the research session
[image:19.595.70.526.487.765.2]The time the participants spent on each part of the research session was recorded. This is relevant to be able to see the differences between the time the individual participants spent alone and the time the collaborating participants spent together on the different parts of the research session. The descriptive results of these times are summarized in Table 4. After that, the results will be discussed for the time spent on the pre-test, the first part of the learning environment, the intermediate test, the concept mapping, and the final test in the collaborative condition and the individual condition.
Table 4
The time spent in minutes on each knowledge test in the two learning conditions
Collaborative condition
Individual condition
Time for pre-test Mean 9.86 10.09
(in minutes) Std. Deviation 2.985 3.679
Range 6-21 5-17
N 44 23
Time for the first part of Mean 65.36 53.74 the learning environment Std. Deviation 18.286 19.97
(in minutes) Range 42-105 25-106
N 44 23
Time for intermediate test Mean 6.16 6.61
(in minutes) Std. Deviation 1.684 2.017
Range 4-11 4-11
N 44 23
Time for concept Mean 19.82 16.48
mapping (in minutes) Std. Deviation 7.980 5.806
20
N 44 23
Final test Mean 3.89 4.96
(in minutes) Std. Deviation 0.945 1.692
Range 2-6 2-9
N 44 23
The time spent on the pre-test in the collaborative condition is significantly different from a normal distribution, D(44) = 0.188, p < 0.001. The time spent on the pre-test in the individual condition is not significantly different from a normal distribution, D(23) = 0.147, p > 0.05. The time spent on the pre-test in the collaborative condition (Mdn = 9.00 minutes) did not differ significantly from the individual condition (Mdn = 9.00 minutes), U = 501.00, z = -0.07, p > 0.05, r = -0.008.
The time spent on the first part of the learning environment in the collaborative condition is significantly different from a normal distribution, D(44) = 0.202, p < 0.001. The time spent on the first part of the learning environment in the individual condition is not significantly different from a normal distribution, D(23) = 0.123, p > 0.05. The collaborative condition (Mdn = 58.00 minutes) spent significantly more time on the (first part of the) learning environment than the individual condition (Mdn = 51.00 minutes), U = 324.00, z = 2.41, p = 0.016, r = -0.29.
The time spent on the intermediate test in the collaborative condition is significantly different from a normal distribution, D(44) = 0.174, p = 0.002. The time spent on the intermediate test in the individual condition is significantly different from a normal distribution, D(23) = 0.227, p = 0.003. The time spent on the intermediate test in the collaborative condition (Mdn = 6.00 minutes) did not differ significantly from the individual condition (Mdn = 6.00 minutes), U = 451.50, z = -0.74, p > 0.05, r = -0.09.
The time spent on concept mapping in the collaborative condition is significantly different from a normal distribution, D(44) = 0.229, p < 0.001. The time spent on concept mapping in the individual condition is significantly different from a normal distribution, D(23) = 0.187, p = 0.036. The collaborative condition (Mdn = 16.50 minutes) spent significantly more time on concept mapping than the individual condition (Mdn = 14.00 minutes), U = 349.00, z = -2.08, p = 0.037, r = -0.25.
The time spent on the final test in the collaborative condition is significantly different from a normal distribution, D(44) = 0.225, p < 0.001. The time spent on the final test in the individual condition is significantly different from a normal distribution, D(23) = 0.185, p = 0.039. The collaborative condition (Mdn = 4.00 minutes) spent significantly less time on the final test than the individual condition (Mdn = 5.00 minutes), U = 303.00, z = -2.78, p = 0.005, r = -0.34.
There was a statistically significant difference in the time the participants in the collaborative condition spent on each knowledge test, χ2(2) = 86.51, p < 0.001. This was also
found for the time spent by the participants in the individual condition, χ2(2) = 36.02, p < 0.001.
21 between the intermediate test (Mdn = 6.00 minutes) and the final test (Mdn = 4.00 minutes), Z = -5.77, p < 0.001, r = -0.61, and between the pre-test (Mdn = 9.00) and the final test (Mdn = 4.00 minutes), Z = -5.81, p < 0.001, r = -0.62.
For the individual condition, there was also a significant difference in the time spent between the pre-test (Mdn = 9.00 minutes) and the intermediate test (Mdn = 6.00 minutes), Z = -3.90, p < 0.001, r =-0.58, between the intermediate test (Mdn = 6.00 minutes) and the final test (Mdn = 5.00 minutes), Z = -3.65, p < 0.001, r =-0.54, and between the pre-test (Mdn = 9.00 minutes) and the final test (Mdn = 5.00 minutes), Z = -4.02, p < 0.001, r =-0.59.
Concept maps
[image:21.595.70.514.464.743.2]The participants constructed a concept map after they completed the first part of the learning environment about the topic of ‘balloons and buoyancy’, consisting of orientation, formulating hypotheses, experimenting with a simulation and writing a conclusion. The concept map scores are discussed to gain insight into the concept maps constructed by the participants in the individual and the collaborative learning condition. An example of a concept map is shown in Figure 5. This concept map made by two collaborative participants scored one of the highest amount of points, namely 11 points out of 18, because most concepts are included and relevant, the constructed propositions are sufficient and including second level propositions and cause and effect, almost no errors, most concepts are (in)directly connected and some cycles are present in which a path can be traversed in a single direction.
Figure 5
22 The descriptive results of all concept maps are in Table 5. The concept maps of the participants mostly comprised relevant concepts (such as the “amount of gas species in the chamber” and “volume of the chamber”) and included causative dynamic propositions (with words such as “increases”, “decreases”, “sinks”, and “floats”). The following criteria scored the least amount of points among the participants’ concept maps: the formulation of propositions as semantic units, the quantity and quality of cross-links, and the presence of cycles. Often, there are no second-level propositions, few or no cross-links, and no cycles in which the entire path of concepts and links can be traversed in one direction. In most concept maps, the concepts are only linked directly to (one of) the core concept(s) and not directly linked to other concepts, or only linked to the concepts right above and below.
Table 5
Descriptive results of the total concept map score and the concept map criteria
Collaborative condition Individual condition Total concept map score Mean
Std. Deviation Range
N
8.55 1.130 5-11 44
8.50 0.740 7-10 23
Concept relevance and Mean 1.41 1.45
completeness Std. Deviation 0.497 0.510
Range 1-2 1-2
N 44 23
Propositions as semantic Mean 1.00 0.95
units Std. Deviation 0.305 0.375
Range 0-2 0-2
N 44 23
Erroneous propositions Mean 1.14 1.09
Std. Deviation 0.702 0.610
Range 0-2 0-2
N 44 23
Dynamic propositions Mean 3.86 3.95
Std. Deviation 0.347 0.213
Range 3-4 3-4
N 44 23
Quantity and quality of Mean 1.00 1.00
cross-links Std. Deviation 0 0
Range 1 1
N 44 23
Presence of cycles Mean 0.14 0.05
Std. Deviation 0.347 0.213
Range 0-1 0-1
23 The Kolmogorov-Smirnov test showed that the concept map scores in the collaborative condition, D(44) = 0.253, p < 0.001, and in the individual condition, D(22) = 0.296, p < 0.001, are significantly different from a normal distribution. The concept map scores from the collaborative condition (Mdn = 9.00) did not differ significantly from the individual condition (Mdn = 9.00), U = 454.00, z = -0.45, p > 0.05, r = -0.05.
The Kolmogorov-Smirnov test showed that all criteria for the collaborative condition are significantly different from a normal distribution: the concept relevance and completeness, D(44) = 0.386, p < 0.001, the propositions as semantic units, D(44) = 0.455, p < 0.001, the errors in the propositions, D(44) = 0.259, p < 0.001, the dynamics of the propositions, D(44) = 0.516, p < 0.001, and the presence of cycles, D(44) = 0.516, p < 0.001. Also, the Kolmogorov-Smirnov test showed that all criteria for the individual condition are significantly different from a normal distribution: the concept relevance and completeness, D(22) = 0.359, p < 0.001, the propositions as semantic units, D(22) = 0.457, p < 0.001, the errors in the propositions, D(22) = 0.332, p < 0.001, the dynamics of the propositions, D(22) = 0.539, p < 0.001, and the presence of cycles, D(22) = 0.539, p < 0.001.
The concept relevance and completeness from the concept maps of the collaborative condition (Mdn = 1.00) did not differ significantly from the individual condition (Mdn = 1.00), U = 462.00, z = -0.350, p > 0.05, r = -0.04. The propositions as semantic units from the concept maps of the collaborative condition (Mdn = 1.00) did not differ significantly from the individual condition (Mdn = 1.00), U = 463.00, z = -0.535, p > 0.05, r = -0.07. The erroneous propositions from the concept maps of the collaborative condition (Mdn = 1.00) did not differ significantly from the individual condition (Mdn = 1.00), U = 463.00, z = -0.318, p > 0.05, r = -0.04. The dynamic propositions from the concept maps of the collaborative condition (Mdn = 4.00) did not differ significantly from the individual condition (Mdn = 4.00), U = 440.00, z = -1.122, p > 0.05, r = -0.13. The quantity and quality of cross-links from the concept maps of the collaborative condition (Mdn = 1.00) did not differ significantly from the individual condition (Mdn = 1.00), U = 484.00, z = 0, p > 0.05, r = 0. The presence of cycles from the concept maps of the collaborating condition (Mdn = 0.00) did not differ significantly from the individual condition (Mdn = 0.00), U = 440.00, z = -1.122, p > 0.05, r = -0.14.
Communication of collaborating pairs
Based on the analysis, the communication can be divided into three main groups: pairs who did not communicate much, pairs who applied task division, and pairs who communicated more with no or less task division.
24 Table 6
Excerpt of communication from a pair using little communication
A “Okay, does that make any sense?”
B “So… chamber pressure, chamber volume… oh, they all three increase?” A “I think either of them increases or they sink.”
B “Okay, yeah.”
There are eight pairs who used some kind of task division. Often, when making the concept map, one person looked at the conclusions (which they wrote before moving on to the concept mapping phase; they were able to use the conclusions again, so they would not have to experiment all over again for the concept map) and the other person was working in the concept mapping tool – instead of two partners who are both typing and changing the concept map. Often, one person is talking more about the content from the conclusions and the other person is typing and adding to the concept map. Both partners are talking and contributing about the content – sharing ideas and asking and (trying to) answer each other’s questions – but each of them in a different way and often one of them to lesser extent. In Table 7, there is an example of how a pair communicates when dividing tasks.
Table 7
Excerpt of communication from a pair using task division
C “First like the pressure.”
D [works in the concept mapping tool].
C “And then… I think maybe like the things that influence pressure, so the temperature, the volume and the amount of gas.”
D [works in the concept mapping tool]. C “And then maybe like floating or sinking.” D [works in the concept mapping tool].
C “I think you mean two pressures, because one pressure of the balloon and…” D “One of the environment.”
C “Yeah.”
D “Okay.” [works in concept mapping tool]
25 Table 8
Excerpt of communication from a pair without task division
E “I just have to think about how we structure it. I was thinking like the concepts here [points to a place on the computer screen].”
F “Like rising and falling. I think that is true.” E [points to the screen].
F “Like here floats, sinks and stays the same [points to the left side on the screen] and temperature, hot air balloon [points to the right].”
E “Yeah. Yes, so… [works in the concept mapping tool, starts adding concepts] Should I do it for all the balloons?”
F “I’ll start with the balloons. A bit less is more clear. From here to there, to there” [points to a place on the screen].
In conclusion, the collaboration was not used by its full potential by the pairs: some pairs did not communicate much, some pairs divided tasks and some pairs communicated more with less or no task-division but not in an optimal way.
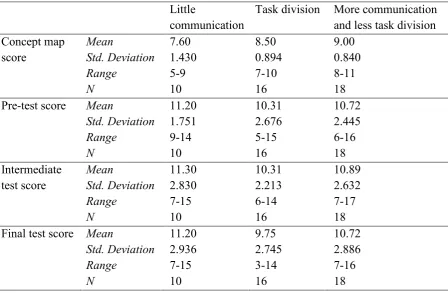
[image:25.595.75.524.467.760.2]The results of the participants in the collaborative condition of the concept map, the pre-test, the intermediate test and the final test are compared between these three groups of collaborating pairs. The descriptive results are in Table 9.
Table 9
The descriptive results of the concept map, the three knowledge tests and the types of communication and collaboration
Little
communication
Task division More communication and less task division Concept map score Mean Std. Deviation Range N 7.60 1.430 5-9 10 8.50 0.894 7-10 16 9.00 0.840 8-11 18 Pre-test score Mean
Std. Deviation Range N 11.20 1.751 9-14 10 10.31 2.676 5-15 16 10.72 2.445 6-16 18 Intermediate test score Mean Std. Deviation Range N 11.30 2.830 7-15 10 10.31 2.213 6-14 16 10.89 2.632 7-17 18 Final test score Mean
26 The scores of the three knowledge tests were not significantly affected by the types of collaboration and communication of the pairs. However, the concept map scores were significantly affected by how the pairs collaborated and communicated, H = 9.056, p < 0.015. Mann-Whitney tests were used to follow up this finding. A Bonferroni correction was applied and so all effects are reported at a 0.0167 level of significance. The concept map scores did not differ significantly between the group with little communication (Mdn = 8.00) and the group with task division (Mdn = 8.50), U = 52.00, z = -1.58, p > 0.05, r = -0.31, and between the group with task division (Mdn = 8.50) and the group with more communication and less task division (Mdn = 9.00), U = 104.00, z = -1.52, p > 0.05, r = -0.26. However, the concept map scores of the group with more communication and less task division (Mdn = 9.00) were significantly higher than the group with little communication (Mdn = 8.00), U = 32.00, z = -3.05, p < 0.005, r = -0.58.In other words, the pairs who communicated more and used less task division made better concept maps than the pairs who had little communication. No other significant results were found.
Conclusion and discussion
The goal of this research was to study the effect of collaboration on university students’ learning outcomes and construction of a concept map after engaging in a simulation-based inquiry learning environment. A comparison was conducted between 44 participants (22 dyads) working collaboratively and 23 individual participants.
The results on the three knowledge tests showed no significant difference between students who processed the material individually and students who worked in dyads. Also, the scores on the concept maps were largely comparable between both learning conditions. Difficulties in the students’ concept maps especially consisted of formulating second-level propositions and including cross-links between concepts. Thus, the hypothesis “the students in the collaborative condition will perform better on the concept map, the intermediate test and the final test than the students in the individual condition” was not met.
However, the pairs in the collaborative condition spent significantly more time on the first part of the learning environment than the individual students in the individual condition. In addition, the collaborating pairs also spent significantly more time on constructing a concept map than the individual students. This suggested that the pairs in the collaborative condition needed more time because of their conversations about the learning environment and the concept map. Yet, their communication mostly did not lead towards better results of the collaborative condition. Only the pairs who communicated more with each other and used less task division constructed better concept maps than the pairs who had little communication. However, the concept map scores from the collaborative condition overall did not differ significantly from the individual condition. Also, the pairs who performed better on the concept maps did not have higher scores on the knowledge tests.
27 knowledge tests. However, other target groups were used in these studies, often consisting of middle school students or high school students instead of university students.
There are multiple explanations possible for the fact that there were no significant differences between the collaborative condition and the individual condition in this study. These explanations can also be used to guide future research. Firstly, the topic of the learning environment, ‘balloons and buoyancy’, is difficult. A lot of participating students also said this after completing the research session. The majority of the students did not choose physics and chemistry to graduate in from high school, which means that they do not have a lot of prior knowledge about the topic. The topic of ‘balloons and buoyancy’ includes several physical laws, such as Archimedes’ principle (about the buoyant force of an object) and Boyle’s law (about the pressure and volume of gas), which makes it difficult to understand for participants who did not know these principles beforehand. A challenging topic was chosen, because when the participants have a lot of prior knowledge about the topic of the learning environment, they would not have been able to learn much from the research session which would have influenced the results. Afterwards, the topic might have been too challenging for the participants. In this case, collaborating students who both had little prior knowledge might have had difficulties in assisting and complementing each other about the subject matter. Therefore, having little prior knowledge might have reduced the added effect of collaboration. Research indicates that groups composed of students who have low prior knowledge were unfavourable (Webb, 1991), because it is more difficult for these students to communicate meaningfully and to acquire new knowledge about a topic (Gijlers, 2005).
Secondly, the students had to make three knowledge tests: the pre-test, the intermediate test and the final test. This was needed to measure to what extent the students progressed in the number of correct answers on each test. The results did not significantly improve over the three tests, but the students did take less and less time for each test. This might mean that the students recognized the questions, since each test has the same ones. However, after the pre-test, some students might have been more preoccupied with trying to remember what answer they filled in the previous time(s), instead of focusing on choosing the right answer. A number of participants also said something about this after their research session, and some participants found it hard to remember their findings from the simulation and what they answered on the previous test(s). This could be one of the causes why almost no differences between the results of the three tests were found.
One limitation of this specific research is the short preparation time for the participating students. For this research, the university students only had a couple of hours to gain an understanding of the challenging topic of the learning environment. However, for the study of Brown (2003), high school students followed a biology class with instructions and assignments before they participated in a research about photosynthesis and cellular respiration. Kwon and Cifuentes (2009) prepared middle school students with a workshop of three days on computer-based concept mapping about science concepts. Research can be done about what preparation university students need about specific topics of which they have little prior knowledge.
28 making use of collaboration scripts (e.g., Kobbe et al., 2007). The goal of collaboration scripts is to stimulate collaborative interaction that would not occur otherwise, for example by specifying the roles of the group members. However, if too much of the collaboration is being scripted, this might disturb ‘natural’ interactions and processes (Dillenbourg, 2002). Therefore, the question is how much support and scripting university students need in order to optimize collaborative learning. More research should be done about the amount of support needed for a target group of university students and the technical possibilities of integrating such support in contemporary online learning environments. Furthermore, research of the same kind might also be conducted to optimize the functioning of collaborative concept mapping tools.
29
References
Barron, B. (2000). Achieving coordination in collaborative problem-solving groups. The Journal of the Learning Sciences, 9(4), 403-436. doi:10.1207/S15327809JLS0904_2
Barron, B. (2003). When smart groups fail. The Journal of the Learning Sciences, 12(3), 307-359. doi:10.1207/S15327809JLS1203_1
Berkowitz, M. W. (1980). The role of transactive discussion in moral development: The history of a six-year program of research (part I and part II). Moral Education Forum, 5(2) and 5(3), 13-26 and 15-27. Retrieved from http://files.eric.ed.gov/fulltext/ED196750.pdf
Berkowitz, M. W., & Gibbs, J. C. (1983). Measuring the developmental features of moral discussion. Merrill-Palmer Quarterly 29(4), 399-410.
van Boxtel, C. A. M. (2000). Collaborative concept learning: Collaborative learning tasks, student interaction and the learning of physics concepts (Doctoral dissertation). Retrieved from https://www.researchgate.net/publication/46601882_Collaborative_Concept_Learning_Collab orative_Learning_Tasks_Student_Interaction_and_the_Learning_of_Physics_Concepts
van Boxtel, C., van der Linden, J., & Kanselaar, G. (2000). Collaborative learning tasks and the elaboration of conceptual knowledge. Learning & Instruction, 10, 311-330.
van Boxtel, C., van der Linden, J., Roelofs, E., & Erkens, G. (2002). Collaborative concept mapping: Provoking and supporting meaningful discourse. Theory into Practice, 41(1), 40-46. doi:10.1207/s15430421tip4101_7
van Boxtel, C. A. M. (2004). Studying peer interaction from three perspectives: The example of collaborative learning. In J. Van der Linden & P. Renshaw (Eds.), Dialogic learning. Shifting perspectives to learning, instruction, and teaching (pp. 1–15). Dordrecht: Kluwer.
Brown, D. S. (2003). High school biology: A group approach to concept mapping. The American Biology Teacher, 65(3), 192-197. doi:10.2307/4451473
Cañas, A. J., Coffey, J. W., Carnot, M. J., Feltovich, P., Hoffman, R. R., Feltovich, J., & Novak, J. D. (2003). A summary of literature pertaining to the use of concept mapping techniques and technologies for education and performance support. Pensacola, FL: The Institute for Human and Machine Cognition.
30 van Dijk, A. M., Gijlers, H., & Weinberger, A. (2014). Scripted collaborative drawing in elementary science education. Instructional Science, 42(3), 353-372. doi:10.1007/s11251-013-9286-1
Dillenbourg, P. (2002). Over-scripting CSCL: The risks of blending collaborative learning with instructional design. In P. A. Kirschner (Ed.), Three worlds of CSCL. Can we support CSCL (pp. 61–91). Heerlen: Open Universiteit Nederland.
Erkens, G., & Janssen, J. (2008). Automatic coding of dialogue acts in collaboration protocols. International Journal of Computer-supported Collaborative Learning, 3(4), 447-470.
Fischer, F., Bruhn, J., Gräsel, C., & Mandl, H. (2002). Fostering collaborative knowledge construction with visualization tools. Learning and Instruction, 12(2), 213-232.
Gijlers, H. (2005). Confrontation and co-construction: Exploring and supporting collaborative scientific discovery learning with computer simulations. Unpublished doctoral dissertation, University of Twente, Enschede, The Netherlands.
Gijlers, H., & de Jong, T. (2013). Using concept maps to facilitate collaborative simulation-based inquiry learning. Journal of the Learning Sciences, 22(3), 340-374. doi:10.1080/10508406.2012.748664
de Jong, T. (2006). Scaffolds for scientific discovery learning. In J. Elen & R. E. Clark (Eds.), Handling complexity in learning environments: Research and theory (pp. 107-128). Amsterdam: Elsevier.
van Joolingen, W. R., de Jong, T., Lazonder, A. W., Savelsbergh, E. R., & Manlove, S. (2005). Co-Lab: research and development of an online learning environment for collaborative scientific discovery learning. Computers in Human Behavior, 21(4), 671-688. doi:10.1016/j.chb.2004.10.039
van Joolingen, W. R., de Jong, T., & Dimitrakopoulou, A. (2007). Issues in computer supported inquiry learning in science. Journal of Computer Assisted Learning, 23(2), 111-119. doi:10.1111/j.1365-2729.2006.00216.x
Kinchin, I., & Hay, D. (2005). Using concept maps to optimize the composition of collaborative student groups: A pilot study. Journal of Advanced Nursing, 51(2), 182-187.
31 Kwon, S. Y., & Cifuentes, L. (2009). The comparative effect of individually-constructed vs. collaboratively-constructed computer-based concept maps. Computers & Education, 52(2), 365-375. doi:10.1016/j.compedu.2008.09.012
Mattessich, P. W., & Monsey, B. R. (1992). Collaboration: What makes it work. A review of research literature on factors influencing successful collaboration. Amherst H. Wilder Foundation, St. Paul, MN.
Mercer, N. (1996). The quality of talk in children’s collaborative activity in the classroom. Learning and Instruction, 6(4), 359-377. doi:10.1016/S0959-4752(96)00021-7
Miller, N. L., & Cañas, A. J. (2008). A semantic scoring rubric for concept maps: design and reliability. In Cañas, A. J., Reiska, P., Åhlberg, M., & Novak, J. D. (Eds.), Proceedings of the Third International Conference on Concept Mapping. Retrieved from http://cmc.ihmc.us/cmc2008papers/cmc2008-p253.pdf
National Science Foundation (NSF, 2000). An introduction to inquiry. In NSF, Foundations Vol. 2, Inquiry: Thoughts, Views, and Strategies for the K-5 Classroom (pp. 1-5). Retrieved from http://www.nsf.gov/pubs/2000/nsf99148/intro.htm
Novak, J. D. (1990). Concept maps and Vee diagrams: Two metacognitive tools to facilitate meaningful learning. Instructional Science, 19(1), 29-52.
Novak, J. D. (1995). Concept mapping to facilitate teaching and learning. Prospects, 25(1), 79-86.
Novak, J. D., & Gowin, D. B. (1984). Learning how to learn. Cambridge, United Kingdom: Cambridge University Press.
Novak, J. D., & Musonda, D. (1991). A twelve-year longitudinal study of science concept learning. American Educational Research Journal, 28(1), 117-153.
Nussbaum, E. M. (2008). Collaborative discourse, argumentation, and learning: Preface and literature review. Contemporary Educational Psychology, 33(3), 345-359. doi:10.1016/j.cedpsych.2008.06.001
Teasley, S. D. (1997). Talking about reasoning: How important is the peer in peer collaboration? In L. B. Resnick, R. Säljö, C. Pontecorvo, & B. Burge (Eds). Discourse, Tools and Reasoning (pp. 361-384). doi:10.1007/978-3-662-03362-3_16
32 Webb, N. M. (1991). Task-related verbal interaction and mathematics learning in small groups. Journal for Research in Mathematics Education, 22(5), 366-389. doi:10.2307/749186
33
Appendix
Appendix A – Knowledge test questions and answers
1. How do most substances relate to air? a) Most substances are less dense than air. b) Most substances have the same density as air. c) Most substances are more dense than air.
d) Most substances have less mass than an equal volume of air. Answer: c) Most substances are more dense than air.
2. Which has more weight, a balloon filled with helium or the same size balloon filled with air?
a) The air-filled balloon. b) The helium balloon.
c) Neither – they both have the same weight. Answer: a) The air balloon.
3. Which has the larger buoyant force (upward force), a balloon filled with helium or the same size balloon filled with air?
a) The air-filled balloon. b) The helium balloon.
c) Neither – they both experience the same buoyant force.
Answer: c) Neither – they both experience the same buoyant force.
4. Why will a helium-filled balloon float in air? a) There is more air than helium.
b) Helium is less dense than air. c) Helium is as dense as air. d) Helium is more dense than air.
Answer: b) Helium is less dense than air.
5. Until what point will a helium-filled balloon that is released into the atmosphere rise? a) Until the balloon’s density equals atmospheric density.
b) Until the pressure inside the balloon equals atmospheric pressure.
c) Until atmospheric pressure on the top and bottom of the balloon are equal. d) Until the balloon can no longer expand.
Answer: a) Until the balloon’s density equals atmospheric density.
Meaning of “buoyed up”
The verb “buoyed up” means something is drifting upward.
6. What is the force that buoys up a balloon in air equal to? a) The density of surrounding air.
b) The atmospheric pressure. c) The weight of air it displaces.