Master thesis, optimizing the reverse
process of PostNL pakketten
Student: Bram Pijnappel
PostNL supervisor: Francine Tol
University of Twente supervisors: Martijn Mes
Summary
This research is conducted at the PostNL parcels headquarters in Hoofddorp. The parcel market in the Netherlands is growing fast (17.2% in 2017 (PostNL, 2018)), the market of reverse parcels is growing even faster. The rapidly growing number of reverse parcels and the concerns at PostNL if the current processes are the most efficient processes are the motivation for this research. Together with PostNL, the following research question is developed:
To what extent is the reverse chain of PostNL robust and sustainable and how should it be organized and designed to be robust and sustainable for the next 5 years considering the expected growth?
We separated this research question in two parts, the assignment of customers to processes, which can be seen as a multiple knapsack problem, and process improvement, which can be seen as a shortest path problem. The process improvement is embedded in the hub and spoke network of PostNL, the goal of the process improvement is to come with a new, robust and sustainable process.
The research question is answered in the five sections of this research. First the current situation is analyzed by getting clarity over the current processes and involved stakeholders. At this moment, PostNL distinguishes three different processes: “Verzend” process, “Ritsortering” process and the “Hengelo/Nieuwegein” process. Around 60% of the reverse parcels is handled via the “Verzend” process, 30% via the “Hengelo/Nieuwegein” process and 10% via the “Ritsortering” process. The internal stakeholders involved in this research are the different logistics designers, depot’ management and the control room. The external stakeholder considered is the customer of PostNL.
After the analysis of the current situation we studied literature. The main goal of the literature study is to get to know how problems related to the problem at PostNL are solved in literature. The first part of the literature study was aimed at reverse logistics optimization. We focused on reverse logistics in the hub and spoke network and on reverse logistics in ecommerce. We found that models to optimize the hub and spoke networks are most of the time modeled as MILP models. A powerful method to solve those problems is the CPLEX algorithm. The second part of the literature study is aimed at a literature study to assign customers to processes. In this part of the literature study we found that it might add value to apply chance constraints. Chance constraints are constraints that should be met with a certain probability. A method to solve a chance constrained model is the method of Ben-Tal and den Hertog (2011) in combination with the CPLEX 12.6 algorithm as described by Bliek, Bonami, & Lodi (2014).
The next step in the research was to study what ideas to improve the process are present within PostNL and what ideas can be generated by a brainstorm and mind mapping. This resulted in four feasible process designs that are incorporated in the research. The ideas are: a central reverse depot, depot transcending truck routes, a central reverse depot with hubs and decentral reverse depots. The idea of a central reverse depot is that nearly all customers are served via one central location, the parcels will no longer disturb the regular process. In the depot transcending truck route process, a truck drives via different customers to deliver the parcels in roll containers. In a central reverse depot with hubs the parcels are sorted at a central reverse depot and distributed via multiple hubs. In the decentral reverse depot, the process as is in Nieuwegein and Hengelo is extended with more depots and customers assigned to one of these depots.
implementation in AIMMS. Different experiments are developed to test the impact of customer specific data for the delivery costs and parcel size. Additional experiments are conducted to determine what the cheapest processes are. We developed a Monte Carlo simulation to test the outcome of the cost optimization on robustness.
Before we conducted the experiments, we validated the model by conducting a Monte Carlo simulation of the current situation. The problem owner at PostNL stated that the output of this simulation was close to reality and thereby that the model was valid. Besides we compared the outcome with our analysis of the current situation and we note that the outcome of the Monte Carlo simulation is similar to reality.
In the conducted experiments, we found that the customer specific delivery costs and parcel’s size have a small impact on the assignment of customers to processes. Therefore, the customer specific information is used in the optimizations to determine what PostNL should do at this moment and in five years from now. In both, situations the central reverse depot turned out to be the cheapest solution for most of the customers regarding the operational costs. In the situation in five years, the depot transcending truck tours are a cost efficient process as well.
We tested the different new processes that we designed on the costs, impact on the stakeholders, scalability and robustness. Based on pairwise comparison by the problem owners we came with weights for the different criteria. From these weights it turned out that the costs, is the most important criterium, followed by the scalability/robustness and the impact on the customer.
New process/ Impact on
Central reverse depot
Decentral reverse depots
Depot transcending truck tours
Central reverse depot with hubs
Costs ++ +- + -
Scalability/ robustness
+/- +-/+ +/+- +/-
Customer +- + + +-
Table 1 Compare new processes
As can be seen in the table above, the depot transcending truck routes and central reverse depot both score well on the two most important criteria. Besides, the impact on the customer is positive for the depot transcending truck routes.
When we do not change the processes of PostNL, we can, in an ideal situation, reduce the operational costs of the reverse process of PostNL with 6.7%. In this situation we for example assume that the depots do not have appointments with transporters about the biggest reverse customers in their “Ritsortering” process. Therefore, this costs reduction of 6.7% is not likely to be reachable in practice. When we can introduce new processes at PostNL we can reduce the operational costs by 21%. To be able to do so, significant investments should be made, and further research should be conducted.
To conclude, we recommend PostNL to
- Implement the depot transcending truck routes process on the short term
- Study the possibilities for a central reverse depot
For the longer term PostNL should study the possibilities of a central reverse depot. It should be studied with which other processes this dedicated reverse depot can be combined to create a high utilization of the depot.
- Question if all reverse parcels should be delivered in one day
When this is no longer a constraint, new possibilities for processes occur that might be cost efficient and scalable.
- Study the possibilities of separation at collection
Preface
Dear reader,At this moment you are reading the master thesis I have conducted at PostNL pakketten. This master thesis is the last product I have created as Industrial Engineering and Management student at the University of Twente and marks the end of my study time.
I would like to thank everyone from the StafOps department at PostNL for the interest they have shown in my graduation project and input they gave me. I want to thank the “Ketenbeheer & Ontwerp” team for answering all my questions regarding all kinds of processes, methods and habits at PostNL. In special I would like to thank Francine Tol for all her input and critical review on my writings.
To conclude I would like to thank Martijn Mes and Leo van der Wegen for their feedback and supervision on behalf of the University of Twente.
I wish you a lot of pleasure in reading my master thesis,
Table of Contents
Summary ... iii
Preface ... vi
Definitions and abbreviations ... xi
Overview of figures ... xii
Overview of tables ... xiii
1 Introduction ... 1
1.1 Company introduction ... 1
1.2 Problem introduction ... 1
1.2.1 Problem context ... 1
1.2.2 Problem identification ... 4
1.2.3 Problem without the context ... 5
1.3 Research introduction ... 6
1.3.1 Research scope ... 6
1.3.2 Research objective ... 6
1.3.3 Research questions and methodology ... 6
1.4 Structure of the report ... 8
2 Analysis of the current situation ... 9
2.1 Description of the reverse processes ... 9
2.1.1 Three different reverse processes ... 9
2.1.2 Cost structure ... 11
2.1.3 Data analysis ... 14
2.2 Number of parcels handled via the different reverse processes ... 22
2.3 Number of parcels that can be handled in the current situation of PostNL ... 22
2.4 Current way of assigning reverse processes to customers ... 23
2.5 Stakeholder analysis ... 24
2.5.1 Logistics designers reverse process ... 24
2.5.2 Depot’ management... 24
2.5.3 Logistics designers regular parcel flow ... 24
2.5.4 Control room management ... 25
2.5.5 Customers ... 25
2.6 Conclusion analysis current situation ... 25
3 Literature study ... 26
3.1 Literature study reverse logistics ... 26
3.1.2 Reverse logistics in ecommerce ... 27
3.1.3 Reverse logistics models ... 28
3.1.4 Conclusion ... 29
3.2 Literature study assigning customers to processes ... 29
3.2.1 Deterministic multiple knapsack problem with assignment restriction solution method 29 3.2.2 Stochastic programming ... 30
3.2.3 Conclusion ... 32
3.3 Conclusion literature study ... 33
4 Ideas for improvement ... 34
4.1 Solutions existing at PostNL ... 34
4.1.1 Shift-0 ... 34
4.1.2 Slide ... 34
4.1.3 Central reverse depot ... 34
4.2 Radical innovations for process improvements ... 35
4.2.1 Creative methods ... 35
4.2.2 Solutions generated ... 36
4.3 Conclusion ideas for improvement ... 40
5 Model design ... 41
5.1 Conceptual model ... 41
5.2 Proposed model ... 42
5.2.1 Mathematical model ... 42
5.2.2 Solution method ... 43
5.3 Monte Carlo simulation ... 44
5.4 Experimental design ... 44
5.5 Validation ... 47
5.6 Conclusion ... 47
6 Evaluation of solutions ... 48
6.1 The pros and cons of the solutions ... 48
6.1.1 Feasibility of solutions ... 48
6.1.2 Cost structure new solutions ... 48
6.1.3 Impact on stakeholders ... 50
6.1.4 Scalability and robustness ... 51
6.2 Results experiments ... 51
6.2.3 Impact of delivery costs depot transcending truck tours ... 55
6.2.4 Impact of percentile ... 56
6.2.5 Impact stochastic optimization ... 57
6.2.6 Optimization with the current demand ... 58
6.2.7 Optimization five years from now ... 59
6.2.8 Concluding remarks cost optimization ... 60
6.3 Best solution found ... 61
7 Conclusion and recommendations ... 63
7.1 Conclusion ... 63
7.2 Recommendations... 63
8 Assumptions and further research ... 65
8.1 Assumptions and further research regarding designed processes ... 65
8.2 Assumptions and further research regarding the optimization model ... 65
8.3 Assumptions and further research reverse process in general ... 66
8.4 Scientifically interesting further research ... 66
References ... 67
Appendix ... 72
Appendix 1 - histogram reverse parcels over the week ... 72
Appendix 2 - impact on stakeholder ... 74
“Verzend” ... 74
“Hengelo/Nieuwegein” ... 74
“Ritsortering”... 75
Central reverse depot ... 75
Depot transcending truck routes ... 76
Central reverse depot with decentral hubs... 76
Decentral reverse depots ... 77
Appendix 3 - scalability and robustness ... 79
“Verzend” ... 79
“Hengelo/Nieuwegein” ... 79
“Ritsortering”... 79
Central reverse depot ... 79
Depot transcending truck routes ... 80
Central reverse depot with hubs ... 80
Decentral reverse depots ... 80
Appendix 6 - AIMMS implementation ... 84
Appendix 7 - Output experiments ... 85
Experiment 1 ... 85
Experiment 2 ... 85
Experiment 3 ... 85
Experiment 4 ... 85
Experiment 5 & 6 ... 85
Experiment 7 ... 85
Experiment 8 ... 86
Experiment 9 ... 86
Experiment 10 ... 86
Experiment 11 ... 86
Experiment 12 ... 87
Experiment 13 ... 87
Experiment 14 ... 87
Experiment 15 ... 87
Experiment 16 ... 88
Experiment 17 ... 88
Experiment 18 ... 88
Experiment 19 ... 88
Definitions and abbreviations
Customer The customers of PostNL are defined as the web shops that provide the parcels Consumer The person who orders and receives the parcel
PNP PostNL Pakketten
Regular parcel flow Parcel flow from the customer to the consumer Reverse parcel flow Parcel flow from the consumer to the customer
Overview of figures
Figure 1 Volume PostNL parcels (PostNL, 2018) ... 2
Figure 2 Map of depots ... 2
Figure 3 Overview supply chain PostNL pakketten ... 3
Figure 4 Problem mind map ... 5
Figure 5 Steps in research ... 7
Figure 6 Reverse process via "Ritsortering" ... 10
Figure 7 Reverse process via “Verzend” ... 10
Figure 8 Reverse process Via Hengelo/Nieuwegein ... 11
Figure 9 Total costs 25 parcels per container ... 14
Figure 10 Total costs 125 parcels per container ... 14
Figure 11 Number of parcels per week ... 15
Figure 12 Boxplot reverse parcels Customer y ... 17
Figure 13 Histogram reverse parcels per day of the week Customer y ... 17
Figure 14 Boxplot reverse parcels Customer x ... 17
Figure 15 Histogram reverse parcels Customer x, combination of normal distributions plotted ... 18
Figure 16 Histogram reverse parcels Customer x, single normal distribution plotted ... 18
Figure 17 Boxplot Hengelo reverse parcels ... 19
Figure 18 Histogram Hengelo reverse parcels ... 19
Figure 19 Boxplot Nieuwegein reverse parcels ... 20
Figure 20 Histogram Nieuwegein reverse parcels ... 20
Figure 21 Diagram of size of customers ... 21
Figure 22 Heat map reverse customers PostNL ... 21
Figure 23 Decision tree reverse process ... 24
Figure 24 Overview reverse logistics (Rajagopal, Sundram, & Naidu, 2015) ... 27
Figure 25 Example of a non convex quadratic problem, six hump camelback function (WaveOpt_Lab, 2018) ... 32
Figure 26 Central reverse depot ... 35
Figure 27 Depot transcending truck routes process ... 37
Figure 28 Process flow chart central reverse depot with hubs ... 38
Figure 29 Process flowchart dedicated sorting at all depots ... 39
Figure 30 Sort as reverse depot ‘i’ ... 39
Figure 31 Overview steps in experiment ... 45
Figure 32 Progress information deterministic optimization ... 52
Overview of tables
Table 1 Compare new processes ... iv
Table 2 Definitions and abbreviations ... xi
Table 3 Overview market segments PostNL ... 4
Table 4 Costs building blocks in process ... 13
Table 5 Distribution of reverse volume ... 22
Table 6 Capacity in reverse processes ... 23
Table 7 Experimental design ... 46
Table 8 Diversion volume per process validation ... 47
Table 9 Cost structure new solutions ... 49
Table 10 Summary rating processes ... 50
Table 11 Summary scalability and robustness ... 51
Table 12 Number of iterations Monte Carlo simulation ... 53
Table 13 Assignment of customer to processes Experiment 9, demand in five years, new processes, deterministic, perc 98.4, average parcel size and average transport costs ... 53
Table 14 Assignment of customer to processes Experiment 10, demand in five years, new processes, stochastic, average parcel size and average transport costs ... 54
Table 15 Assignment of customer to processes Experiment 11, demand in five years, new processes, deterministic, perc 98.4, average parcel size and customer specific transport costs ... 54
Table 16 Assignment of customer to processes Experiment 12, demand in five years, new processes, stochastic, average parcel size and customer specific transport costs ... 54
Table 17 Assignment of customer to processes Experiment 7, demand in five years, new processes, deterministic, perc 98.4, customer specific parcel size and average transport costs ... 55
Table 18 Assignment of customer to processes Experiment 8, demand in five years, new processes, stochastic, customer specific parcel size and average transport costs ... 55
Table 19 Assignment of customer to processes Experiment 13, demand in five years, new processes, deterministic, perc 98.4, customer specific parcel size and customer specific transport costs, high cost depot transcending truck route ... 55
Table 20 Assignment of customer to processes Experiment 18, demand in five years, new processes, deterministic, perc 98.4, customer specific parcel size and customer specific transport costs, medium cost depot transcending truck route ... 56
Table 21 Assignment of customer to processes Experiment 19, demand in five years, new processes, deterministic, perc 98.4, customer specific parcel size and customer specific transport costs, low cost depot transcending truck route ... 56
Table 22 Results Experiment 13, demand in five years, new processes, deterministic, perc 98.4, customer specific parcel size and customer specific transport costs ... 56
Table 23 Results Experiment 15, demand in five years, new processes, deterministic, perc 95, customer specific parcel size and customer specific transport costs ... 57
Table 24 Results Experiment 16, demand in five years, new processes, deterministic, perc 90, customer specific parcel size and customer specific transport costs ... 57
Table 25 Results Experiment 17, demand in five years, new processes, deterministic, perc 75, customer specific parcel size and customer specific transport costs ... 57
Table 26 Results Experiment 1, current demand, existing processes, deterministic, perc 98.4, customer specific parcel size and customer specific transport costs ... 58
Table 28 Monday only, results Experiment 2, current demand, existing processes, stochastic, customer
specific parcel size and customer specific transport costs ... 59
Table 29 Results Experiment 3 and 4, current demand, new processes, customer specific parcel size and customer specific transport costs ... 59
Table 30 Results Experiment 13, demand in five years, new processes, deterministic, perc 98.4, customer specific parcel size and customer specific transport costs ... 60
Table 31 Results Experiment 13 Monday only, demand in five years, new processes, deterministic, perc 98.4, customer specific parcel size and customer specific transport costs ... 60
Table 32 Results Experiment 14, demand in five years, new processes, stochastic, customer specific parcel size and customer specific transport costs... 60
Table 33 Results Experiment 14 Monday only, demand in five years, new processes, stochastic, customer specific parcel size and customer specific transport costs ... 60
Table 34 Relative weight per criterium ... 61
Table 35 Concluded weight per attribute ... 61
Table 36 Assignment of customer to processes Experiment 1 ... 85
Table 37 Assignment of customer to processes Experiment 2 ... 85
Table 38 Assignment of customer to processes Experiment 3 ... 85
Table 39 Assignment of customer to processes Experiment 4 ... 85
Table 40 Assignment of customer to processes Experiment 7 ... 85
Table 41 Assignment of customer to processes Experiment 8 ... 86
Table 42 Assignment of customer to processes Experiment 9 ... 86
Table 43 Assignment of customer to processes Experiment 10 ... 86
Table 44 Assignment of customer to processes Experiment 11 ... 86
Table 45 Assignment of customer to processes Experiment 12 ... 87
Table 46 Assignment of customer to processes Experiment 13 ... 87
Table 47 Assignment of customer to processes Experiment 14 ... 87
Table 48 Assignment of customer to processes Experiment 15 ... 87
Table 49 Assignment of customer to processes Experiment 16 ... 88
Table 50 Assignment of customer to processes Experiment 17 ... 88
Table 51 Assignment of customer to processes Experiment 18 ... 88
1
Introduction
In this chapter the master thesis is introduced. First in Section 1.1 the company PostNL is introduced. Section 1.2 describes the problem context and identifies the problem. Section 1.3 introduces the research questions and explains how those questions are answered. Section 1.4 explains the structure of this report.
1.1
Company introduction
This research is conducted at the PostNL pakketten (PNP) headquarters in Hoofddorp. PostNL in its current state is founded in 2011. It was formerly a part of PTT that was government owned and founded in 1928. In 2017 PostNL delivered 207 million parcels and 1,994 million letters (PostNL, 2018). The daily number of parcels is around 660,000 and the daily number of reverse parcels is around 70,000. In 2017, the postal department of PostNL employed 33,305 people and generated a revenue of 1,783 million euro. The parcel department employed 4,136 people and generated a revenue of 1,110 million euro. In 2017 the growth in parcel volume was 17.2% (PostNL, 2018).
In this research the customers of PostNL are defined as the companies that send the parcels to the consumers. Those customers are defined in three distinct classes: a small web shop that sends a few parcels per day, a medium size web shop that sends up to a few hundred parcels per day, and the big size that sends thousands of parcels per day. There are no exact limits on those classes. A customer can be moved between classes when this is required.
The problem owner is the responsible person for the reverse process of the department “Ketenbeheer en ontwerp (KBO)” (chain management). This department consists of logistics designers who are all responsible for a certain part of the process.
1.2
Problem introduction
In this section the problem is introduced. First, we describe the context, the knowledge about the context is used to identify the problem.
1.2.1
Problem context
To understand the challenges in this thesis the context should be clear. This context is now described.
Figure 1 Volume PostNL parcels (PostNL, 2018)
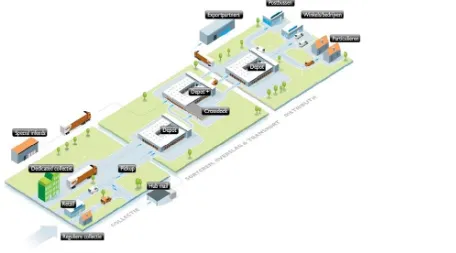
The depots described before are part of a bigger PostNL network. A visualization of the entire PostNL network is given in Figure 3. A distinction is made between different process stages at PostNL. At the left of the figure the collection methods are visualized. In the middle section the first sorting, transshipment and transport are visualized. In the right part the distribution processes are given. A distinction is made between house distribution and company distribution. The house distribution is delivered via the delivery vans, where the company distribution is delivered by trucks and vans. In this research we focus on the sorting, transshipment and distribution phase. At the depots and depots+ the parcels are sorted with a machine called the Sorter. This sorter sorts the parcels in gutters, at the bottom of the gutter a person puts the parcel in a roll container. At each gutter there are six slots for roll containers with different destinations.
Figure 3 Overview supply chain PostNL pakketten
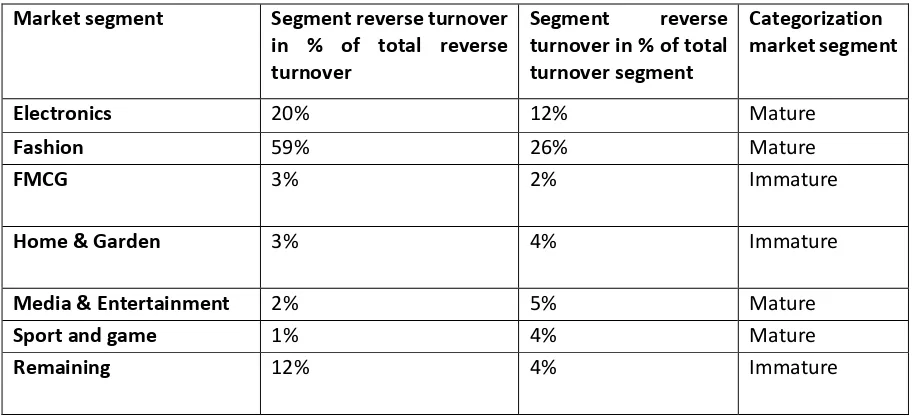
The reverse parcels PostNL handles are divided over different market segments. The major part of the turnover is in the Fashion segment, 59% of the turnover in reverse parcels is in the fashion segment. From the total turnover generated in the fashion segment 26% is generated via the reverse parcels. In mature market segments it can be assumed that the customer base of PostNL in the future is structured in the same way as the customer base at this moment. Based upon the forecasting analyst of PostNL, the total market expands, but the ratio of small, medium and big web shops stays approximately the same. For immature markets it is not possible to predict the customer base. If a market is mature or immature depends on multiple factors, for example the percentage online sales of total sales in the market. The classification is given by a market intelligence manager of PostNL.
Market segment Segment reverse turnover in % of total reverse turnover
Segment reverse turnover in % of total turnover segment
Categorization market segment
Electronics 20% 12% Mature
Fashion 59% 26% Mature
FMCG 3% 2% Immature
Home & Garden 3% 4% Immature
Media & Entertainment 2% 5% Mature
Sport and game 1% 4% Mature
[image:18.595.70.529.69.277.2]Remaining 12% 4% Immature
Table 3 Overview market segments PostNL
To serve the customers in those different market segments, PostNL distinguishes three different reverse processes. For now, it is sufficient to understand that there are three different processes and each customer is served by one of these processes. We come back on these processes in Section 2.1. Different processes are created since there is a variety of customers and customer wishes for packaging. The number of reverse parcels for one customer varies from a few parcels a week for a small customer till thousands of parcels per day for a large customer. Some customers want to receive the reverse parcels on a pallet, loosely loaded or in a corlet where the PostNL roll container is the standard packaging. To be able to fulfill those wishes in an efficient way, the three different processes are designed.
1.2.2
Problem identification
As mentioned before, the demand for the delivery of parcels is increasing substantially. This leads to pressure on the systems and processes of PostNL. PostNL opened in 2017 one new depot. This resulted in an increase of capacity of roughly 5.5%, an increase from 18 to 19 depots, but the total volume of parcels increased with 17.2%. This resulted in an increase of the volume per depot. The forecasting analysts of PostNL think that the volume of reverse parcels will double in the next five years. The number of parcels handled by PostNL is expected to grow in the future with approximately the same speed as at it does at this moment. PostNL is not able to build depots in the same speed as the volume is increasing. This means that the utilization of the current processes increases, and the processes should become more efficient.
The problem that PostNL wants to be solved is that the reverse process might not be robust and sustainable for the next five years. Robustness is defined by Vlajic, Vorst, & Haijema (2012) as: “the degree to which a supply chain shows an acceptable performance in (each of) its Key Performance Indicators (KPIs) during and after an unexpected event that caused disturbances in one or more logistics
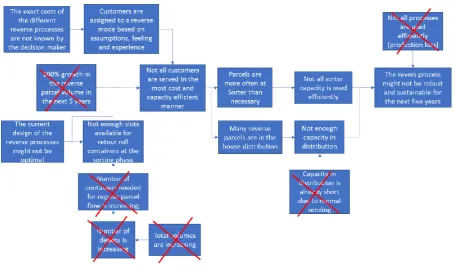
we map the relation between different problems and symptoms that are related to the problem we solve in this research.
Figure 4 Problem mind map
1.2.3
Problem without the context
When we look at the problem studied at PostNL, we can distinguish two different problems: assignment of customers to processes and reverse process design. We now separate the problems from the context and present the theoretical framework for the problem. First, we discuss the determination of the reverse process for the customer. Secondly, the process design problem is discussed. We end this section with a short conclusion.
If we go to the basis of the assignment of customers to processes, the problem can be stated as: all customers should be served by a process, each process has limited resources, the overall costs should be minimized. This looks like a knapsack problem, which was first defined by Dantzig (1957). An informal definition is: maximize the profit with the given budget. In other words, the best result with given resources should be reached. In the PostNL case, the budget is the capacity and the profit is maximized by minimization of costs. There are multiple processes that have capacity available. In other words, there are multiple knapsacks. The multiple knapsack problem is defined as a problem that consists of m knapsacks with different capacities, objects should be divided over the knapsacks to generate profit (Khuri, Bäck, & Heitkötter, 1994). The three different processes with the capacity related can be considered as multiple knapsacks. Some customers can only be assigned to specific reverse processes, due to specific wishes of the customer. According to Dawande, Kalagnanam, Keskinocak, Ravi, & Salman (2000) the difference between a multiple knapsack problem and a multiple knapsack problem with assignment restriction is that, for each item j a set Aj of knapsacks that can hold item j is specified. Applied to the PostNL case, some customers can only be hold by certain processes. The multiple knapsack problem is therefore changed to a multiple knapsack problem with assignment restriction.
actions might be required. In the shortest path problem, the goal is to find the shortest path from a source node to a target node among all paths that satisfy the criteria (Lorenz & Raz, 2001). Since there are 19 depots in the Netherlands where a parcel can enter the system, there are multiple sources. So, we have a shortest path problem with multiple sources, Klein (2005) named this problem as a multiple source shortest path problem.
To conclude, the assignment of customers to processes can be seen as multiple knapsack problem with assignment restriction and the process design as a multiple source shortest path problem.
1.3
Research introduction
The research is introduced in this section. First the scope of the research is set, secondly the objectives are formulated and then the research questions are stated. In stating the research questions, the research approach is described directly.
1.3.1
Research scope
This thesis is focused at the system of PostNL that is involved in the reverse process from the moment that the parcels arrive at the first depot until the moment that the parcels are delivered at the customer. The regular parcel flow is outside the scope of the research but is considered a constraint. For example, process changes that reduce the capacity available for the regular parcels are impossible. The reverse process design is within the scope of the research. The allocation of customers to a depot and a reverse process is variable. Route and location optimization of and between depots are not within the scope of this research.
The parcels that are considered are the parcels that are classified as machine enabled. These are parcels that are smaller than 58*70*100 cm and have a weight between 0.1 kg and 31.5 kg. This scope is set since nearly all reverse parcels fit in this category and the data collected by the sorting machine is the basis to determine the number of reverse parcels per customer and per process. Reverse customers that are too small to detect in the data as reverse customer are not considered in this research. PostNL does not know if a parcel in that low volume is a reverse or a regular parcel.
Based on the wishes of PostNL in the cost optimization only the operational costs are considered.
1.3.2
Research objective
The objective of this research is to get to know to what extent the current reverse process of PostNL is robust and sustainable and to come up with improvements to the reverse process in terms of robustness and sustainability. This can be by designing new processes additional to the current processes, instead of the current processes or by improving the current processes. It is required that the reverse parcels are delivered in time 98.4% of the days, this results in five days per year that parcels are not delivered in time.
1.3.3
Research questions and methodology
In this section the research questions are defined and the methodology to answer them is explained. The main question in this research is developed with PostNL and is:
To what extent is the reverse chain of PostNL robust and sustainable and how should it be organized and designed to be robust and sustainable for the next 5 years considering the expected growth?
In Figure 5 those activities are mapped in a chronological sequence. The arrows on the left and right of the activities are used to show dependencies between the activities. For example, outcomes of the literature study are required to be able to conduct the model design and validation.
Figure 5 Steps in research
1.3.3.1 Analysis current situation
It is important to understand the current situation at PostNL before examining if the situation is future proof. As described in the reverse process specific context, there are multiple reverse processes with all specific characteristics. It is important to know how those processes are organized and what the processes can handle.
1. How much parcels are handled via the different reverse processes?
2. How much reverse parcels can be handled in the current situation of PostNL? 3. In what way are reverse processes currently assigned to the customers?
4. What are important stakeholders in the reverse process and what are their interests?
The information needed to answer the questions above will be gathered by interviews with the concerned logistics designers and by data analysis. The data can be collected with the track and trace system of PostNL that is used to store all data concerning the scan events of parcels. Data that is collected in the track and trace system are scan notifications. Scan notifications are generated when a parcel is on the sorter or scanned by the hand device of the parcel deliverer.
1.3.3.2 Literature study
In the literature study we study how comparable problems as the problem at PostNL are solved and modeled. Besides we investigate how the customers of PostNL can be classified since we have the idea that the current classification of customers is not ideal. To test solutions a model is needed, how this model should be developed is studied in literature as well. The literature study will be focused on mathematical models and not on process improvements.
5. What can we learn from literature about reverse logistics optimization?
6. What can we learn from literature about the assignment of customers to processes?
1.3.3.3 Ideas for improvement
Ideas to improve the problems found in the analysis of the current situation will be gathered by two research questions. We think that radical innovations cannot be excluded upfront. Research questions that are used to find ideas for improvement are:
7. What are existing solutions for the problems encountered that are already present within PostNL?
8. What radical innovations can we think of for the solution of the process design improvement?
Research question 7 is answered by interviews with different involved stakeholders within PostNL. To answer research question 8, a small literature study will be conducted, based on this literature study methods are selected that are used as tools to come to radical innovations.
1.3.3.4 Model design and validation
To test the solutions that are created a model is needed. The model shall be developed and validated in this stage of the research.
9. How can we design a model to be helpful in evaluating solutions for the problems encountered at PostNL?
Research question 9 shall be answered based on research questions 5 and 6. The results of those research questions shall be used to develop a model. This model is created after answering research question 9, the model will be proposed at this research question.
1.3.3.5 Evaluation of solutions
Solutions found in research questions 7 and 8 are evaluated by the next two research questions:
10. What are the pros and cons of the solutions for the stakeholders, and which solutions are feasible?
11. What is the best solution found?
Research question 10 will be answered by interviews with several stakeholders and by reasoning of the researchers. To answer research question 11, the solutions that are feasible will be modeled and the results of the solutions will be computed. To decide what the best solution is, a combination of the computed results of the solutions and the pros and cons for the stakeholders will be used.
1.4
Structure of the report
2
Analysis of the current situation
In this chapter the current situation at PostNL is analyzed. This is done by answering the research questions stated in Chapter 1. First the reverse processes at PostNL are studied in detail. This chapter is structured as follows:
• 2.1 Description of the reverse processes
In Sections 2.2 till 2.5 the next research questions are answered:
• 2.2 How much parcels are handled via the different reverse processes?
• 2.3 How much reverse parcels can be handled in the current situation of PostNL? • 2.4 In what way are reverse processes currently assigned to the customers?
• 2.5 What are important stakeholders in the reverse process and what are their interests?
2.1
Description of the reverse processes
The customers of PostNL can receive the reverse parcels via three different processes. The three processes are first described. After the processes are described, cost structures for the different processes are described. At the end of this section, data about the seasonality at PostNL is analyzed.
2.1.1
Three different reverse processes
In this section the three different reverse processes are explained in detail. For all reverse processes we describe the route of the reverse parcel. In the figures that visualize the processes, the big arrows visualize a transport action between depots by a truck. The thin arrows visualize an internal transport within a depot. First, we dive into the “Ritsortering” process, second the “Verzend” process, and the last process is the “Hengelo/Nieuwegein” process.
2.1.1.1 “Ritsortering” process
When a customer receives the parcel via the “Ritsortering” process, the parcel is delivered with a PostNL delivery van. This reverse process is only used for small customers. Unfortunately, there is no clear definition of a small customer. In theory the parcels handled via this process should be delivered in a normal distribution tour. That is the same as delivering parcels to consumers. In practice this is not always the way the process is used. When a customer receives too many reverse parcels, it gets a dedicated tour. In a dedicated tour, a delivery van goes dedicated towards one or several customers. This dedicated tour is more expensive per parcel than a regular tour. The turning point between a normal tour and dedicated tour is not fixed and each depot handles this in its own way. An overview of the “Ritsortering” process is given in Figure 6. To create more feeling with the process an example of the flow of such a parcel is given. In the flow of the parcel the term shift is introduced. A shift is a cluster of delivery van tours that departs at the same time to deliver the parcels to the small web shops and consumers.
Between some depots daily full truckloads are transported. In that case the parcel does not visit a cross dock but directly goes to the depot close to the customer.
Figure 6 Reverse process via "Ritsortering"
2.1.1.2 “Verzend” process
When a customer is in the “Verzend”, the customer gets its own roll container place at all depots in the Netherlands in the first sorting phase. At all depots the layout during this sorting stage is the same. This is the sorting phase conducted at the local depot. This reverse process is only used for the biggest customers of PostNL, the process is given in Figure 7. There is only a limited number of roll container slots available. This sorting phase is used by the regular parcel flow as well, which is the same process as the “Ritsortering” process described above. To create more feeling with the “Verzend” process an example of the flow of such a parcel is given.
Suppose someone from Enschede has ordered something at giantwebshop.nl that does not satisfy his/her demands. The parcel is delivered to a PostNL service point in Enschede. From the PostNL service point the parcel is transported to a depot close by in this case depot Hengelo. At depot Hengelo the parcel is sorted based on the customer of PostNL, in this case giantwebshop.nl. The parcel is placed in a roll container at depot Hengelo dedicated to giantwebshop.nl with all other parcels for giantwebshop.nl. Suppose that the warehouse of giantwebshop.nl is close to depot Halfweg. Then the container is transported by truck from depot Hengelo, maybe via cross dock Nieuwegein, to depot Halfweg. In practice, most giant web shops are close to the depot+ in Den Bosch. For simplicity PostNL decided to handle most giant customers via Den Bosch. At depot Halfweg all containers for giantwebshop.nl from the Netherlands are collected and transported by truck to the warehouse of giantwebshop.nl.
For some customers, additional steps in the process are requested before the containers can be loaded in the truck. This does not influence the process choice since those additional handlings are the same in each process.
Figure 7 Reverse process via “Verzend”
2.1.1.3 “Hengelo/Nieuwegein” process
“Ritsortering” process, too small to be in the “Verzend” or have special requirements like reverse parcels on a pallet. The reverse process via Hengelo/Nieuwegein is given in Figure 8, to create more feeling with the process an example of the flow of such a parcel is given.
Suppose someone from Haarlem has ordered something at mediumwebshop.nl that does not satisfy his/her demands. The parcel is delivered to a PostNL service point in Haarlem. From the PostNL service point the parcel is transported to a depot close by in this case depot Halfweg. At depot Halfweg the parcel is sorted based on the customer of PostNL, in this case medium customers. A distinction is being made between the customers that are served via Hengelo and via Nieuwegein. The parcel is placed in a roll container at depot Halfweg, together with the parcels for the other customers that are sorted via Hengelo or Nieuwegein. The parcels for depot Hengelo are temporarily stored in Utrecht. These parcels are sorted the next afternoon and not during night like in Nieuwegein. The distance to Hengelo is too far to get all parcels at depot Hengelo on time for sorting during the night. At depot Hengelo or Nieuwegein the parcels are sorted on customer level, in this case mediumwebshop.nl. All reverse parcels from the Netherlands for mediumwebshop.nl are sorted and placed in containers. Those containers are transported to the warehouse of mediumwebshop.nl.
For some customers, additional steps in the process are requested before the parcels can be loaded in the truck. This does not influence the process choice since those additional handlings are the same in each process.
Figure 8 Reverse process Via Hengelo/Nieuwegein
2.1.2
Cost structure
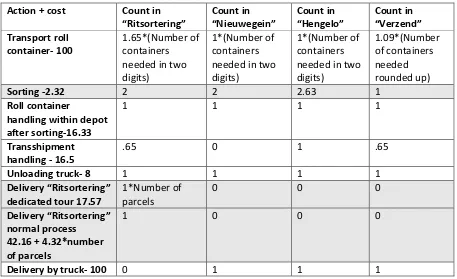
For confidentiality reasons it is not possible to state the exact costs of the process steps. Instead of giving the exact costs, the costs of transport of a roll container is set at 100 and all other costs are valued based on this 100. The three different reverse processes have different cost structures. First the building blocks of the costs are given. Secondly, the costs per reverse process are explained. At the end of this section figures are given of the total reverse costs per transport mode. The costs are computed based on the standard handling times and costs that PostNL uses.
The number of roll containers needed in the transport is estimated based on the average parcel size per customer. Some costs are per parcel and some costs are per roll container, therefore the number of parcels and the average size per parcel is relevant. When costs are per roll container the average parcel size of a customer is used to determine the costs per parcel. If a roll container is dedicated to a specific customer it is not possible to fill the container with other parcels, so the entire container price is attributed to the specific customer.
For transport between depots an average cost per roll container is used. This cost is independent of the fill rate of the roll container since the truck has only limited number of container slots available. In this average cost per roll container the fill rate of trucks is accounted. This cost is set at 100. In the “Hengelo/Nieuwegein” and “Ritsortering” process, parcels for multiple customers are combined to fill roll containers, therefore a fraction of the transport costs of the roll container is used. In the “Verzend” process containers are assigned to customers. Therefore, the number of containers needed for a customer is always rounded up to entire containers for all depots in the Netherlands. Since almost all large reverse customers in this process are in the area of Den Bosch. The average costs of a roll container send to Den Bosch is used instead of the national average of 100. The Den Bosch average is 109.
The sorting costs in the sorting phases are computed per parcel since the time required to handle the parcel is independent of its size since we consider machine enabled parcels. Those costs are based on the average time required to handle a parcel by an employee, those costs are 2.32.
After the sorting is conducted the parcel is placed in a roll container, this roll container is moved to the collection buffer and placed in the trailer. The costs for this handling is 16.33.
If the container is transshipped at a cross dock, the trucks are unloaded, roll containers are placed in a buffer and loaded to another truck. The costs for this transshipment is 16.5.
When the truck arrives at a depot it is unloaded and the roll containers are placed in a buffer. The costs related to these actions are 8.
For customers that are delivered via the “Ritsortering” process, the average costs of the delivery of the parcel are 17.57 when a parcel is delivered via a dedicated tour. This number is based on the average at one depot. When a parcel is delivered via a regular tour than the costs are 42.16+ 4.32*number of parcels for the specific customer.
Action + cost Count in
“Ritsortering”
Count in
“Nieuwegein”
Count in
“Hengelo”
Count in
“Verzend”
Transport roll container- 100
1.65*(Number of containers needed in two digits)
1*(Number of containers needed in two digits)
1*(Number of containers needed in two digits)
1.09*(Number of containers needed rounded up)
Sorting -2.32 2 2 2.63 1
Roll container
handling within depot after sorting-16.33
1 1 1 1
Transshipment handling - 16.5
.65 0 1 .65
Unloading truck- 8 1 1 1 1
Delivery “Ritsortering”
dedicated tour 17.57
1*Number of parcels
0 0 0
Delivery “Ritsortering”
normal process 42.16 + 4.32*number of parcels
1 0 0 0
[image:27.595.70.527.68.347.2]Delivery by truck- 100 0 1 1 1
Table 4 Costs building blocks in process
In the figures below the total costs for 25 and 125 parcels per roll container are given, given a number of parcels for a customer. The blue graphs refer to the “Verzend” process, the red graphs to the Nieuwegein process, green is used for the Hengelo process and in purple the “ritsortering” process is described. A few remarkable characteristics in the graphs are now discussed.
The stairs structure in the “Verzend” process can be explained by the fact that the number of roll containers required is always rounded up. The assumption is made that the parcels are collected equally distributed over all depots and depots+ in the Netherlands.
Figure 9 Total costs 25 parcels per container
Figure 10 Total costs 125 parcels per container
When studying Figure 9 and Figure 10 we can conclude that the “Ritsortering” process has no initial costs, but the marginal costs are high. The “Verzend” process has high initial costs with low marginal costs and the “Nieuwegein” and “Hengelo” process has intermediate initial costs and marginal costs. So, for big customers the “Verzend” process is cost efficient, for small customers the “Ritsortering” process and for the medium sized customers the “Hengelo” and “Nieuwegein” process.
2.1.3
Data analysis
[image:28.595.71.505.290.543.2]In Figure 11 the number of parcels per week are given for the period week 26-2016 until week 36-2017. In the overlapping weeks 26 until 36 the growth in weekly volume is the gap between both graphs. The peak around week 18 can be explained by the payment of first part of the holiday fee in the Netherlands, all employees in the Netherlands have more money to spend. Besides there is Easter, this results in more time for online shopping. Around week 22 the remaining employees in the Netherlands receive the holiday fee. In week 35 the schools start after the holidays, all students order the study books before this moment resulting in a peak in demand. From week 44 on, the beginning of November people in the Netherlands start ordering the Sinterklaas and Christmas presents. Therefore, the number of parcels grow from that moment on towards the real peak just before Sinterklaas and Christmas.
Figure 11 Number of parcels per week
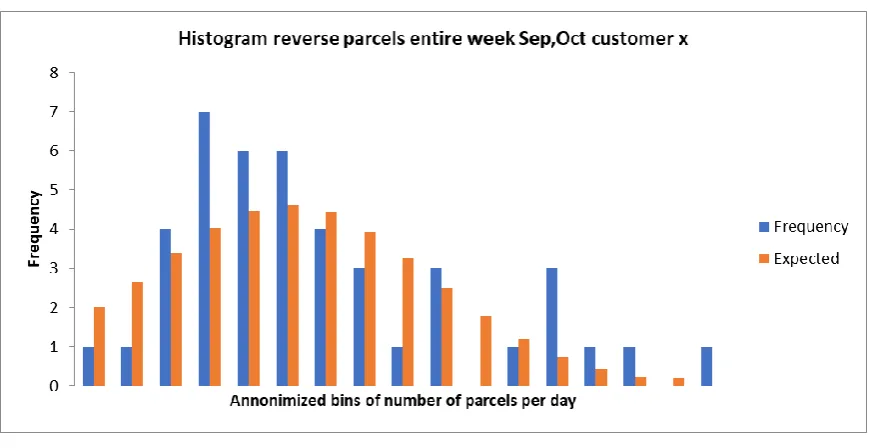
In Figure 12 till Figure 16 data of the number of reverse parcels of two customers of PostNL is given. One is from the fashion segment and the other from the electronics segment. September and October of 2017 are used for the data collection since there are no holidays or other relevant peakdays that disturb the data. Study books are not in the fashion nor electronics segment, therefore the study book peak does not affect the data studied from Customer x and y. A longer time span is not possible since in November the first Sinterklaas shopping is in the data and in the summer months the holidays affect the data majorly. Combining with months earlier in the year might not be useful due to demand increases.
demand is higher than at a Monday. We want to include this effect in our research. The mixed probability distribution we propose to describe the demand is:
𝑃(𝐴) = 0.2 ∗
ϕ
(𝐴|𝜇𝑀𝑜𝑛𝑑𝑎𝑦, 𝜎𝑀𝑜𝑛𝑑𝑎𝑦2 ) + 0.8 ∗ϕ
(𝐴|𝜇𝑅𝑒𝑚𝑎𝑖𝑛𝑖𝑛𝑔 𝑑𝑎𝑦𝑠, 𝜎𝑅𝑒𝑎𝑚𝑖𝑛𝑖𝑛𝑔 𝑑𝑎𝑦𝑠2 ) (i)This mixture of distributions is used to describe the customer demand in the entire week. In words this formula states that the probability of having value A is 0.2 times the probability of having value A, in the distribution at Mondays and 0.8 times the probability of having value A, in the distribution at other days.
For Customer y and Customer x we conducted a Chi-square test to test if we can describe the long-term histogram of demand by the proposed distribution (i). The test statistic of the Chi-square test is 𝜒2 = ∑(𝑂𝑏𝑠𝑒𝑟𝑣𝑒𝑑−𝑒𝑥𝑝𝑒𝑐𝑡𝑒𝑑 )2
𝑒𝑥𝑝𝑒𝑐𝑡𝑒𝑑 . For Customer y we used 20 bins and therefore have 19 degrees of
freedom. For Customer x we used 16 bins and therefore have 15 degrees of freedom.
For Customer y, the test statistic has a value of 44.98 and the 95% chi-square test value is 31.41; therefore, we have to reject the hypothesis that the distribution of the number of reverse parcels can be described by the proposed distribution. When studying Figure 13 we notice one bin with an outlier in the middle of the graph. If we exclude this outlier from the chi-square test, the test statistic has a value of 16.85, which is lower than 31.41. In that case we cannot reject that the distribution of demand for Customer y can be described by the proposed distribution. So, we can describe the histogram over the period of September and October by the proposed distribution for Customer y.
For Customer x, we tested the proposed distribution (i) as well, the test statistic has a value of 10.57, the 95% chi-square test value is 25.0. Therefore, we cannot reject the assumption that the number of reverse parcels for Customer x can be defined by the proposed distribution. Therefore, for Customer x we can use the propose distribution to describe the data as well. So, we can describe the histogram over the period of September and October by the proposed distribution for Customer x.
Besides the chi-square tests for the combination of distributions (i), we conducted the chi-square test to test if we can describe the histogram by a single normal distribution. In this single normal distribution, the mean and standard deviation are used as parameters of the distribution. The number of parcels for Customer y cannot be described by one normal distribution, even when the biggest outlier is excluded from the test.
For Customer x the test statistic resulted in 18.86 which is lower than the chi-square test value at 95% of 25.0. Therefore, for Customer x the histogram of the number of parcels can be described by a single normal distribution and the combination of distributions.
Figure 12 Boxplot reverse parcels Customer y
Figure 15 Histogram reverse parcels Customer x, combination of normal distributions plotted
Figure 16 Histogram reverse parcels Customer x, single normal distribution plotted
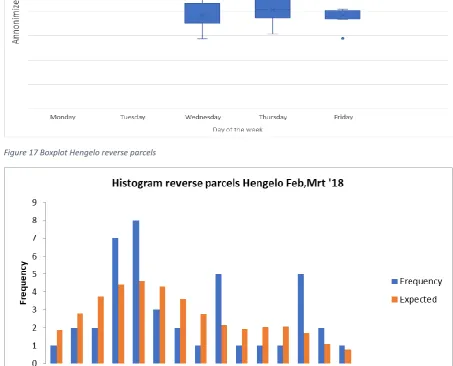
The “Hengelo” process started mid September 2017. In the starting phase, the volume is managed to test the process and train the staff. Therefore, the data about September and October does not describe the reality at this moment. In February and March, the demand is relatively flat as well, as shown in Figure 11. Therefore, for the “Hengelo/Nieuwegein” process those months are studied. The proposed distribution to describe the histogram of the demand per day is the same distribution as the combination of distributions that is proposed for Customer x and Customer y. This distribution is used in the next sections of this research to determine the demand corresponding to a certain service level per customer.
𝑃(𝐴) = 0.2 ∗
ϕ
(𝐴|𝜇𝑀𝑜𝑛𝑑𝑎𝑦, 𝜎𝑀𝑜𝑛𝑑𝑎𝑦2 ) + 0.8 ∗ϕ
(𝐴|𝜇𝑅𝑒𝑚𝑎𝑖𝑛𝑖𝑛𝑔 𝑑𝑎𝑦𝑠, 𝜎𝑅𝑒𝑎𝑚𝑖𝑛𝑖𝑛𝑔 𝑑𝑎𝑦𝑠2 ) (i)reject the hypothesis that we can describe the data by the proposed distribution. Therefore, we tested the normal distribution with a mean and variance of all days. This resulted in a Chi-square value of 20.044 and so we do not reject the hypothesis that we can describe the distribution with a normal distribution. To conclude we can describe the number of parcels per day in Hengelo by a combination of normal distributions. The number of parcels per day in Nieuwegein can be described by a single normal distribution. In Figure 17 until Figure 20 the boxplots and histograms of the reverse process “Hengelo/Nieuwegein” are given.
[image:33.595.72.523.264.536.2]In the analysis of the distribution of the number of parcels, we see that, for individual customers and the reverse process “Hengelo/Nieuwegein”, the number of parcels can be described by a single normal distribution, if the difference between the number of parcels at Monday and the number of parcels at the other days the remaining part of the week is small. When the number of parcels on Mondays is forty percent higher than at the other days, a mixture of distributions is better.
[image:33.595.67.521.365.731.2]Figure 19 Boxplot Nieuwegein reverse parcels
Figure 20 Histogram Nieuwegein reverse parcels
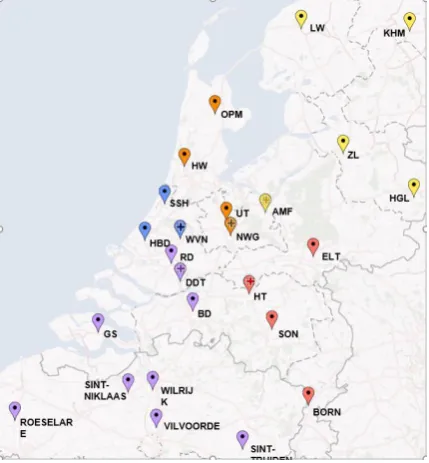
specific zip code. The big circle around Hengelo is for the German customers that have distribution centers in the middle and north of Germany. The big circle around Born is for the customers that have their distribution centers in the south of Germany. If we ignore the German customers, we notice that the majority of the reverse parcels are to be delivered in the southern part of the Netherlands.
Figure 21 Diagram of size of customers
[image:35.595.71.323.413.708.2]2.2
Number of parcels handled via the different reverse processes
In this section the current distribution of the reverse process is investigated. First by an interview with a logistics designer and second using two samples to validate the expert opinion.
The logistics designer of the reverse process of PostNL stated that: “At this moment 60% of the reverse parcels is going via “Verzend”, 30% of the reverse parcels is going via “Hengelo/Nieuwegein”, and 10% of the reverse parcels is going via “Ritsortering”. The current situation is mainly based on capacity
restriction in the reverse process via “Verzend” and via “Ritsortering”.”
It cannot be determined how much reverse parcels are sent via “Ritsortering” based on the available data. Reverse parcels in the “Ritsortering” are sent to normal addresses; small web shops and retailers do not have an “antwoordnummer” and cannot be separated from consumers that order parcels often. To get the exact number of this reverse process for all the addresses of the 660,000 parcels sent, it should be checked if a company is registered at the address. This seems not worthwhile. The volume in “Ritsortering” is relatively low since a lot of the volume in the Netherlands is sold by and returned to the bigger web shops. To validate the opinion of the expert, the data of the first two weeks of February 2018 is analyzed, the results of this analysis are given in Table 5, the third and fourth column.
It is assumed that 10% of the reverse parcels is in the “Ritsortering”, therefore 90% is in the “Verzend” and “Hengelo/Nieuwegein” process. The partial volumes found in the data samples are multiplied with the remaining 90% to come to a sample for all processes. To be able to determine the real situation under the assumption that 10% of the reverse parcels is in the “Ritsortering” process, we multiplied the percentages we found in the samples of February with 90%. These computations are used to create a sample under the assumption. The computations are as follows: 70%*90%=63% and 90%*(15%+16%)/2=13.5% and 90%*(15%+14%)/2=13.5%. Based on Table 5 we can state that the expert has made a good estimate. The distribution in the reverse process between the processes is given in Table 5.
Method/ process
Expert opinion
Sample week 1 February
Sample week 2 February
Sample under assumption
Absolute number of parcels in assumption situation Via
“Verzend”
60% 70% of data
available
70% of data available
63% 44,100
Via Hengelo/ Nieuwegein
15%/15% 15% of data available/15% of data available
16% of data available/14% of data available
13.5%/ 13.5%
9,450/9,450
Via
“Ritsortering”
10% No data available No data available 10% 7,000
Table 5 Distribution of reverse volume
2.3
Number of parcels that can be handled in the current situation of PostNL
The current reverse process of PostNL is divided into three different reverse processes. Those are explained in detail in Section 2.1. To compute the number of parcels that can be handled, per reverse process the capacity is calculated. How this capacity is calculated is explained in this section.
with 19 depots this is 129,200 parcels. One should notice that there is a limited number of container locations available, in this process a customer has a dedicated roll container. All parcels in this process should be delivered to only a limited number of customers. So, the capacity can only be reached if all 129,200 reverse parcels are for a limited number of customers.
In the process via Hengelo/Nieuwegein the bottleneck is the sorting capacity in Hengelo/Nieuwegein. It is assumed that additional transport always can be hired. The storing capacity in Utrecht is way more than required and therefore this is not encountered in computing the capacity per day. The capacity in Hengelo is computed as follows: from 13:00 to 17:00 parcels can be sorted with 5,000 parcels per hour. This results in a total capacity per day of 20,000 parcels. In Nieuwegein the reverse parcels can be sorted from 3.00 AM until 6.00 AM with 8,000 parcels per hour. This results in a maximum capacity of 24,000 parcels per day.
Via “Ritsortering” the capacity in the process is high. The limitation is that there is a priority for the parcels send towards the consumer above the reverse parcels. We assume, based on requirements of PostNL, that at most 2.5% of the available capacity in the “Ritsortering” can be assigned to reverse parcels. The capacity is 700,000*2.5%=17,500
The capacities calculated are given in Table 6.
Process Capacity per day Via “Verzend” 129,200 parcels Via Hengelo 20,000 parcels Via Nieuwegein 24,000 parcels Via “Ritsortering” 17,500 parcels Table 6 Capacity in reverse processes
When studying Table 5 and Table 6, it might seem that there is no problem with the capacity yet. The capacity available per day is at least double the average daily volume, and the expected growth in the next 5 years is estimated at 100%. Nevertheless, there is a problem for PostNL. At peak season the demand is nearly 100% higher than during the normal season. In that situation the capacity available is slightly more than the capacity required. Besides the calculated capacity is the capacity that can be reached in the optimal situation. When the total parcel market is increasing as expected, more capacity is used by the regular process, thereby even less capacity is available for the reverse process. This mainly influences the capacity available in the Hengelo/Nieuwegein process.
2.4
Current way of assigning reverse processes to customers
Several steps are taken in the decision process to decide via which process a customer receives the reverse parcels. These decisions are executed monthly.
form and size, therefore, no decision parameters can be given. The decisions that are made are given in Figure 23.
Figure 23 Decision tree reverse process
2.5
Stakeholder analysis
In this research it is desired that solutions found are acceptable to stakeholders. To be able to do so we need to know what stakeholders are important and what their interests are.
Important stakeholders in this research are the logistics designers of the reverse process, depots, the logistics designer of the regular parcel flow, the control room and customers. The stakeholders that are considered are internal and external stakeholders. Internal stakeholders in this research are logistics designers for the reverse and normal process, depots’ management and the control room management. External stakeholders that are considered in this research are the customers of PostNL. The interests of the mentioned stakeholders are now described.
2.5.1
Logistics designers reverse process
The logistics designers of the reverse process are the problem owners. For them it is most important that the outcomes of this research give them the tools to improve the reverse process of PostNL. A solution that creates the highest additional capacity against the lowest additional costs will have the preference. For the problem owner it is also important that there is support in the organization for the solution. Otherwise it is hard to implement any outcomes.
2.5.2
Depot’ management
For the management of the depots it is important that their job does not get more complicated. Besides, to create support at the depots for a solution it is important that they have the idea to be part of the project. The depot manager and his process managers are responsible for the processes and operations at the depot.
2.5.3
Logistics designers regular parcel flow
2.5.4
Control room management
The control room manages the entire process of PostNL, mainly in the evening and at night. For them it is important that solutions found do not make the overall process more complex. The “regisseur” is the responsible person for the overview of the operations at all depots in the Netherlands and the shared resources they make use of. The “regisseur” is supported by two operators during a work shift.
2.5.5
Customers
The customers of PostNL are not interested in how the process is organized internally. There main interest is to get the parcels back to their warehouses as soon as possible by their favored transport mode. Additional value can be offered to a customer when information about the number and type of reverse parcels is shared.
2.6
Conclusion analysis current situation
3
Literature study
In this chapter the relevant literature is evaluated. The main goal of the literature study is to learn how problems related to the problems at PostNL are solved in literature. The next research questions are used to structure the literature study. In this chapter those research questions are answered.
• 3.1 What can we learn from literature about reverse logistics optimization?
• 3.2 What can we learn from literature about the assignment of customers to processes?
3.1
Literature study reverse logistics
To study what we can learn about reverse logistics optimization, we first study optimization within the hub and spoke network. Thereafter, we look into reverse logistics in ecommerce, after which general reverse logistics models are studied. We conclude this section by answering the research question: What can we learn from literature about reverse logistics optimization?
3.1.1
Optimization in hub and spoke networks
In this section we first focus on research conducted in the hub-and-spoke system in general. Then we study literature regarding the intermodal hub-and-spoke system. We conclude with some statements about the application to the PostNL case.
Research conducted on hub-and-spoke networks mainly focusses on transport optimizations and hub location problems (O’Kelly, 1998) (Serper & Alumur, 2016) (Campbell & O'Kelly, 2012) (Alumur & Kara, 2008). Decisions made in a standard hub and spoke network problem can be divided into strategic and operational decisions. According to Zäpfel & Wasner (2002) strategic decisions in the hub-and-spoke models include: selection of suitable locations, assignment of customers to depots and determination of the routing. Operational decisions include: disposition of the number of trucks for line haul and planning of pick-up/delivery tours. In general, the goal function is to minimize costs.
The assignment of customers to depots is the only decision within the scope of this research, when considering the list of Zäpfel & Wasner (2002). Since the variables in this research are not the same as in the hub-and-spoke network, the hub-and-spoke models are not directly applicable. Nevertheless, it is useful to know how the hub and spoke models are built. The hub and spoke model can be formulated using a variety of mathematical models. Some examples are: path-based mixed-integer linear programming models with four-dimensional variables and origin-based mixed-integer linear programming models with three-dimensional variables (Meng & Wang, 2011).
Meng & Wang (2011) propose an intermodal hub-and-spoke network design for multi-type container transportation. They have extended the hub-and-spoke model with the possibility to have multiple containers during the transport. In the PostNL case, the containers can be defined as a parcel, roll container and truckload. Meng & Wang (2011) propose a mathematical program with equilibrium constraints. With big M constraints they make sure that all depots have transshipment of at least one container type. For each container type, capacity constraints are used to make sure that the capacity is not violated. Binary variables are used to decide if transshipment lines, and thereby container types are used. To solve the problem Meng & Wang (2011) developed a hybrid genetic algorithm.