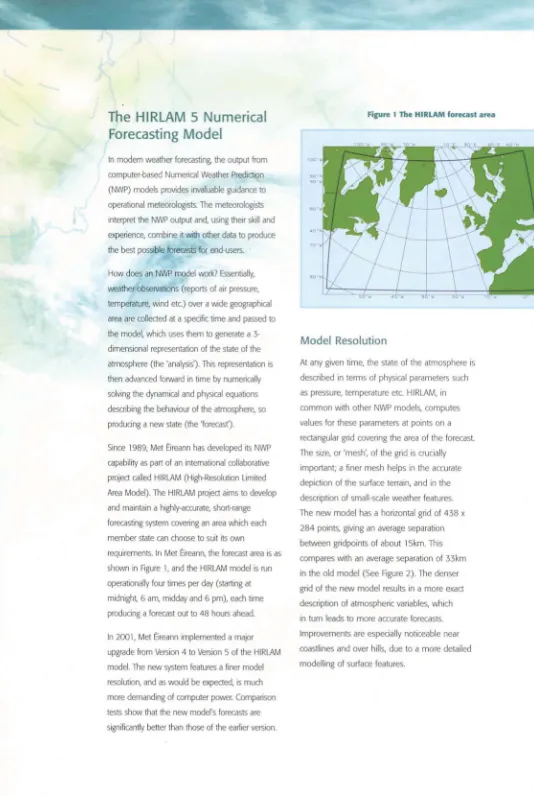
Met Éireann Annual Report 2001
Full text
Figure


Related documents
Images can be shared using a Bluetooth wireless technology connection, MMS, email message, computer file transfer or memory card. Video size (resolution) QVGA 320x240 pixels Frame
With David Gitari (1937–2013) taking over as the Bishop of Mount Kenya East in 1975, after the subdivision of the larger Mount Kenya Diocese, which was all headed by Bishop
Many consumers consider the process of buying insurance to be complex because they are often faced with the daunting task of determining the type of coverage needed and how
ULTRAVIOLET ABSORPTION SPECTRA OF BILE ACIDS IN SERA OF PATIENTS WITH (LEFT) NORMAL SERUM, (CENTER) BILIARY OBSTRUCTION AND (RIGHT) LIVER DAMAGE. centrations of the two patients
The hearing sensitivity of seven big brown bats was measured in active echolocation and passive hearing tasks, before and after exposure to broadband noise spanning their
Determining an effective concentration requires field tests, but multiple studies (Table 1) show that nectar foragers will avoid a wide range of potassium concentrations in sugar
Fig. Experimental design for experiment 3. In a first step, 8 mother colonies were established in the lab and fed ad libitum for 30 days. In the second step, 8 daughter colonies of
Effect of bacteria-free and Pseudomonas -exposed conditions on development at standard and warm temperature for directly developing parthenogenetic eggs and ephippial eggs.
