Original Article
Exploring genes of rectal cancer based on protein
interaction network
Wenjing Teng
1*, Chao Zhou
2*, Fanchen Zhao
1*, Min Chen
1, Zhihong Fang
1, Jianchun Wu
1, Xiaoling Yin
1, Yan
Li
11
Department of Oncology, Shanghai Municipal Hospital of Traditional Chinese Medicine, Affiliated to Shanghai
University of Traditional Chinese Medicine, Shanghai, China;
2Cancer Center, Weifang Traditional Chinese
Hospi-tal, Weifang, Shangdong, China.
*Equal contributors.
Received October 27, 2016; Accepted December 19, 2016; Epub February 15, 2017; Published February 28,
2017
Abstract:
Objective: We have developed a protein-protein interaction network of rectal cancer which is based on
genetic genes, and then predicted biological pathways underlying the molecular complexes in the network. The aim
of this study is to analyze and summarize the genetic markers related to rectal cancer. Methods: The gene
expres-sion profile was downloaded from OMIM (Online Mendelian Inheritance in Man) database; The protein-protein inter
-action network of rectal cancer was established by Cytoscape 3.2; The molecular complexes in the network were
detected by Clusterviz plugin and the pathways enrichment of molecular complexes were performed by DAVID online
and Bingo plugin (The Biological Networks Gene Ontology tool). Results: a total of 127 rectal cancer-related genes
were identified to express differentially in OMIM Database. The protein-protein interaction network of rectal cancer
contained 966 nodes (proteins), 3377 edges (interactive relationships) and 7 molecular complexes (score >7.0).
Regulatory effects of genes and proteins were focused on cell cycle, transcription regulation and cellular protein
metabolic process. Genes such as
DDK1, sparcl1, wisp2, cux1, pabpc1, ptk2
and
htra1
were key nodes in PPI
net-work. The discovery of rectal cancer-related genes has a great significance on exploring mechanism, distinguishing
cancer tissues and exploring new treatments for rectal cancer.
Keywords:
Protein-protein interaction networks, rectal cancer, molecular complexes, pathway, genes
Introduction
Rectal cancer is one of the common fatal
malig-nant tumors in the world, which is secondly
lethal cancer in United States as well as thirdly
in Europe. Despite advances in detection and
care, morbidity and mortality from rectal
can-cer continues to be at high level [1]. Early
detec-tion and diagnosis would be of great
signifi-cance to reduce mortality and improve pro-
gnosis, as well as, identifying those who were
at the highest risk and improving triage would
have the vital impact on rectal cancer. A few
studies have shown that rectal cancer is a
prime paradigm for cancer genetics which can
be prevented by early detection of the
pre-dis-ease (neoplastic) state. Therefore, the roles of
genetics in rectal cancer have been critical to
the missions of disease prevention, early
detec-tion and effective treatment.
As report goes, approximately 10% of well
defined hereditary rectal cancer has special
syndromes [2], such as slow growth, low
poten-tial risk of carcinomas and empowerment to
reduce the disease burden. It is well known that
there are discrepancies in the diagnosis of
gas-trointestinal neoplasia between Western and
Japanese pathologists [3]. So comparing with
other malignant tumor, there will be more
sig-nificant to discover the process of rectal cancer
[4]. Up to now, genetic markers of rectal cancer
can be summarized by the following six aspects:
Genomic instability, CpG island methylator
phe-notype, specific microthe related genes
(specif-ic related genes), proteins and pathways for
hereditary rectal cancer.
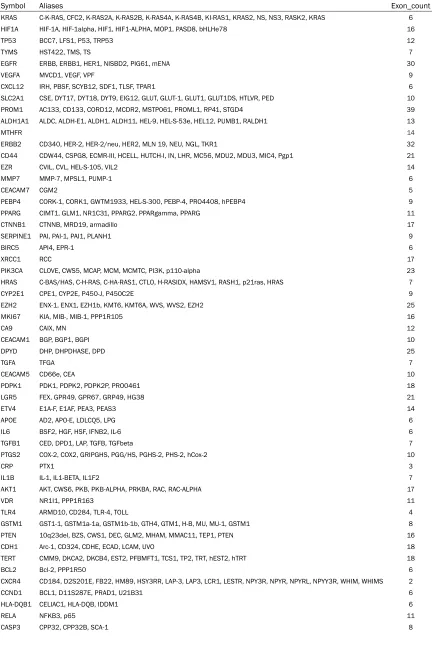
his-Table 1.
The genes related to rectal cancers
Symbol
Aliases
Exon_count
KRAS C-K-RAS, CFC2, K-RAS2A, K-RAS2B, K-RAS4A, K-RAS4B, KI-RAS1, KRAS2, NS, NS3, RASK2, KRAS 6 HIF1A HIF-1A, HIF-1alpha, HIF1, HIF1-ALPHA, MOP1, PASD8, bHLHe78 16
TP53 BCC7, LFS1, P53, TRP53 12
TYMS HST422, TMS, TS 7
EGFR ERBB, ERBB1, HER1, NISBD2, PIG61, mENA 30
VEGFA MVCD1, VEGF, VPF 9
CXCL12 IRH, PBSF, SCYB12, SDF1, TLSF, TPAR1 6 SLC2A1 CSE, DYT17, DYT18, DYT9, EIG12, GLUT, GLUT-1, GLUT1, GLUT1DS, HTLVR, PED 10 PROM1 AC133, CD133, CORD12, MCDR2, MSTP061, PROML1, RP41, STGD4 39 ALDH1A1 ALDC, ALDH-E1, ALDH1, ALDH11, HEL-9, HEL-S-53e, HEL12, PUMB1, RALDH1 13
MTHFR 14
ERBB2 CD340, HER-2, HER-2/neu, HER2, MLN 19, NEU, NGL, TKR1 32 CD44 CDW44, CSPG8, ECMR-III, HCELL, HUTCH-I, IN, LHR, MC56, MDU2, MDU3, MIC4, Pgp1 21
EZR CVIL, CVL, HEL-S-105, VIL2 14
MMP7 MMP-7, MPSL1, PUMP-1 6
CEACAM7 CGM2 5
PEBP4 CORK-1, CORK1, GWTM1933, HEL-S-300, PEBP-4, PRO4408, hPEBP4 9 PPARG CIMT1, GLM1, NR1C31, PPARG2, PPARgamma, PPARG 11
CTNNB1 CTNNB, MRD19, armadillo 17
SERPINE1 PAI, PAI-1, PAI1, PLANH1 9
BIRC5 API4, EPR-1 6
XRCC1 RCC 17
PIK3CA CLOVE, CWS5, MCAP, MCM, MCMTC, PI3K, p110-alpha 23 HRAS C-BAS/HAS, C-H-RAS, C-HA-RAS1, CTLO, H-RASIDX, HAMSV1, RASH1, p21ras, HRAS 7
CYP2E1 CPE1, CYP2E, P450-J, P450C2E 9
EZH2 ENX-1, ENX1, EZH1b, KMT6, KMT6A, WVS, WVS2, EZH2 25
MKI67 KIA, MIB-, MIB-1, PPP1R105 16
CA9 CAIX, MN 12
CEACAM1 BGP, BGP1, BGPI 10
DPYD DHP, DHPDHASE, DPD 25
TGFA TFGA 7
CEACAM5 CD66e, CEA 10
PDPK1 PDK1, PDPK2, PDPK2P, PRO0461 18
LGR5 FEX, GPR49, GPR67, GRP49, HG38 21
ETV4 E1A-F, E1AF, PEA3, PEAS3 14
APOE AD2, APO-E, LDLCQ5, LPG 6
IL6 BSF2, HGF, HSF, IFNB2, IL-6 6
TGFB1 CED, DPD1, LAP, TGFB, TGFbeta 7
PTGS2 COX-2, COX2, GRIPGHS, PGG/HS, PGHS-2, PHS-2, hCox-2 10
CRP PTX1 3
IL1B IL-1, IL1-BETA, IL1F2 7
AKT1 AKT, CWS6, PKB, PKB-ALPHA, PRKBA, RAC, RAC-ALPHA 17
VDR NR1I1, PPP1R163 11
TLR4 ARMD10, CD284, TLR-4, TOLL 4
GSTM1 GST1-1, GSTM1a-1a, GSTM1b-1b, GTH4, GTM1, H-B, MU, MU-1, GSTM1 8 PTEN 10q23del, BZS, CWS1, DEC, GLM2, MHAM, MMAC11, TEP1, PTEN 16 CDH1 Arc-1, CD324, CDHE, ECAD, LCAM, UVO 18 TERT CMM9, DKCA2, DKCB4, EST2, PFBMFT1, TCS1, TP2, TRT, hEST2, hTRT 18
BCL2 Bcl-2, PPP1R50 6
CXCR4 CD184, D2S201E, FB22, HM89, HSY3RR, LAP-3, LAP3, LCR1, LESTR, NPY3R, NPYR, NPYRL, NPYY3R, WHIM, WHIMS 2
CCND1 BCL1, D11S287E, PRAD1, U21B31 6
HLA-DQB1 CELIAC1, HLA-DQB, IDDM1 6
RELA NFKB3, p65 11
[image:2.612.92.524.86.735.2]HLA-G MHC-G 8 MAPK3 ERK-1, ERK1, ERT2, HS44KDAP, HUMKER1A, P44ERK1, P44MAPK, PRKM3, p44-ERK1, p44-MAPK 10
MMP1 CLG, CLGN 10
APC BTPS2, DP2, DP2.5, DP3, GS, PPP1R46 18 CYP19A1 ARO, ARO1, CPV1, CYAR, CYP19, CYPXIX, P-450AROM 13 ERCC2 COFS2, EM9, TFIIH, TTD, TTD1, XPD 24
TCF7L2 TCF-4, TCF4 21
F3 CD142, TF, TFA 6
TP73 P73 17
LCN2 24p3, MSFI, NGAL 7
RUNX1 AML1, AML1-EVI-1, AMLCR1, CBF2alpha, CBFA2, EVI-1, PEBP2aB, PEBP2alpha 13 FGFR2 BBDS, BEK, BFR-1, CD332, CEK3, CFD1, ECT1, JWS, K-SAM, KGFR, TK14, TK25 23 CHEK2 CDS1, CHK2, HuCds1, LFS2, PP1425, RAD53, hCds1 22 PLAU ATF, BDPLT5, QPD, UPA, URK, u-PA 12
TIMP1 CLGI, EPA, EPO, HCI, TIMP 6
RAD51 BRCC5, FANCR, HRAD51, HsRad51, HsT16930, MRMV2A, RECA, RAD51 13
PLK1 PLK, STPK13 10
POU5F1 OCT3, OCT4, OTF-3, OTF3, OTF4, Oct-3, Oct-4 6
XRCC3 CMM6 10
SOX2 ANOP3, MCOPS3 1
PDGFRB CD140B, IBGC4, IMF1, JTK12, PDGFR, PDGFR-1, PDGFR1 26
STK11 LKB1, PJS, hLKB1 13
DKK1 DKK-1, SK 4
EPAS1 ECYT4, HIF2A, HLF, MOP2, PASD2, bHLHe73 17 CFLAR CASH, CASP8AP1, CLARP, Casper, FLAME, FLAME-1, FLAME1, FLIP, I-FLICE, MRIT, c-FLIP, c-FLIPL, c-FLIPR, c-FLIPS 14
FOS AP-1, C-FOS, p55 4
SKP2 FBL1, FBXL1, FLB1, p45 12
NRAS ALPS4, CMNS, N-ras, NCMS1, NS6, NRAS 7
CCNE1 CCNE, pCCNE1 12
IL23R 14
PPARD FAAR, NR1C2, NUC1, NUCI, NUCII, PPARB 11 RPS6KB1 PS6K, S6K, S6K-beta-1, S6K1, STK14A, p70 S6KA, p70(S6K)-alpha, p70-S6K, p70-alpha 19
ANXA1 ANX1, LPC1 15
PTGS1 COX1, COX3, PCOX1, PES-1, PGG/HS, PGHS-1, PGHS1, PHS1, PTGHS 13
BLM BS, RECQ2, RECQL2, RECQL3 25
CD163 M130, MM130 17
SPINK1 PCTT, PSTI, Spink3, TATI, TCP 5
CLDN1 CLD1, ILVASC, SEMP1 4
PDCD4 H731 13
IFNGR1 CD119, IFNGR, IMD27A, IMD27B 9
IL24 C49A, FISP, IL10B, MDA7, MOB5, ST16 7
ABCC4 MOAT-B, MOATB, MRP4 35
ALOX12 12-LOX, 12S-LOX, LOG12 14
BIRC7 KIAP, LIVIN, ML-IAP, MLIAP, RNF50 7
SATB1 16
TFF3 ITF, P1B, TFI 3
CSF3R CD114, GCSFR 18
RBL2 P130, Rb2 25
RPS6KA1 HU-1, MAPKAPK1A, RSK, RSK1, p90Rsk 26
FIGF VEGF-D, VEGFD 7
TPSAB1 TPS1, TPS2, TPSB1 6
GSK3A 11
ABCC3 ABC31, EST90757, MLP2, MOAT-D, MRP3, cMOAT2 32
MIR137 MIRN137, miR-137 1
TAZ BTHS, CMD3A, EFE, EFE2, G4.5, LVNCX, Taz1 11 UGT2B15 HLUG4, UDPGT 2B8, UDPGT2B15, UDPGTH3, UGT2B8 6
tone modification, gene mutation and protein
biomarkers. The protein-protein interaction
network, which is a model of biological
molecu-lar interactions, can more clearly show the
genes, proteins and pathogenesis in the
devel-opment process of the disease [5]. These ge-
netic traits may partially explain the
geographi-cal variance in rectal cancer incidence and
mortality as well as the differences between
hereditary and sporadic rectal cancer [6].
Materials and methods
Methods
OMIM (Online Mendelian Inheritance in Man) is
a comprehensive, authoritative, daily updated
human phenotype database, containing more
than 12000 genes of all human genetic
diseas-es, and mainly focusing on hereditary diseases.
In addition, text messages, related reference
information, sequence records, maps, and re-
lated databases are available for each gene [7,
8]. This study started from August 22 (2015),
searched “rectal cancer” in the OMIM
data-base and obtained human genes associated
with rectal cancer information. The
construc-tion of gene/protein interacconstruc-tion networks: Re-
ctal cancer associated genes were submitted
to Cytoscape 3.2.1 plugin Agilent Literature
Search 2.8 (USA Agilent Technologies
compa-ny) and Pubmed [9]. False positive interaction
information was removed from retrieval results.
Then, gene/protein interaction relations were
read in Cytoscape 3.2.1 and visualized [10].
MODE algorithm in Cytoscape 3.2.1 web
ana-lytics plugin Clusterviz of 1.2 was
administrat-ed to make the correlation analysis for the area
of the construction of biological networks [11,
12]. By analyzing the network structure,
pro-teins were grouped to form molecular
com-pounds in the entire network and shown in
Cytoscape according to the correlation integral
value. The areas with integral values higher
than 3 were regarded as molecular compounds.
The gene/protein names contained in the mo-
lecular compounds were submitted to The Da-
tabase for Annotation, Visualization and Inte-
grated Discovery [13, 14]. By retrieving Kyoko
Encyclopedia of Genes and Genomes (KEGG)
Database, biological pathways involved in
chronic myelogenous leukaemia heredity were
identified. Then the Biological pathways data
were submitted to Bingo (in Networks Gene
Ontology tool) for enrichment analysis.
Protein networks were constructed based on
the rectal cancer-related genes, nodes
(pro-teins) and edges (interaction between),
molecu-lar complexes in the network and its associated
interaction points and nodes (protein) and the
edge (interaction between), analyze the
biologi-cal pathways has involved in the molecular
complexes.
Results
Rectal cancer related genes in OMIM
According the OMIM database retrieval, it can
found that 127 genes were reported to be
associated with rectal cancer. After screening
and deleting duplicate genes, 127 related
genes were identified, which were shown in
Table 1
.
REG4 GISP, REG-IV, RELP 7
WISP1 CCN4c, WISP1i, WISP1tc, WISP1 6
ASNS ASNSD, TS11 15
UMPS OPRT 7
F2RL2 PAR-3, PAR3 2
LIMS1 PINCH, PINCH-1, PINCH1 16
MUC6 MUC-6 33
RSF1 HBXAP, RSF-1, XAP8, p325 16
MYCL L-Myc, LMYC1, bHLHe38, MYCL 2
RPS6KB2 KLS, P70-beta, P70-beta-1, P70-beta-2, S6K-beta2, S6K2, SRK, STK14B, p70(S6K)-beta, p70S6Kb 16
RNF7 CKBBP1, ROC2, SAG 4
RPS6KA2 HU-2, MAPKAPK1C, RSK, RSK3, S6K-alpha, S6K-alpha2, p90-RSK3, pp90RSK3 26
SPARCL1 MAST 9, MAST9, PIG33, SC1 14
SPEN HIAA0929, MINT, RBM15C, SHARP 15
SEMA4C M-SEMA-F, SEMACL1, SEMAF, SEMAI 19
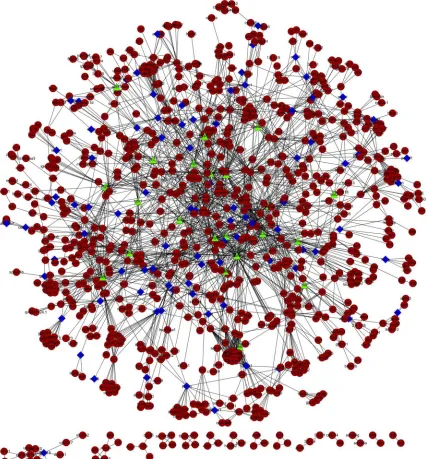
Through text mining, 127 genetic-related genes
shown that there was a network diagram with
996 nodes (proteins), 3377 edges
(interac-tions). As shown in
Figures 1
-
3
, the diamond is
represented OMIM genetic disease related
pro-teins, while the round represented the proteins
obtained from text mining. As shown in
Figure
1
, the protein-protein interaction network of
rectal cancer is extremely complex. The edges
intersect with each other and several clusters
emerge in the figure. The more edges among
the genes, the correlation of the genes is more
tightening. So the genes formed the round
net-work at the top of
Figure 1
connected with
each other more tightly than the genes in the
bottom.
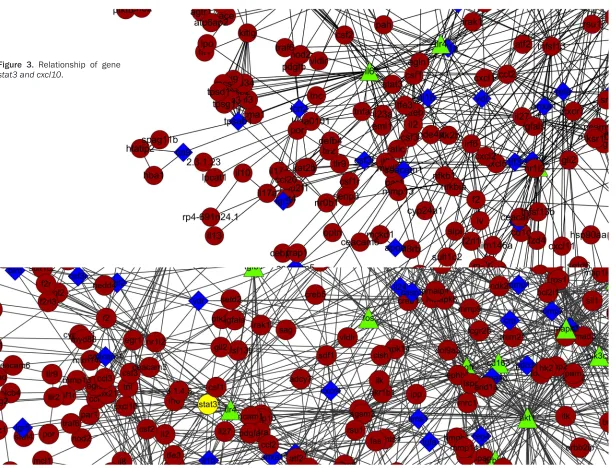
[image:5.612.94.521.75.534.2]After removing the protein molecule in the
work, the relationship between proteins in
net-work became more clear, in the centre part of
protein-protein network, the relationship bet-
ween protein complexes emerged closer,
how-ever, at the farther edge of the network, the
relationship of them became looser, as shown
in
Figure 2
. As shown in
Figure 3
, some
com-mon genes and pathways such as jak2-stat1,
Kras, P53, etc as well as the genes associated
with them were found.
Network topology attribute analysis
Network topology attribute analysis has shown
that the connectivity of nodes in the network
(the number of nodes in the network) obeys
descending distribution, i.e. with the increase
of edges connected to the node,
correspond-ingly the number of nodes decrease, so it can
be seen that the gene-protein interaction
net-works are scale-free netnet-works [15]. We found
that the connectivity of nodes in the network
greater than or equal to 25 corresponds to a
sharp reduction in the number of nodes
Figure
4
. Therefore, we regarded the nodes which the
connectivity is greater than/equal to 20 as the
key nodes (hub). Key nodes (connectivity score)
included: Hif1a (25), cdkn1b (25), rb1 (26), plau
(26), brca1 (27), asns (28), pcna (28), Vegfa
(29), stat1 (29), cdkn2a (29), egfr (30), tp53
(71). (The horizontal axis represents between
nodes, and the ordinate represents the
con-nectivity degree of protein interaction network.
And the graphic in the table represents each
node in the network). It can be seen that the
connectivity (the number of nodes in the
net-work) of nodes in the network obeys
[image:6.612.91.520.74.542.2]Figure 3.
Relationship of gene
ing distribution, while the connectivity is
great-er than/equal to 25, the numbgreat-er of nodes
corresponding to a sharp decrease.
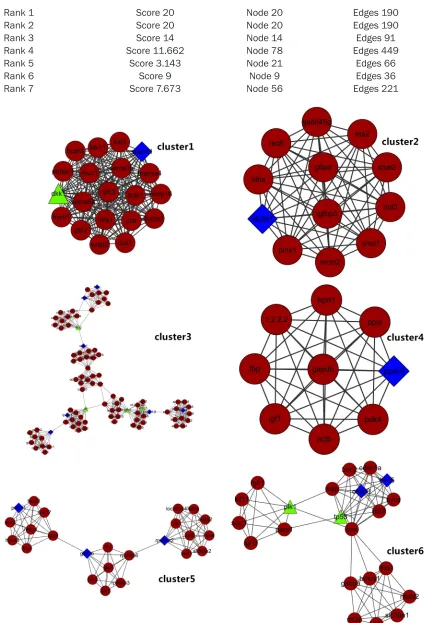
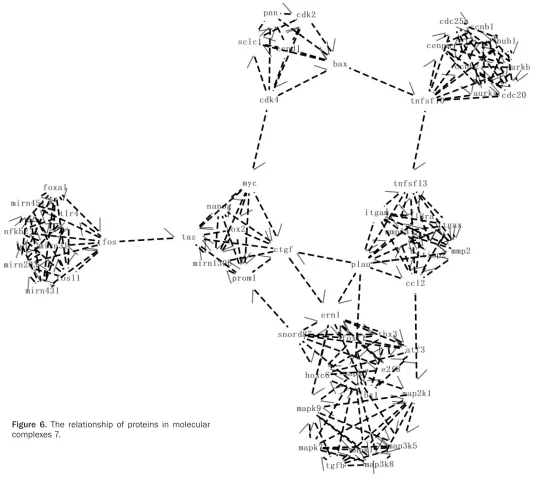
The detection of molecular complexes
According MCOMD algorithm analysis, analyze
the correlation between genes in network and
calculate the score, the number of nodes, the
number of edges. There is a total of 74
molecu-lar complexes and 7 of them showed
correla-tion integral values higher than 7.0 (
Figure 5
).
The details of the relationship of proteins in
molecular complexes 7 were shown in
Figure 6
.
The whole network has a total of six parts,
including mitogen-activated protein kinase,
Specific microRNAs, SRY-related HMG-box,
matrix metalloproteinases, cyclin D.
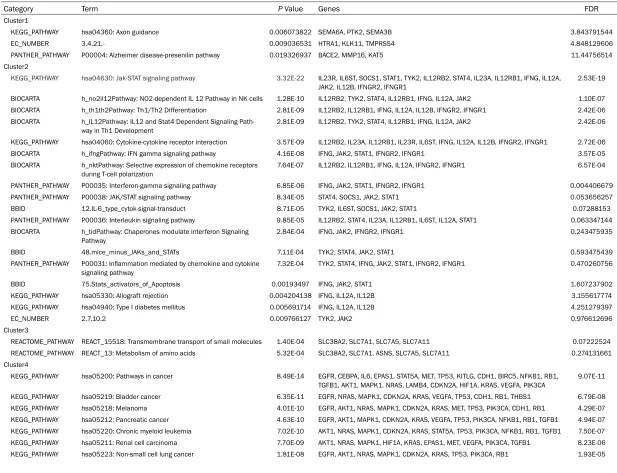
Molecular complex pathway enrichment
Submit the genes of the protein complexes
online to obtain the relevant pathways, and the
result was shown in
Table 2
. We can see that
the biological pathways of protein complexes 1
didn’t exist, and other complexes contained
dif-ferent pathways. Regulatory effects of genes
and proteins mainly focused on cell cycle,
tran-scription regulation, and cellular protein
meta-bolic process.
Bingo results have shown the gene oncology
hierarchical network to the biological
process-es (
Figure 7
). The size of the node represents
the number of the genes, the depth of the node
color represents the
P
values. Diagrams have
presented the main biological processes of
cluster1, 4, 6, 7 containing metabolic
regula-tion, transcriptional regularegula-tion, biosynthesis,
cell differentiation and gene expression
regula-tion and signal transducregula-tion, etc.
Discussions
Based on a large number of research
referenc-es, the progression of rectal cancer is a
[image:8.612.95.522.80.427.2]Rank 1
Score 20
Node 20
Edges 190
Rank 2
Score 20
Node 20
Edges 190
Rank 3
Score 14
Node 14
Edges 91
Rank 4
Score 11.662
Node 78
Edges 449
Rank 5
Score 3.143
Node 21
Edges 66
Rank 6
Score 9
Node 9
Edges 36
[image:9.612.89.518.66.689.2]Rank 7
Score 7.673
Node 56
Edges 221
Table 2.
Enrichment of pathways related to molecular complexes
Category
Term
P Value
Genes
FDR
Cluster1
KEGG_PATHWAY hsa04360: Axon guidance 0.006073822 SEMA6A, PTK2, SEMA3B 3.843791544 EC_NUMBER 3.4.21.- 0.009036531 HTRA1, KLK11, TMPRSS4 4.848129606 PANTHER_PATHWAY P00004: Alzheimer disease-presenilin pathway 0.019326937 BACE2, MMP16, KAT5 11.44756514 Cluster2
KEGG_PATHWAY hsa04630: Jak-STAT signaling pathway 3.32E-22 IL23R, IL6ST, SOCS1, STAT1, TYK2, IL12RB2, STAT4, IL23A, IL12RB1, IFNG, IL12A, JAK2, IL12B, IFNGR2, IFNGR1
2.53E-19 BIOCARTA h_no2il12Pathway: NO2-dependent IL 12 Pathway in NK cells 1.28E-10 IL12RB2, TYK2, STAT4, IL12RB1, IFNG, IL12A, JAK2 1.10E-07 BIOCARTA h_th1th2Pathway: Th1/Th2 Differentiation 2.81E-09 IL12RB2, IL12RB1, IFNG, IL12A, IL12B, IFNGR2, IFNGR1 2.42E-06 BIOCARTA h_IL12Pathway: IL12 and Stat4 Dependent Signaling
Path-way in Th1 Development
2.81E-09 IL12RB2, TYK2, STAT4, IL12RB1, IFNG, IL12A, JAK2 2.42E-06 KEGG_PATHWAY hsa04060: Cytokine-cytokine receptor interaction 3.57E-09 IL12RB2, IL23A, IL12RB1, IL23R, IL6ST, IFNG, IL12A, IL12B, IFNGR2, IFNGR1 2.72E-06 BIOCARTA h_ifngPathway: IFN gamma signaling pathway 4.16E-08 IFNG, JAK2, STAT1, IFNGR2, IFNGR1 3.57E-05 BIOCARTA h_nktPathway: Selective expression of chemokine receptors
during T-cell polarization 7.64E-07 IL12RB2, IL12RB1, IFNG, IL12A, IFNGR2, IFNGR1 6.57E-04 PANTHER_PATHWAY P00035: Interferon-gamma signaling pathway 6.85E-06 IFNG, JAK2, STAT1, IFNGR2, IFNGR1 0.004406679 PANTHER_PATHWAY P00038: JAK/STAT signaling pathway 8.34E-05 STAT4, SOCS1, JAK2, STAT1 0.053656257 BBID 12.IL-6_type_cytok-signal-transduct 8.71E-05 TYK2, IL6ST, SOCS1, JAK2, STAT1 0.07288153 PANTHER_PATHWAY P00036: Interleukin signaling pathway 9.85E-05 IL12RB2, STAT4, IL23A, IL12RB1, IL6ST, IL12A, STAT1 0.063347144 BIOCARTA h_tidPathway: Chaperones modulate interferon Signaling
Pathway
2.84E-04 IFNG, JAK2, IFNGR2, IFNGR1 0.243475935 BBID 48.mice_minus_JAKs_and_STATs 7.11E-04 TYK2, STAT4, JAK2, STAT1 0.593475439 PANTHER_PATHWAY P00031: Inflammation mediated by chemokine and cytokine
signaling pathway
7.32E-04 TYK2, STAT4, IFNG, JAK2, STAT1, IFNGR2, IFNGR1 0.470260756 BBID 75.Stats_activators_of_Apoptosis 0.00193497 IFNG, JAK2, STAT1 1.607237902 KEGG_PATHWAY hsa05330: Allograft rejection 0.004204138 IFNG, IL12A, IL12B 3.155617774 KEGG_PATHWAY hsa04940: Type I diabetes mellitus 0.005691714 IFNG, IL12A, IL12B 4.251279397 EC_NUMBER 2.7.10.2 0.009766127 TYK2, JAK2 0.976612696 Cluster3
REACTOME_PATHWAY REACT_15518: Transmembrane transport of small molecules 1.40E-04 SLC38A2, SLC7A1, SLC7A5, SLC7A11 0.07222524 REACTOME_PATHWAY REACT_13: Metabolism of amino acids 5.32E-04 SLC38A2, SLC7A1, ASNS, SLC7A5, SLC7A11 0.274131661 Cluster4
KEGG_PATHWAY hsa05200: Pathways in cancer 8.49E-14 EGFR, CEBPA, IL6, EPAS1, STAT5A, MET, TP53, KITLG, CDH1, BIRC5, NFKB1, RB1, TGFB1, AKT1, MAPK1, NRAS, LAMB4, CDKN2A, HIF1A, KRAS, VEGFA, PIK3CA
KEGG_PATHWAY hsa05214: Glioma 6.34E-08 EGFR, AKT1, NRAS, MAPK1, CDKN2A, KRAS, TP53, PIK3CA, RB1 6.78E-05 PANTHER_PATHWAY P04398: p53 pathway feedback loops 2 2.17E-07 AKT1, NRAS, CDKN2A, KRAS, MAPK14, TP53, PIK3CA, RB1, TP73 1.98E-04 KEGG_PATHWAY hsa05213: Endometrial cancer 3.04E-07 EGFR, AKT1, NRAS, MAPK1, KRAS, TP53, PIK3CA, CDH1 3.25E-04 KEGG_PATHWAY hsa05210: Colorectal cancer 6.20E-07 EGFR, AKT1, MAPK1, KRAS, MET, TP53, PIK3CA, BIRC5, TGFB1 6.62E-04 KEGG_PATHWAY hsa05221: Acute myeloid leukemia 6.57E-07 CEBPA, AKT1, NRAS, MAPK1, KRAS, STAT5A, PIK3CA, NFKB1 7.01E-04 KEGG_PATHWAY hsa05215: Prostate cancer 9.71E-07 EGFR, AKT1, NRAS, MAPK1, KRAS, TP53, PIK3CA, NFKB1, RB1 0.001037757 KEGG_PATHWAY hsa04722: Neurotrophin signaling pathway 1.17E-06 AKT1, NRAS, MAPK1, BDNF, KRAS, MAPK14, TP53, PIK3CA, NFKB1, TP73 0.00125362 KEGG_PATHWAY hsa04010: MAPK signaling pathway 2.69E-06 EGFR, AKT1, MAPK1, NRAS, BDNF, KRAS, ARRB2, MAPK14, GADD45G, TP53,
NFKB1, TGFB1, RASA1 0.002871532 BIOCARTA h_erythPathway: Erythrocyte Differentiation Pathway 3.22E-06 IL3, IL6, IL9, KITLG, TGFB1, EPO 0.003887971 REACTOME_PATHWAY REACT_16888: Signaling by PDGF 9.59E-06 NRAS, MAPK1, KRAS, STAT5A, PIK3CA, THBS1, RASA1 0.007693883 PANTHER_PATHWAY P00056: VEGF signaling pathway 1.68E-05 AKT1, NRAS, MAPK1, HIF1A, KRAS, MAPK14, VEGFA, PIK3CA 0.015328038 EC_NUMBER 3.4.21.59 4.75E-05 TPSAB1, TPSB2, TPSD1, TPSG1 0.030526793 KEGG_PATHWAY hsa04370: VEGF signaling pathway 4.94E-05 AKT1, NRAS, MAPK1, KRAS, MAPK14, VEGFA, PIK3CA 0.052708911 REACTOME_PATHWAY REACT_11061: Signalling by NGF 5.63E-05 AKT1, MAG, NRAS, MAPK1, KRAS, MAPK14, PIK3CA, NFKB1, SORCS3 0.045131702 KEGG_PATHWAY hsa04664: Fc epsilon RI signaling pathway 6.17E-05 AKT1, NRAS, MAPK1, IL3, KRAS, MAPK14, PIK3CA 0.065876411 KEGG_PATHWAY hsa04150: mTOR signaling pathway 9.18E-05 AKT1, MAPK1, HIF1A, STK11, VEGFA, PIK3CA 0.097993218 PANTHER_PATHWAY P00005: Angiogenesis 9.21E-05 AKT1, NRAS, MAPK1, NOTCH1, HIF1A, KRAS, MAPK14, VEGFA, PIK3CA, BIRC5,
RASA1 0.084242254
PANTHER_PATHWAY P00018: EGF receptor signaling pathway 1.11E-04 EGFR, AKT1, NRAS, MAPK1, KRAS, MAPK14, STAT5A, PIK3CA, RASA1 0.101309728 KEGG_PATHWAY hsa04012: ErbB signaling pathway 1.14E-04 EGFR, AKT1, NRAS, MAPK1, KRAS, STAT5A, PIK3CA 0.121813791 KEGG_PATHWAY hsa05216: Thyroid cancer 1.18E-04 NRAS, MAPK1, KRAS, TP53, CDH1 0.126019896 BIOCARTA h_hcmvPathway: Human Cytomegalovirus and Map Kinase
Pathways
1.34E-04 AKT1, MAPK1, MAPK14, NFKB1, RB1 0.161807042 KEGG_PATHWAY hsa04115: p53 signaling pathway 3.30E-04 CDKN2A, GADD45G, RPRM, TP53, THBS1, TP73 0.352478227 KEGG_PATHWAY hsa04660: T cell receptor signaling pathway 3.75E-04 AKT1, NRAS, MAPK1, KRAS, MAPK14, PIK3CA, NFKB1 0.399792892 BIOCARTA h_telPathway: Telomeres, Telomerase, Cellular Aging, and
Immortality
3.86E-04 EGFR, AKT1, KRAS, TP53, RB1 0.465899729 PANTHER_PATHWAY P04393: Ras Pathway 3.87E-04 AKT1, NRAS, MAPK1, CDKN2A, KRAS, MAPK14, PIK3CA 0.353518988 REACTOME_PATHWAY REACT_9417: Signaling by EGFR 5.16E-04 EGFR, NRAS, MAPK1, KRAS, PIK3CA 0.413199584 KEGG_PATHWAY hsa04662: B cell receptor signaling pathway 5.22E-04 AKT1, NRAS, MAPK1, KRAS, PIK3CA, NFKB1 0.556225736 KEGG_PATHWAY hsa05222: Small cell lung cancer 8.79E-04 AKT1, LAMB4, TP53, PIK3CA, NFKB1, RB1 0.934847379 BIOCARTA h_RacCycDPathway: Influence of Ras and Rho proteins on G1
to S Transition
KEGG_PATHWAY hsa04630: Jak-STAT signaling pathway 0.002487246 AKT1, IL3, IL6, STAT5A, IL9, PIK3CA, EPO 2.62539532 PANTHER_PATHWAY P00021: FGF signaling pathway 0.003144809 AKT1, NRAS, MAPK1, KRAS, MAPK14, PIK3CA, RASA1 2.840604013 BIOCARTA h_il17Pathway: IL 17 Signaling Pathway 0.003157025 IL3, IL6, CD34, KITLG 3.750040719 BIOCARTA h_stemPathway: Regulation of hematopoiesis by cytokines 0.003157025 IL3, IL6, IL9, EPO 3.750040719 PANTHER_PATHWAY P04397: p53 pathway by glucose deprivation 0.003458487 AKT1, STK11, TP53, TP73 3.119958155 REACTOME_PATHWAY REACT_498: Signaling by Insulin receptor 0.003756119 NRAS, MAPK1, KRAS, PIK3CA 2.973670175 KEGG_PATHWAY hsa04110: Cell cycle 0.005068716 CDKN2A, GADD45G, PCNA, TP53, RB1, TGFB1 5.284031958 BIOCARTA h_badPathway: Regulation of BAD phosphorylation 0.005426648 AKT1, MAPK1, IL3, KITLG 6.365799458 BIOCARTA h_crebPathway: Transcription factor CREB and its
extracel-lular signals
0.005426648 AKT1, MAPK1, MAPK14, PIK3CA 6.365799458 KEGG_PATHWAY hsa04062: Chemokine signaling pathway 0.006278908 AKT1, NRAS, MAPK1, KRAS, ARRB2, PIK3CA, NFKB1 6.507599178 BIOCARTA h_keratinocytePathway: Keratinocyte Differentiation 0.006958557 EGFR, CEBPA, MAPK1, MAPK14, NFKB1 8.094303481 KEGG_PATHWAY hsa04914: Progesterone-mediated oocyte maturation 0.007248802 AKT1, MAPK1, KRAS, MAPK14, PIK3CA 7.477850945 KEGG_PATHWAY hsa04640: Hematopoietic cell lineage 0.007248802 IL3, IL6, CD34, KITLG, EPO 7.477850945 KEGG_PATHWAY hsa04210: Apoptosis 0.007548465 AKT1, IL3, TP53, PIK3CA, NFKB1 7.7757735 PANTHER_PATHWAY P00036: Interleukin signaling pathway 0.007614161 AKT1, NRAS, MAPK1, IL6, KRAS, STAT5A, PIK3CA, RASA1 6.753977015 REACTOME_PATHWAY REACT_216: DNA Repair 0.009001 MGMT, PCNA, XRCC1, ERCC1, ERCC2 6.996374809 PANTHER_PATHWAY P00053: T cell activation 0.009738791 AKT1, NRAS, MAPK1, KRAS, PIK3CA, NFKB1 8.564577054 Cluster5
KEGG_PATHWAY hsa04120: Ubiquitin mediated proteolysis 6.19E-04 ANAPC1, RNF7, HUWE1, PARK2 0.370875716 EC_NUMBER 6.3.2.- 0.069187942 HUWE1, PARK2 14.94398228 Cluster6
REACTOME_PATHWAY REACT_1698: Metablism of nucleotides 5.07E-04 UMPS, ATIC, HPRT1 NaN KEGG_PATHWAY hsa00983: Drug metabolism 0.001025542 ITPA, UMPS, HPRT1 0.657964401 BIOCARTA h_mapkPathway: MAPKinase Signaling Pathway 0.00306271 MAP3K9, MAP2K4, MAP3K10 2.110065352 PANTHER_PATHWAY P05918: p38 MAPK pathway 0.005195037 MAP3K9, MAP2K4, MAP3K10 3.701051163 KEGG_PATHWAY hsa00230: Purine metabolism 0.012459659 ITPA, ATIC, HPRT1 7.749728301 EC_NUMBER 2.7.11.25 0.030208436 MAP3K9, MAP3K10 16.18260742 KEGG_PATHWAY hsa00860: Porphyrin and chlorophyll metabolism 0.038330298 COX10, COX15 22.23317069 PANTHER_PATHWAY P00029: Huntington disease 0.04121774 MAP3K9, MAP2K4, MAP3K10 26.27015356 BIOCARTA h_p38mapkPathway: p38 MAPK Signaling Pathway 0.045417275 MAP3K9, MAP2K4 27.61443797 BBID 100.MAPK_signaling_cascades 0.058659218 MAP2K4, MAP3K10 17.32821753 Cluster7
KEGG_PATHWAY hsa04914: Progesterone-mediated oocyte maturation 2.08E-08 CCNB1, CCNB2, MAP2K1, MAPK3, BUB1, MAPK9, MAPK11, CDC25C, CDK2 2.13E-05 KEGG_PATHWAY hsa04114: Oocyte meiosis 1.46E-07 CCNB1, CCNB2, MAP2K1, MAPK3, BUB1, CDC20, AURKA, CDC25C, CDK2 1.50E-04 KEGG_PATHWAY hsa04110: Cell cycle 3.96E-07 CCNB1, CCND1, CCNB2, BUB1, CDC20, CDK4, CDC25C, MYC, CDK2 4.05E-04 KEGG_PATHWAY hsa05219: Bladder cancer 3.68E-06 CCND1, MAP2K1, MAPK3, CDK4, MYC, MMP2 0.00376453 KEGG_PATHWAY hsa05210: Colorectal cancer 7.34E-06 FOS, CCND1, MAP2K1, BAX, MAPK3, MAPK9, MYC 0.007502731 KEGG_PATHWAY hsa05200: Pathways in cancer 1.02E-05 FOS, CCND1, MAP2K1, BAX, MAPK3, MAPK9, NFKB2, CDK4, MYC, MMP2, CDK2 0.010452597 KEGG_PATHWAY hsa04010: MAPK signaling pathway 1.43E-05 FOS, MAP3K5, MAP2K1, MAPK3, MAP3K8, MAPK9, MAPK11, NFKB2, MAPK7,
MYC
REACTOME_PATHWAY REACT_152: Cell Cycle, Mitotic 1.79E-05 CCNB1, CENPM, CCND1, CCNB2, BUB1, CDC20, AURKA, AURKB, CDK4, CDC25C,
CDK2 0.012929573
KEGG_PATHWAY hsa04912: GnRH signaling pathway 1.79E-05 MAP2K1, MAPK3, MAPK9, MAPK11, MAPK7, MMP14, MMP2 0.018347497 EC_NUMBER 2.7.11.24 2.02E-05 MAPK3, MAPK9, MAPK11, MAPK7 0.012135676 KEGG_PATHWAY hsa04620: Toll-like receptor signaling pathway 2.13E-05 FOS, MAP2K1, MAPK3, MAP3K8, MAPK9, MAPK11, TLR4 0.02182043 PANTHER_PATHWAY P00006: Apoptosis signaling pathway 2.68E-05 FOS, TNFSF10, MAP3K5, ATF3, BAX, MAPK3, MAPK9, NFKB2, MAPK7 0.02355655 KEGG_PATHWAY hsa04660: T cell receptor signaling pathway 3.13E-05 FOS, MAP2K1, MAPK3, MAP3K8, MAPK9, MAPK11, CDK4 0.032014891 PANTHER_PATHWAY P00054: Toll receptor signaling pathway 3.16E-05 MAP2K1, MAPK3, MAP3K8, MAPK9, MAPK11, TLR4, NFKB2 0.02781923 KEGG_PATHWAY hsa04115: p53 signaling pathway 4.05E-05 CCNB1, CCND1, CCNB2, BAX, CDK4, CDK2 0.041438576 KEGG_PATHWAY hsa04722: Neurotrophin signaling pathway 6.84E-05 MAP3K5, MAP2K1, BAX, MAPK3, MAPK9, MAPK11, MAPK7 0.069959614 BIOCARTA h_mapkPathway: MAPKinase Signaling Pathway 3.55E-04 FOS, MAP3K5, MAP2K1, MAPK3, MAP3K8, MAPK9, MAPK11, MAPK7 0.400316292 KEGG_PATHWAY hsa05216: Thyroid cancer 6.11E-04 CCND1, MAP2K1, MAPK3, MYC 0.622621821 PANTHER_PATHWAY P00052: TGF-beta signaling pathway 6.33E-04 FOS, FOXF1, FOXA1, MAPK3, MAPK9, MAPK11, MAPK7, FOSL1 0.555596842 KEGG_PATHWAY hsa05212: Pancreatic cancer 7.67E-04 CCND1, MAP2K1, MAPK3, MAPK9, CDK4 0.781138732 KEGG_PATHWAY hsa05220: Chronic myeloid leukemia 8.95E-04 CCND1, MAP2K1, MAPK3, CDK4, MYC 0.91105286 PANTHER_PATHWAY P00010: B cell activation 0.001400729 FOS, MAP2K1, MAPK3, MAPK9, MAPK11, NFKB2 1.225108429 BIOCARTA h_p53Pathway: p53 Signaling Pathway 0.003024948 CCND1, BAX, CDK4, CDK2 3.364924295 KEGG_PATHWAY hsa05213: Endometrial cancer 0.003370738 CCND1, MAP2K1, MAPK3, MYC 3.393288113 KEGG_PATHWAY hsa05223: Non-small cell lung cancer 0.003753245 CCND1, MAP2K1, MAPK3, CDK4 3.77171584 PANTHER_PATHWAY P00035: Interferon-gamma signaling pathway 0.004182552 MAPK3, MAPK9, MAPK11, MAPK7 3.618778393 KEGG_PATHWAY hsa05221: Acute myeloid leukemia 0.004595499 CCND1, MAP2K1, MAPK3, MYC 4.600275355 PANTHER_PATHWAY P00034: Integrin signalling pathway 0.005122253 MAP3K5, MAP2K1, ITGAX, MAPK3, MAPK9, MAPK11, MAPK7, ITGAM 4.415663351 KEGG_PATHWAY hsa04621: NOD-like receptor signaling pathway 0.005544037 CCL2, MAPK3, MAPK9, MAPK11 5.525680097 KEGG_PATHWAY hsa05214: Glioma 0.005798209 CCND1, MAP2K1, MAPK3, CDK4 5.772273682 REACTOME_PATHWAY REACT_1538: Cell Cycle Checkpoints 0.007137442 CCNB1, CCNB2, CDC20, CDC25C, CDK2 5.054206969 KEGG_PATHWAY hsa05218: Melanoma 0.008084875 CCND1, MAP2K1, MAPK3, CDK4 7.964786431 BIOCARTA h_RacCycDPathway: Influence of Ras and Rho proteins on G1