ISBN no: 1-899951-31-8 978-1-899951-31-4
Published by:
AHEAD Educational Press East Hall
UCD Carysfort Avenue
Blackrock Co. Dublin Tel: (01) 7164396 Email: ahead@ahead.ie
Foreword
By Ann Heelan, Executive Director, AHEADThis report of the participation rates of students with disabilities and specific learning difficulties (SLDs) presents an overview of data gathered from across Ireland’s higher education institutions and provides us with a snapshot of the current engagement of this group with the higher education sector. Results indicate that this year has seen the biggest rise in the participation rate in seven years with over 9,000 students with disabilities and specific learning difficulties now studying across all subject areas in higher education and this trend looks set to continue.
However, while the overview is positive, the report also alerts us to the fact that the system is not barrier free for students with disabilities and there remains persistent under-representation of students with disabilities and SLDs in many schools. The overall success of the sector in welcoming students with disabilities and SLDs in higher education must be acknowledged, nevertheless the increase in overall numbers hides the fact that for many students with disabilities, equity of access and opportunity is not a reality. The numbers of students with vision impairment has actually decreased in the past two years indicating an alarming new trend. Furthermore students with disabilities are three times less likely to be studying on courses in the field of Education and are under-represented in other key areas such as the Health Sciences and Agriculture.
Only 1% of students on part time courses have registered as having a disability or SLD meaning the rate of participation of students with disabilities is five times lower on part time courses than on a full time ones.
The report highlights interesting trends such as the fact that students with disabilities and SLDs are far more likely to be studying in areas such as Humanities and Arts than other students. In addition, students in the
Aspergers/Autism category are 3 1/2 times more likely to be studying in the Computing field than other students and twice as likely to be studying in the Science field while students with specific learning difficulties are over represented in areas such Engineering.
These key trends have real implications for higher education. Students with disabilities and SLDs are entering the system on merit but their choice of course appears to be more limited than other students and they are not availing of all opportunities on an equal footing. While we do not know the precise reasons why students with disabilities and SLDs are under-represented on certain
adding on supports through the disability support services. Of course these are essential services but on their own, they are not enough. Re-thinking education for all students would introduce flexibility and innovations into teaching and
learning in higher education to the benefit not only of students with disabilities but all students and would benefit the institutions themselves.
Contents
Foreword
2
Contents
4
Introduction
5
Survey Method
6
Findings
8
Participation Rates of Students with Disabilities
8
Full Time/Part Time Divide
10
New Entrant and Final Year Undergraduates with Disabilities
11
Mature Students with Disabilities
12
New Registrations
13
Nature of Disability
14
New Entrant Disability Breakdown 15
Final Year Disability Breakdown 15
Undergraduate Disability Breakdown 15
Postgraduate Disability Breakdown 16
Fields of Study of Students with Disabilities
18
Fields of Study Breakdown by Disability 20
Aspergers/Autism – Fields of Study Breakdown 21
ADD/ADHD – Fields of Study Breakdown 23
Blind/Visually Impaired – Fields of Study Breakdown 24
Deaf/ Hearing Impaired – Fields of Study Breakdown 26
DCD – Dyspraxia/Dysgraphia – Fields of Study Breakdown 27
Mental Health Condition – Fields of Study Breakdown 28
Neurological/Speech and Language – Fields of Study Breakdown 30 Significant Ongoing Illness – Fields of Study Breakdown 32
Physical Disability – Fields of Study Breakdown 34
Specific Learning Difficulty – Fields of Study Breakdown 36
Other – Fields of Study Breakdown 38
Examination Accommodations
39
Exam Accommodations – Disability Profile 39
Exam Accommodation Types 40
Extra Time Breakdown 41
Alternative Venue Breakdown 41
Inside the Service
42
Dyslexia Screenings 42
On the Ground
43
On the Ground - Respondents Comments: 43
Conclusion
45
Recommendations
48
Bibliography
50
Introduction
AHEAD (Association for Higher Education Access and Disability) is the National Centre for Inclusive Education. An independent non-profit organisation, it works to promote full access to and participation in further and higher education for students with disabilities and to enhance their employment prospects on graduation.
A core function of AHEAD’s work is to monitor the overall participation and progress of students with disabilities in higher education and to identify emerging trends. To this end, AHEAD surveys all Higher Education Authority (HEA)
funded Higher Education Institutions (HEIs) plus other strategically important higher education institutions in Ireland on a periodic basis. This is in order to get a snapshot of the numbers of students with disabilities entering and progressing through the higher education system in Ireland and to identify trends and areas of improvement. The objective in carrying out the survey is to provide an accurate, national measure of the numbers of students with disabilities in higher education, to identify where they are studying and to benchmark progress from year to year. It is intended that the results can be used to highlight areas of inequality and to inform future strategic planning to improve access for these students. This report details the results of AHEAD’s survey on the participation of students with
disabilities in higher education during the academic year 2012/2013. AHEAD provides practical know how and information to professionals and
students on what is good inclusive practice in higher education and employment. In meeting its aims and objectives, AHEAD has designed and coordinates a number of key projects. These include;
- GET AHEAD, a forum of graduates which listens to the voice of graduates and provides career advice and networking opportunities to students and graduates with disabilities
- The Willing Able Mentoring Programme which works with and supports employers to create a more inclusive workplace and provides paid mentored work placement opportunities for graduates with disabilities
Survey Method
This survey was carried out by AHEAD, the Association for Higher Education Access and Disability, in collaboration with the Disability/Access Officers of various institutions throughout the country. A questionnaire was sent to the Disability/Access Officer in each of the targeted institutions. The institutions that received the survey were targeted based on those who are funded by the Higher Education Authority (HEA) and are included in the HEA annual statistics on the total student population for the academic year 2012/131, with the aim of
comparing our data with the recently released HEA data for 2011/12. This year we also included the National College of Ireland despite them being funded by the Dept. of Education; we included them because we felt we could not ignore an institution of this size. 28 institutions were approached and 26 of those
responded to the survey, all of which are listed below. Some institutions were unable to complete every section of the survey, and this is explained in footnotes throughout the report.
Universities (later referred to as) Institutes of Technology and Other Institutions (later referred to as)
-University College Dublin (UCD) -University College Cork (UCC)
-National University of Ireland, Galway (NUIG)
-Trinity College Dublin (TCD)
-National University of Ireland, Maynooth (NUIM)
-Dublin City University (DCU) -University of Limerick (UL) -Mary Immaculate College (MIC)
-Mater Dei Institute of Education (MDIE) -National College of Art and Design (NCAD)
-Royal College of Surgeons in Ireland (RCSI)
-St. Angela’s College (St. Ang)
-St. Patricks College Drumcondra (SPD)
-Athlone Institute of Technology (AIT) -Cork Institute of Technology (CIT) -Dublin Institute of Technology (DIT) -Dun Laoghaire Institute of Art, Design & Technology (DLIADT)
-Dundalk Institute of Technology (DKIT) -Institute of Technology Blanchardstown (ITB)
-Institute of Technology Sligo (ITS) -Institute of Technology Tallaght (ITT) -Institute of Technology Tralee (ITTRA) -Letterkenny Institute of Technology (LYIT) -Limerick Institute of Technology (LIT) -National College of Ireland (NCI) -Waterford Institute of Technology (WIT)
In this report you will find comparisons between the findings of this survey and the findings of six similar surveys of the participation rates of students with disabilities for the academic years 2011/12, 2010/11, 2009/10, 2008/09,
2005/2006 and 1998/1999, all of which were undertaken by AHEAD. There are some differences in the approach to the seven surveys, most notably that the 98/99 survey was much larger in scale, and it is important to point out these differences if one is to make an informed comparison of the educational landscapes of the relevant years. In the 98/99 survey, 42 institutions returned information regarding the participation of students with disabilities, in comparison with 22 in 05/06, 21 in 08/09 and 26 in 09/10, 23 in 10/11, 25 in 11/12 and 26 in the current survey, although most of the major institutions are represented in all of them. There are also some comparisons made where possible, with a survey carried out by AHEAD on the same topic made for the academic year 1993/1994 and it should be noted that this survey included Northern Ireland higher education institutions, which were not included in the subsequent participation surveys. It should be noted that when the term “students with disabilities” (shortened to SWDs in parts) is used in this report, it refers only to students with a disability or specific learning difficulty who have registered with the disability/access service of one of the participating institutions who have responded to the section in question and who have declared a disability, verified by medical documentation. In other words, students with a disability who have not registered with the
services of one of the participating institutions are not included in the findings. In this report you will find comparisons between the findings of this survey and the findings of six similar surveys of the participation rates of students with disabilities for the academic years 2011/12, 2010/11, 2009/10, 2008/09,
2005/2006 and 1998/1999, all of which were undertaken by AHEAD. There are some differences in the approach to the seven surveys, most notably that the 98/99 survey was much larger in scale, and it is important to point out these differences if one is to make an informed comparison of the educational landscapes of the relevant years. In the 98/99 survey, 42 institutions returned information regarding the participation of students with disabilities, in comparison with 22 in 05/06, 21 in 08/09 and 26 in 09/10, 23 in 10/11, 25 in 11/12 and 26 in the current survey, although most of the major institutions are represented in all of them. There are also some comparisons made where possible, with a survey carried out by AHEAD on the same topic made for the academic year 1993/1994 and it should be noted that this survey included Northern Ireland higher education institutions, which were not included in the subsequent participation surveys. It should be noted that when the term “students with disabilities” (shortened to SWDs in parts) is used in this report, it refers only to students with a disability or specific learning difficulty who have registered with the disability/access service of one of the participating institutions who have responded to the section in question and who have declared a disability, verified by medical documentation. In other words, students with a disability who have not registered with the
Findings
Participation Rates of Students with Disabilities
The 26 responding institutions in Ireland identified a total of 9082 students with disabilities, representing 4.6% of the total student population, of which 8261 are studying undergraduate courses and 821 are studying postgraduate courses. This represents a 14% rise in the total number of students with disabilities from 11/12, when the figure was 7957. This means that students with disabilities now make up 4.6% of the total student population in the responding institutions, a
[image:9.595.80.518.375.680.2]0.6% increase from last year’s figure of 4.0%. The rate of growth of students with disabilities as a percentage of the total student population had appeared to be slowing down in recent years and was not expected to rise significantly but this 0.6% increase is the biggest year on year increase in this figure since we began carrying out this survey on an annual basis starting with the 2008/9 academic year.
Figure 1 shows the increasing numbers of students with disabilities from
AHEAD’s first survey of the subject in 1993/94 right through to 2012/13
10% in others. Dun Laoghaire Institute of Art, Design & Technology had the highest rate of participation at 10.2%, followed by Institute of Technology Tralee at 7.8%. National College of Art & Design had the highest participation rate in the University Sector with 7.1% of their total student population being made up of SWDs. See Table 13 in the Appendix for further information on the numbers of students with disabilities registered in each of the responding institutions. In the academic year 2012/13, SWDs made up 5% (8261) of the total undergraduate population but just 2.4% (821) of the total postgraduate
population in the 26 responding institutions indicating that significant barriers still prevent students with disabilities from undertaking postgraduate studies, resulting in a notable underrepresentation at this level.
Full Time/Part Time Divide
AHEAD collected data on the breakdown of SWDs by the full time/part time status of their courses. The 26 responding institutions provided the full time/part time breakdown of all SWDs registered with the disability support services. The responding institutions identified 8722 SWDs undertaking full time courses
representing 5.4% of the total full time student population (up from 4.7% in 11/12) while just 360 SWDs undertaking part time courses were reported, representing only 1% of the total part time student population (up from 0.9%).
This significant gap between the participation of SWDs on part time courses compared with full time courses highlights the considerable barriers faced by these students. One would expect given the impact of certain disabilities, that part time study would be a more suitable choice for many students and one might reasonably expect the part time participation rate to be higher than the full time rate but the data does not reflect this, suggesting that there are systemic barriers present. While we have no robust evidence of the nature of these barriers,
[image:11.595.83.495.464.784.2]anecdotal sources such as calls made to the AHEAD information service indicates that the lack of funding for additional supports through the Fund for Students with Disabilities in the part time sector is a real difficulty, in particular where the supports are costly as is the case with, for example, sign language interpretation or personal assistance.
Figure 2 shows the full time and part time breakdown of students with disabilities registered with the disability service of the responding institutions
Key Point: The participation rate of Students with
New Entrant and Final Year Undergraduates with Disabilities
The institutions surveyed were asked to supply numbers of new entrantundergraduates registered with the disability service in 2012/13, “new entrant”
meaning students in their first year of study. A total of 2337 new entrants were registered with the services of the 26 responding institutions (up from 1966 in 11/12) representing 28% of the total disabled undergraduate population, up from 27% in 11/12.
The survey also asked for the numbers of final year undergraduates registered with the disability service in 2012/13 and 24 of the responding institutions
completed the question2. A total of 1708 final year undergraduates were
registered with the services of the responding institutions, representing 21% of the total disabled undergraduate population, up from 19% in 11/12.
2 CIT & DIT could not provide this information
New Entrant and Final Year Undergraduates with Disabilities
The institutions surveyed were asked to supply numbers of new entrantundergraduates registered with the disability service in 2012/13, “new entrant”
meaning students in their first year of study. A total of 2337 new entrants were registered with the services of the 26 responding institutions (up from 1966 in 11/12) representing 28% of the total disabled undergraduate population, up from 27% in 11/12.
The survey also asked for the numbers of final year undergraduates registered with the disability service in 2012/13 and 24 of the responding institutions
completed the question2. A total of 1708 final year undergraduates were
registered with the services of the responding institutions, representing 21% of the total disabled undergraduate population, up from 19% in 11/12.
Mature Students with Disabilities
The institutions surveyed were asked to supply numbers of mature students registered with the disability service in 2012/13. A total of 1231 (up from 1130 in 11/12) mature students were registered with the services of the 23 institutions that responded to this question3, representing 17.9% of the total population of
students with disabilities in those institutions.
New Registrations
Institutions were asked to provide information on the number of all students who newly registered with the disability service in 2012/13, including those that were not new entrants to the institution. This question was asked in an attempt to capture the approximate number of students who were going through first year (or more) without support and then subsequently realised they required support and registered in 2012/13. We calculated this number by taking the number of new registrations and subtracting the number of new entrants. The 254
institutions that responded to this question identified 699 students newly
registered with the disability service who were not new entrants to the institution, representing a surprisingly large 8.6% of total SWDs in these institutions and 25% of total new registrations.
4 UCC could not provide this information
Key Point: It is interesting to note the high number of
students who register for support in years subsequent to
their first. It is important to understand the difference that
support makes to the retention of students with disabilities
and to identify the factors that enhance their learning
Nature of Disability
Figure 3 shows the disability profile of total disabled student population
The categories of disability in the breakdown match those outlined in the
guidelines provided by the Higher Education Authority to institutions applying to
the Fund for Students with Disabilities albeit with an ‘Other’ category added for
students registered with the services who did not fall into one of these categories. The responding institutions provided the primary disability profile of 8258
undergraduates with disabilities and 824 postgraduates with disabilities. Of the 9082 students represented in the disability profile, 307 (3.4%) are in the
Aspergers/Autism category, 293 (3.2%) have ADD/ADHD, 191 (2.1%) are in the Blind/Visually Impaired category, 288 (3.2%) are in the Deaf/Hard of Hearing
category, 253 (2.8%) have DCD – Dyspraxia/Dysgraphia, 976 (10.7%) have a
Mental Health Condition, 168 (1.8%) have a Neurological/Speech and Language Condition, 932 (10.3%) have a Significant Ongoing Illness, 609 (6.7%) have a Physical Disability, 4913 (54.1%) have a Specific Learning Difficulty, and 152 (1.7%) were placed in the Other category.
New Entrant Disability Breakdown
Of the 2337 new entrant undergraduate students with disabilities identified by the responding institutions, 97 (4.2%) are in the Aspergers/Autism category, 119 (5.1%) have ADD/ADHD, 31 (1.3%) are Blind/Visually Impaired, 59 (2.5%) are
Deaf/Hard of Hearing, 112 (4.8%) have DCD – Dyspraxia/Dysgraphia, 206
(8.8%) have a Mental Health Condition, 48 (2.1%) have a Neurological/Speech and Language Condition, 217 (9.3%) have a Significant Ongoing Illness, 124 (5.3%) have a Physical Disability, 1297 (55.5%) have a Specific Learning Difficulty, and 27 (1.2%) were placed in the Other category.
Final Year Disability Breakdown
Of the 1708 final year undergraduate students with disabilities identified by the 24
institutions who responded to this question5, 46 (2.7%) are in the
Aspergers/Autism category, 33 (1.9%) have ADD/ADHD, 34 (2%) are
Blind/Visually Impaired, 62 (3.6%) are Deaf/Hard of Hearing, 20 (1.2%) have
DCD – Dyspraxia/Dysgraphia, 195 (11.4%) have a Mental Health Condition, 30
(1.8%) have a Neurological/Speech and Language Condition, 178 (10.4%) have a Significant Ongoing Illness, 126 (7.4%) have a Physical Disability, 959 (56.1%) have a Specific Learning Difficulty, and 25 (1.5%) were placed in the Other category.
Undergraduate Disability Breakdown
Of the 8258 undergraduate students with disabilities identified by the responding institutions, 287 (3.5%) are in the Aspergers/Autism category, 277 (3.4%) have ADD/ADHD, 147 (1.8%) are Blind/Visually Impaired, 255 (3.1%) are Deaf/Hard of
Hearing, 238 (2.9%) have DCD – Dyspraxia/Dysgraphia, 853 (10.3%) have a
Mental Health Condition, 146 (1.8%) have a Neurological/Speech and Language
5 CIT and DIT could not provide this information
Behind the Numbers: While it is good to see that the recent
trend of the sensory impairments falling as a percentage of
the total population of students with disabilities has been
arrested in the Deaf/Hard of Hearing Category, the
percentage of Blind/Visually Impaired students remains a
real concern.
Condition, 831 (10.1%) have a Significant Ongoing Illness, 499 (6.0%) have a Physical Disability, 4574 (55.4%) have a Specific Learning Difficulty, and 151 (1.8%) were placed in the Other category.
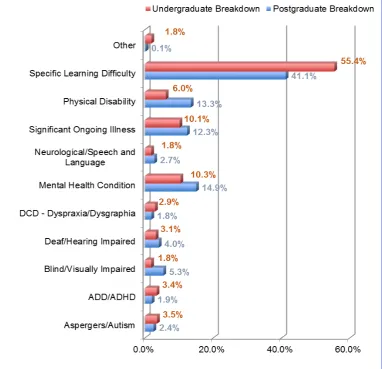
Postgraduate Disability Breakdown
[image:17.595.87.470.398.767.2]Of the 824 postgraduate students with disabilities identified by the responding institutions, 20 (2.4%) are in the Aspergers/Autism category, 16 (1.9%) have ADD/ADHD, 44 (5.3%) are Blind/Visually Impaired, 33 (4.0%) are Deaf/Hard of Hearing, 15 (1.8%) have DCD – Dyspraxia/Dysgraphia, 123 (14.9%) have a Mental Health Condition, 22 (2.7%) have a Neurological/Speech and Language Condition, 101 (12.3%) have a Significant Ongoing Illness, 110 (13.3%) have a Physical Disability, 339 (41.1%) have a Specific Learning Difficulty, and 1 (0.1%) were placed in the Other category.
It is notable that while the total new entrant and undergraduate breakdowns are almost identical, the postgraduate breakdown differs significantly from the others. Students with Specific Learning Difficulties making up 41.1% of the postgraduate breakdown compared to 55.4% of the undergraduate breakdown. Students with physical disabilities make up 13.3% of the postgraduate breakdown in
comparison to 6% of the undergraduate breakdown. Students in the
Blind/Visually impaired (5.3%), Mental Health Condition (14.9%) and Significant Ongoing Illness (12.3%) categories also represent a significantly larger
percentage of the postgraduate population than the undergraduate population of students with disabilities.
These significant differences deserve further exploration for example, when it comes to the breakdown of students with disabilities, why do postgraduate students who are Blind/Visually Impaired represent 3 times the number (as a percentage of total SWDs) of their undergraduate peers, or postgraduates with a physical disability twice the number of their undergraduate peers. Perhaps
Fields of Study of Students with Disabilities
The responding institutions reported on the number of students with disabilities in each field of study. Each institution was given the subject breakdown as used by
the HEA in their statistics but modified slightly6, each subject coming under one
[image:19.595.81.517.287.688.2]of 13 categories and were asked to report the number of students with disabilities studying in each category.
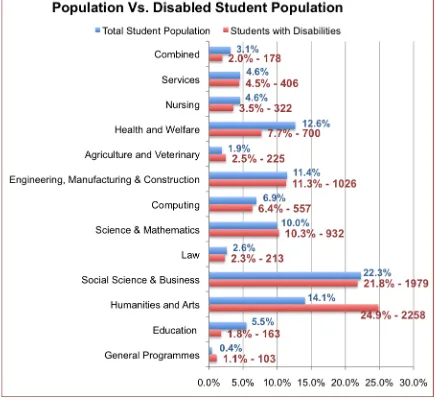
Figure 5 shows the fields of study of students with disabilities and compares them to the figures for the total student population7
6 HEA statistics collate subjects under 10 categories. In this survey AHEAD provided 13 categories putting Law, Computing & Nursing in categories of their own where in the HEA statistics they were included in more diverse categories.
‘Humanities & Arts’ was again the most common field of study for students with
disabilities in the responding institutions with 24.9% of the makeup, followed by
‘Social Science & Business’ with 21.8% and ‘Engineering, Manufacturing and Construction’ with 11.3%. The least common fields of study for students with
disabilities were ‘General Programmes’ with 1.1%, ‘Education’ with 1.8% and
‘Combined Studies’ with 2%.
The most notable differences between the percentage breakdown for fields of study of students with disabilities and the breakdown for the total student
population arise in the fields of ‘Humanities and Arts’, ‘Health & Welfare’ and
‘Education’. 24.9% of students with disabilities study in the field of ‘Humanities and Arts’ in comparison to 14.1% of the total student population, 7.7% of all
students with disabilities study in the area of ‘Health & Welfare’ in comparison to
12.6% of the total student population and 1.8% of students with disabilities study
in the field of ‘Education’ compared to 5.5% of the total population.
Key Point: Students with Disabilities are still three times less
likely to study in the field of ‘Education’ than their non
Fields of Study Breakdown by Disability
We asked the responding institutions to provide the fields of study breakdown of students with disabilities by category of disability. The 25 institutions that
responded to this question8 provided the fields of study of 8186 students with
disabilities and the fields of study breakdown for each disability. Below you will find a section on the fields of study of each disability category, each one
containing a table and a summary of interesting points about the results. Please note that when discussing the preferred subjects of each disability category, we will omit reference to the ‘General Programmes’ field as well as the ‘Combined’ field as they are by far the least popular subjects for the total student population and given their broad nature, neither reveal a great deal about the students with disabilities studying them.
The results provide us with information that has implications for the design and implementation for teaching and learning within higher education as a whole and in particular on specific fields of study.
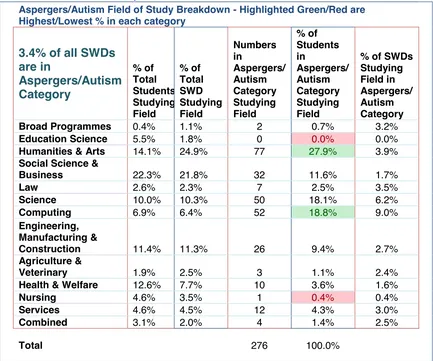
Aspergers/Autism – Fields of Study Breakdown
Table 1 shows the fields of study breakdown for students in the Aspergers/Autism Category and compares with the breakdown of total students with disabilities and total student fields of study breakdown
Aspergers/Autism Field of Study Breakdown - Highlighted Green/Red are Highest/Lowest % in each category
3.4% of all SWDs are in Aspergers/Autism Category % of Total Students Studying Field % of Total SWD Studying Field Numbers in Aspergers/ Autism Category Studying Field % of Students in Aspergers/ Autism Category Studying Field
% of SWDs Studying Field in Aspergers/ Autism Category Broad Programmes 0.4% 1.1% 2 0.7% 3.2% Education Science 5.5% 1.8% 0 0.0% 0.0%
Humanities & Arts 14.1% 24.9% 77 27.9% 3.9% Social Science & Business 22.3% 21.8% 32 11.6% 1.7%
Law 2.6% 2.3% 7 2.5% 3.5%
Science 10.0% 10.3% 50 18.1% 6.2%
Computing 6.9% 6.4% 52 18.8% 9.0%
Engineering, Manufacturing &
Construction 11.4% 11.3% 26 9.4% 2.7%
Agriculture & Veterinary 1.9% 2.5% 3 1.1% 2.4% Health & Welfare 12.6% 7.7% 10 3.6% 1.6%
Nursing 4.6% 3.5% 1 0.4% 0.4%
Services 4.6% 4.5% 12 4.3% 3.0%
Combined 3.1% 2.0% 4 1.4% 2.5%
Total 276 100.0%
Key Points:
In comparison to other students with disabilities, those in the
Aspergers/Autism category are most underrepresented in the fields of Education Science and Agriculture & Veterinary.
In comparison to other students with disabilities, those in the
Aspergers/Autism category are most overrepresented in the fields of Science & Computing.
The institutions who responded to this question reported 0 students with
Students in the Aspergers/Autism category are about 3 times as likely to
study in the Computing field as the average student or the average student with a disability.
Students in the Aspergers/Autism category are less than half as likely to
ADD/ADHD – Fields of Study Breakdown
Table 2 shows the fields of study breakdown for students in the ADD/ADHD Category and compares with the breakdown of total students with disabilities and total student fields of study breakdown
ADD/ADHD Field of Study Breakdown - Highlighted Green/Red are Highest/Lowest % in each category
3.2% of all SWDs are in ADD/ADHD Category % of Total Student s Studyin g Field % of Total SWD Studyin g Field Numbers in ADD/ADH D Category Studying Field % of Students in ADD/ADH D Category Studying Field % of SWDs Studying Field in ADD/ADH D Category Broad Programmes 0.4% 1.1% 7 2.9% 11.1% Education Science 5.5% 1.8% 2 0.8% 1.3%
Humanities & Arts 14.1% 24.9% 56 23.1% 2.9% Social Science & Business 22.3% 21.8% 44 18.2% 2.4%
Law 2.6% 2.3% 11 4.5% 5.5%
Science 10.0% 10.3% 24 9.9% 3.0%
Computing 6.9% 6.4% 22 9.1% 3.8%
Engineering, Manufacturing &
Construction 11.4% 11.3% 21 8.7% 2.2%
Agriculture & Veterinary 1.9% 2.5% 3 1.2% 2.4% Health & Welfare 12.6% 7.7% 20 8.3% 3.1%
Nursing 4.6% 3.5% 7 2.9% 2.6%
Services 4.6% 4.5% 10 4.1% 2.5%
Combined 3.1% 2.0% 15 6.2% 9.4%
Total 242 100.0%
Key Points:
In comparison to other students with disabilities, those in the ADD/ADHD
category are most underrepresented in the fields of Agriculture & Veterinary and Education.
In comparison to other students with disabilities, those in the ADD/ADHD
category are most overrepresented in the fields of Computing and Law.
The institutions who responded to this question reported just 2 students
with ADD/ADHD in the field of Education.
Students in the ADD/ADHD category are almost twice as likely to study in
Blind/Visually Impaired – Fields of Study Breakdown
Table 3 shows the fields of study breakdown for students in the Blind/Visually Impaired Category and compares with the breakdown of total students with disabilities and total student fields of study breakdown
Blind/Visually Impaired Field of Study Breakdown - Highlighted Green/Red are Highest/Lowest % in each category
2.1% of all SWDs are in Blind/Visually Impaired Category % of Total Students Studying Field % of Total SWD Studying Field Numbers in Blind/Visually Impaired Studying Field % of Students in Blind/Visually Impaired Category Studying Field
% of SWDs Studying Field in Blind/Visually Impaired
Category
Broad Programmes 0.4% 1.1% 0 0.0% 0.0%
Education Science 5.5% 1.8% 7 4.0% 4.5%
Humanities & Arts 14.1% 24.9% 58 33.3% 3.0% Social Science & Business 22.3% 21.8% 41 23.6% 2.2%
Law 2.6% 2.3% 10 5.7% 5.0%
Science 10.0% 10.3% 9 5.2% 1.1%
Computing 6.9% 6.4% 22 12.6% 3.8%
Engineering, Manufacturing
& Construction 11.4% 11.3% 13 7.5% 1.3%
Agriculture & Veterinary 1.9% 2.5% 2 1.1% 1.6% Health & Welfare 12.6% 7.7% 5 2.9% 0.8%
Nursing 4.6% 3.5% 1 0.6% 0.4%
Services 4.6% 4.5% 1 0.6% 0.2%
Combined 3.1% 2.0% 5 2.9% 3.1%
Total 174 100.0%
Key Points:
In comparison to other students with disabilities, those in the Blind/Visually
Impaired category are most underrepresented in the fields of Nursing, Services, Health & Welfare and Agriculture & Veterinary.
In comparison to other students with disabilities, those in the Blind/Visually
Impaired category are most overrepresented in the fields of Law, Education Science and Computing.
The institutions who responded to this question reported just 1 student in
Students in the Blind/Visually Impaired category are almost 2 ½ times as
likely to study in the Law field as the average student with a disability and more than twice as likely as the average student.
Students in the Blind/Visually Impaired category are less than a quarter as
likely to study in the fields of Nursing and Services as the average student or student with a disability.
Despite being less likely than the average student to study in the field of
Deaf/ Hearing Impaired – Fields of Study Breakdown
Table 4 shows the fields of study breakdown for students in the Deaf/Hearing Impaired Category and compares with the breakdown of total students with disabilities and total student fields of study breakdown
Deaf/Hearing Impaired Field of Study Breakdown - Highlighted Green/Red are Highest/Lowest % in each category
3.2% of all SWDs are in Deaf/Hearing Impaired Category % of Total Student s Studyin g Field % of Total SWD Studyin g Field Numbers in Deaf/Hearin g Impaired Category Studying Field % of Students in Deaf/Hearin g Impaired Category Studying Field
% of SWDs Studying Field in Deaf/Hearin g Impaired Category Broad Programmes 0.4% 1.1% 0 0.0% 0.0% Education Science 5.5% 1.8% 9 3.8% 5.8%
Humanities & Arts 14.1% 24.9% 57 24.2% 2.9% Social Science & Business 22.3% 21.8% 57 24.2% 3.1%
Law 2.6% 2.3% 5 2.1% 2.5%
Science 10.0% 10.3% 25 10.6% 3.1%
Computing 6.9% 6.4% 17 7.2% 2.9%
Engineering, Manufacturing &
Construction 11.4% 11.3% 20 8.5% 2.1%
Agriculture & Veterinary 1.9% 2.5% 1 0.4% 0.8% Health & Welfare 12.6% 7.7% 22 9.3% 3.4%
Nursing 4.6% 3.5% 10 4.2% 3.7%
Services 4.6% 4.5% 8 3.4% 2.0%
Combined 3.1% 2.0% 5 2.1% 3.1%
Total 236 100.0%
Key Points:
In comparison to other students with disabilities, those in the Deaf/Hearing
Impaired category are most underrepresented in the fields of Agriculture & Veterinary and Engineering, Manufacturing & Construction.
In comparison to other students with disabilities, those in the Deaf/Hearing
Impaired category are most overrepresented in the field of Education Science.
The institutions that responded to this question reported only 1 student in
the Deaf/Hearing Impaired category in the field of Agriculture & Veterinary.
Students in the Deaf/Hearing Impaired category are more than twice as
DCD – Dyspraxia/Dysgraphia – Fields of Study Breakdown
Table 5 shows the fields of study breakdown for students in the DCD – Dyspraxia/ Dysgraphia Category and compares with the breakdown of total students with disabilities and total student fields of study breakdown
DCD - Dyspraxia Field of Study Breakdown - Highlighted Green/Red are Highest/Lowest % in each category
2.8% of all SWDs are in DCD -
Dyspraxia Category % of Total Student s Studyin g Field % of Total SWD Studyin g Field Numbers in DCD - Dyspraxi a Studying Field % of Students in DCD - Dyspraxia Category Studying Field % of SWDs Studying Field in DCD - Dyspraxi a Category Broad Programmes 0.4% 1.1% 2 0.8% 3.2% Education Science 5.5% 1.8% 2 0.8% 1.3%
Humanities & Arts 14.1% 24.9% 64 26.7% 3.3% Social Science & Business 22.3% 21.8% 66 27.5% 3.6%
Law 2.6% 2.3% 7 2.9% 3.5%
Science 10.0% 10.3% 23 9.6% 2.8%
Computing 6.9% 6.4% 24 10.0% 4.2%
Engineering, Manufacturing &
Construction 11.4% 11.3% 25 10.4% 2.6%
Agriculture & Veterinary 1.9% 2.5% 0 0.0% 0.0% Health & Welfare 12.6% 7.7% 12 5.0% 1.9%
Nursing 4.6% 3.5% 2 0.8% 0.7%
Services 4.6% 4.5% 11 4.6% 2.7%
Combined 3.1% 2.0% 2 0.8% 1.3%
Total 240 100.0%
Key Points:
In comparison to other students with disabilities, those in the DCD –
Dyspraxia/Dysgraphia category are most underrepresented in the fields of Education Science, Nursing and Agriculture & Veterinary.
In comparison to other students with disabilities, those in the DCD – Dyspraxia/Dysgraphia category are most overrepresented in the fields of Law, Social Science & Business and Computing.
The institutions who responded to this question reported 0 students in the Dyspraxia/Dysgraphia category in the field of Agriculture & Veterinary. Students in the DCD – Dyspraxia/Dysgraphia category are about 1½ times
as likely to study in the Computing field as the average student with a disability or the average student.
Mental Health Condition – Fields of Study Breakdown
Table 6 shows the fields of study breakdown for students in the Mental Health Condition Category and compares with the breakdown of total students with disabilities and total student fields of study breakdown
Mental Health Condition Field of Study Breakdown - Highlighted Green/Red are Highest/Lowest % in each category
10.7% of all SWDs are in Mental Health Condition Category % of Total Student s Studyin g Field % of Total SWD Studyin g Field Numbers in Mental Health Condition Category Studying Field % of Students in Mental Health Condition Category Studying Field % of SWDs Studying Field in Mental Health Condition Category Broad Programmes 0.4% 1.1% 6 0.7% 9.5% Education Science 5.5% 1.8% 13 1.5% 8.3%
Humanities & Arts 14.1% 24.9% 322 36.7% 16.5% Social Science & Business 22.3% 21.8% 159 18.1% 8.6%
Law 2.6% 2.3% 30 3.4% 15.1%
Science 10.0% 10.3% 104 11.8% 12.8%
Computing 6.9% 6.4% 56 6.4% 9.7%
Engineering, Manufacturing &
Construction 11.4% 11.3% 43 4.9% 4.4%
Agriculture & Veterinary 1.9% 2.5% 1 0.1% 0.8% Health & Welfare 12.6% 7.7% 75 8.5% 11.7%
Nursing 4.6% 3.5% 30 3.4% 11.1%
Services 4.6% 4.5% 19 2.2% 4.7%
Combined 3.1% 2.0% 20 2.3% 12.5%
Total 878 100.0%
Key Points:
In comparison to other students with disabilities, those in the Mental Health Condition category are most underrepresented in the fields of Computing, Agriculture & Veterinary and Engineering, Manufacturing & Construction.
In comparison to other students with disabilities, those in the Mental Health Condition category are most overrepresented in the fields of Humanities & Arts and Law.
The institutions that responded to this question reported just 1 student in the Mental Health Condition category in the field of Agriculture &
Students in the Mental Health Condition category are almost 1½ times as likely to study in the Humanities & Arts field as the average student with a disability and more than 2 ½ times as likely as the average student. Students in the Mental Health Condition category are almost 1½ times as
likely to study in the Law field as the average student with a disability. Students in the Mental Health Condition category are less than half as likely as the average student or student with a disability to study in the fields of Agriculture & Veterinary, Engineering, Manufacturing &
Neurological/Speech and Language – Fields of Study Breakdown
Table 7 shows the fields of study breakdown for students in the Neurological/Speech and Language Category and compares with the breakdown of total students with disabilities and total student fields of study breakdown
Neurological/Speech and Language Field of Study Breakdown - Highlighted Green/Red are Highest/Lowest % in each category
1.8% of all SWDs are in Neurological/ Speech and Language Category % of Total Stude nts Study ing Field % of Total SWD Study ing Field Numbers in Neurological/ Speech and Language Studying Field
% of Students in Neurological/ Speech and Language Category Studying Field
% of SWDs Studying Field in Neurological/ Speech and Language Category
Broad Programmes 0.4% 1.1% 0 0.0% 0.0%
Education Science 5.5% 1.8% 6 3.6% 3.8%
Humanities & Arts 14.1% 24.9% 55 32.7% 2.8% Social Science & Business 22.3% 21.8% 34 20.2% 1.8%
Law 2.6% 2.3% 2 1.2% 1.0%
Science 10.0% 10.3% 13 7.7% 1.6%
Computing 6.9% 6.4% 12 7.1% 2.1%
Engineering, Manufacturing &
Construction 11.4% 11.3% 12 7.1% 1.2%
Agriculture & Veterinary 1.9% 2.5% 2 1.2% 1.6% Health & Welfare 12.6% 7.7% 17 10.1% 2.6%
Nursing 4.6% 3.5% 8 4.8% 3.0%
Services 4.6% 4.5% 4 2.4% 1.0%
Combined 3.1% 2.0% 3 1.8% 1.9%
Total 168 100.0%
Key Points:
In comparison to other students with disabilities, those in the
Neurological/Speech and Language category are most underrepresented in the fields of Law and Agriculture & Veterinary.
In comparison to other students with disabilities, those in the
Neurological/Speech and Language category are most overrepresented in the field of Education Science.
The institutions who responded to this question reported just 2 students in
Students in the Neurological/Speech and Language category are about
twice as likely to study in the Education Science field as the average student with a disability.
Students in the Neurological/Speech and Language category are about
Significant Ongoing Illness – Fields of Study Breakdown
Table 8 shows the fields of study breakdown for students in the Significant Ongoing Illness Category and compares with the breakdown of total students with disabilities and total student fields of study breakdown
Significant Ongoing Illness Field of Study Breakdown - Highlighted Green/Red are Highest/Lowest % in each category
10.3% of all SWDs are in Significant Ongoing Illness Category % of Total Student s Studyin g Field % of Total SWD Studyin g Field Numbers in Significan t Ongoing Illness Category Studying Field % of Students in Significan t Ongoing Illness Category Studying Field % of SWDs Studying Field in Significan t Ongoing Illness Category Broad Programmes 0.4% 1.1% 3 0.4% 4.8% Education Science 5.5% 1.8% 21 2.6% 13.5%
Humanities & Arts 14.1% 24.9% 223 27.3% 11.4% Social Science & Business 22.3% 21.8% 167 20.4% 9.0%
Law 2.6% 2.3% 23 2.8% 11.6%
Science 10.0% 10.3% 119 14.6% 14.7%
Computing 6.9% 6.4% 40 4.9% 6.9%
Engineering, Manufacturing &
Construction 11.4% 11.3% 62 7.6% 6.4%
Agriculture & Veterinary 1.9% 2.5% 1 0.1% 0.8% Health & Welfare 12.6% 7.7% 95 11.6% 14.8%
Nursing 4.6% 3.5% 32 3.9% 11.8%
Services 4.6% 4.5% 18 2.2% 4.4%
Combined 3.1% 2.0% 13 1.6% 8.1%
Total 817 100.0%
Key Points:
In comparison to other students with disabilities, those in the Significant
Ongoing Illness category are most underrepresented in the fields of Agriculture & Veterinary and Services.
In comparison to other students with disabilities, those in the Significant
Ongoing Illness category are most overrepresented in the fields of Health & Welfare, Science and Education Science.
The institutions that responded to this question reported just 1 student in
Students in the Significant Ongoing Illness category are almost 1 ½ times
Physical Disability – Fields of Study Breakdown
Table 9 shows the fields of study breakdown for students in the Physical Disability Category and compares with the breakdown of total students with disabilities and total student fields of study breakdown
Physical Disability Field of Study Breakdown - Highlighted Green/Red are Highest/Lowest % in each category
6.7% of all SWDs are in Physical Disability Category % of Total Students Studying Field % of Total SWD Studying Field Numbers in Physical Disability Studying Field % of Students in Physical Disability Category Studying Field % of SWDs Studying Field in Physical Disability Category Broad Programmes 0.4% 1.1% 2 0.4% 3.2% Education Science 5.5% 1.8% 23 4.2% 14.7%
Humanities & Arts 14.1% 24.9% 165 30.1% 8.5% Social Science & Business 22.3% 21.8% 116 21.1% 6.2%
Law 2.6% 2.3% 20 3.6% 10.1%
Science 10.0% 10.3% 52 9.5% 6.4%
Computing 6.9% 6.4% 38 6.9% 6.6%
Engineering, Manufacturing &
Construction 11.4% 11.3% 42 7.7% 4.3%
Agriculture & Veterinary 1.9% 2.5% 4 0.7% 3.3% Health & Welfare 12.6% 7.7% 56 10.2% 8.7%
Nursing 4.6% 3.5% 14 2.6% 5.2%
Services 4.6% 4.5% 6 1.1% 1.5%
Combined 3.1% 2.0% 11 2.0% 6.9%
Total 549 100.0%
Key Points:
In comparison to other students with disabilities, those in the Physical
Disability category are most underrepresented in the fields of Agriculture & Veterinary and Services.
In comparison to other students with disabilities, those in the Physical
Disability category are most overrepresented in the fields of Education Science and Law.
The institutions who responded to this question reported just 4 students in
the Physical Disability category in the field of Agriculture & Veterinary.
Students in the Physical Disability category are more than twice as likely
Students in the Physical Disability category are about 1 ½ times as likely
to study in the field of Law as the average student or student with a disability.
Students in the Physical Disability category are about a quarter as likely to
Specific Learning Difficulty – Fields of Study Breakdown
Table 10 shows the fields of study breakdown for students in the Specific Learning Difficulty Category and compares with the breakdown of total students with disabilities and total student fields of study breakdown
Specific Learning Difficulty Field of Study Breakdown - Highlighted Green/Red are Highest/Lowest % in each category
54.1% of all SWDs are in Specific Learning Difficulty Category % of Total Student s Studyin g Field % of Total SWD Studyin g Field Numbers in Specific Learning Difficulty Category Studying Field % of Students in Specific Learning Difficulty Category Studying Field % of SWDs Studying Field in Specific Learning Difficulty Category Broad Programmes 0.4% 1.1% 8 0.2% 12.7% Education Science 5.5% 1.8% 73 1.6% 46.8%
Humanities & Arts 14.1% 24.9% 866 19.4% 44.4% Social Science & Business 22.3% 21.8% 1098 24.6% 59.1%
Law 2.6% 2.3% 84 1.9% 42.2%
Science 10.0% 10.3% 388 8.7% 47.8%
Computing 6.9% 6.4% 275 6.2% 47.7%
Engineering, Manufacturing &
Construction 11.4% 11.3% 696 15.6% 72.0%
Agriculture & Veterinary 1.9% 2.5% 102 2.3% 82.9% Health & Welfare 12.6% 7.7% 323 7.2% 50.3%
Nursing 4.6% 3.5% 164 3.7% 60.5%
Services 4.6% 4.5% 305 6.8% 75.1%
Combined 3.1% 2.0% 82 1.8% 51.3%
Total 4464 100.0%
Key Points:
In comparison to other students with disabilities, those in the Specific
Learning Difficulty category are most underrepresented in the fields of Humanities & Arts and Law.
In comparison to other students with disabilities, those in the Specific
Learning Difficulty category are most overrepresented in the fields of Services and Engineering, Manufacturing & Construction.
More than three quarters of all students with disabilities studying in the
Students in the Specific Learning Difficulty Category are about 1 ½ times
Other – Fields of Study Breakdown
Table 11 shows the fields of study breakdown for students in the Other Category and compares with the breakdown of total students with disabilities and total student fields of study breakdown
Other Field of Study Breakdown - Highlighted Green/Red are Highest/Lowest % in each category
1.7% of all SWDs are in Other Category
% of Total Students Studying Field % of Total SWD Studying Field Numbers in Other Studying Field % of Students in Other Category Studying Field % of SWDs Studying Field in Other Category
Broad Programmes 0.4% 1.1% 33 23.2% 52.4%
Education Science 5.5% 1.8% 0 0.0% 0.0%
Humanities & Arts 14.1% 24.9% 9 6.3% 0.5%
Social Science & Business 22.3% 21.8% 44 31.0% 2.4%
Law 2.6% 2.3% 0 0.0% 0.0%
Science 10.0% 10.3% 5 3.5% 0.6%
Computing 6.9% 6.4% 19 13.4% 3.3%
Engineering, Manufacturing &
Construction 11.4% 11.3% 7 4.9% 0.7%
Agriculture & Veterinary 1.9% 2.5% 4 2.8% 3.3%
Health & Welfare 12.6% 7.7% 7 4.9% 1.1%
Nursing 4.6% 3.5% 2 1.4% 0.7%
Services 4.6% 4.5% 12 8.5% 3.0%
Combined 3.1% 2.0% 0 0.0% 0.0%
Total 142 100.0%
Examination Accommodations
We included a question covering the numbers of students with disabilities in the responding institutions receiving one or more exam accommodations and the kinds of accommodations received. The 25 institutions who responded to this
question9 identified a total number of 5950 of students with disabilities receiving
one or more exam accommodations in the academic year 2012/13, representing 73% of the disabled student population in these institutions, down from 76% in 2011/12.
Exam Accommodations – Disability Profile
Pro rata, the group most likely to receive an exam accommodation were students
with DCD – Dyspraxia/Dysgraphia, of whom 86% received one or more exam
[image:40.595.83.515.435.715.2]accommodations in the academic year 2012/13. They were followed closely by the Blind/Visually Impaired group (79%) and the Specific Learning Difficulty group (78%). The groups least likely to be receiving an accommodation were those with a Mental Health Condition (60%), the Deaf/Hearing Impaired (60%) and those with a Significant Ongoing Illness (63%).
Figure 6 shows the % of students in different disability categories receiving one or more exam accommodations
Exam Accommodation Types
We asked the responding institutions to provide data on the types of exam accommodations received by students with disabilities. The responses identified
three major categories of exam accommodations – those related to extra time
[image:41.595.82.515.275.544.2]given, those related to alternative venues provided to undertake the exam and other accommodations such as the use of a computer.
Figure 7 shows the numbers of students with disabilities receiving exam
accommodations in 2012/13 and the percentage they represent of total students with disabilities
Extra time given to complete an examination proved to be the most popular exam accommodation with 66% (5369) (down from 73% in 11/12) of all students with disabilities in the responding institutions receiving extra time in examinations in 2012/13, representing 90% of all SWDs that received one or more exam
Extra Time Breakdown
Of the 5369 students with disabilities who received extra time in their
[image:42.595.102.488.278.444.2]examinations, 4938 (92% of those who received extra time) received an extra ten minutes per hour in their exams; 377 (7% of those who received extra time) received an extra 15 minutes per hour; 50 (1% of those who received extra time) received an extra 20 minutes per hour; and just 4 (0.1% of those who received extra time) received more than an extra 20 minutes per hour.
Figure 8 shows the number of students with disabilities receiving varying amounts of extra time per hour in examinations in 2012/13
Alternative Venue Breakdown
Of the 4194 students with disabilities who took their examinations in an alternative venue; 2243 (53%) took their exam in a Large or Low Distraction Venue; 1152 (27%) took their exam in an individual centre and 799 (19%) took their exam in another type of alternative venue.
[image:42.595.152.447.592.742.2]Inside the Service
AHEAD asked responding institutions to provide information about the numbers of staff with responsibility for supporting students with disabilities and the number of learning support staff employed by the responding institutions. Responses were delivered as a decimal number where one full time (5 days a week) staff member = 1, and part-time staff members were included as a pro rata fraction of that. For example, a college with one full time staff member working 5 days a week and one part time staff member working 2 days a week would report 1.4 staff members. We decided this number would be best represented as number of students per staff member registered with the disability service. Where staff members had shared responsibility over students with disabilities as well as other student groups, they were asked to estimate how much of their remit was
dedicated to students with disabilities.
The responding institutions reported an average of 137 students per disability support staff member with responsibility for students with disabilities (up from 131 in 11/12) and 329 students per learning support staff member (up from 319) in 11/12). If we combine these figures, we get an average of 97 students per staff member (up from 93 in 11/12). In the combined figure, the University sector report an average of 103 students per staff member and the IT sector report an average of 90 students per staff member.
Dyslexia Screenings
AHEAD also tried to gauge the number of students referred for specific learning difficulty screenings by the responding institutions and the diagnosis rate
resulting from these screenings. The 24 institutions that responded to this
question10 reported that 421 students were referred for dyslexia screening in
2012/13 (up from 403 11/12), of which 240 were successfully diagnosed, representing a 57% rate of successful diagnosis.
On the Ground
The questionnaire sent to institutions also contained a question designed to gauge the opinion of Disability/Access Staff in the responding institutions on whether the attitude of academic staff in their institutions to incorporate inclusive teaching methods in their course delivery was improving. Each respondent was asked to answer either yes or no and then given the opportunity to elaborate. The question is transcribed below, along with details of the responses and a
[image:44.595.85.512.274.555.2]representative selection of the comments provided.
Figure 10 shows the percentage breakdown of the yes and no answers received to the 'on the ground' question asked in the survey
Question: Over the past three years, have you seen a marked improvement in the willingness of academics to incorporate inclusive teaching methods into their
lecture delivery? – Responses provided: 23, Yes: 83%, No: 17%
On the Ground - Respondents Comments:
“There is a greater level of awareness amongst academic staff; many are
becoming much more open to inclusive education initiatives.”
“There has been a marked improvement in support for access / disability.
Initiatives are supported via the Access Working Group, the Teaching and