Performance analysis of a prototype small scale electricity-producing biomass cooking stove
1
2
S. M. O’Shaughnessy1, M.J. Deasy1, V. Doyle2, A.J. Robinson*1
3
4
1Department of Mechanical & Manufacturing Engineering, Parsons Building, Trinity College Dublin, Ireland.
5
2Concern Universal, Plot No. LK 367, Michuru Road, Blantyre, Malawi.
6
*Email: [email protected]
7
*Tel: +353 1 896 3919
8
9
Abstract
10
An electrical generator has been integrated with a locally produced, biomass-fed clay cooking stove in rural Malawi. The
11
generator produces small amounts of electricity based on the thermoelectric effect. Five demonstrator stoves were
12
deployed into a rural community in the Balaka district for up to 6 months. This study investigates the power generation
13
performance of the devices over the first 80 days of the field trial. It was determined that the users were able to charge
14
mobile phones, lights and radios from the generator stoves. The power generating performance of the stoves deteriorated
15
slightly over the 80 day period. The was due to the effects of thermal cycling on the generator system as a whole which
16
caused eventual drying out of the thermal paste and a loosening of the clamping nuts which reduces clamping pressure
17
and power output. One stove failed due to a mechanical problem. It was found that the power produced significantly
18
exceeded the power consumed in most cases, which indicates an over-supply. It appears that 3 W·h is sufficient to meet
19
the average daily electrical power requirements for the participants in this study. The data obtained from the field trial
20
has been used to inform a redesign of the device for a second field trial.
21
22
Keywords
23
Biomass; cooking stove; thermoelectric; electricity generation; phone charging; Malawi
24
25
1. Introduction
26
In their 2010 Energy Poverty report the OECD/IEA
27
estimated that investment of $36 billion per annum was
28
necessary to ensure that every citizen in the world
29
benefits from access to electricity and clean cooking
30
facilities by 2030 [1]. The report also stated that new
31
dedicated policies were required if the conditions for the
32
lives of billions of people are to improve. However, to
33
make key decisions regarding the welfare of their
34
citizens and help refine policies over time,
policy-35
makers rely on quantitative information and analysis [1].
36
37
Globally, approximately 1.4 billion people lack access
38
to electricity with the vast majority living in rural areas.
39
Furthermore, the number of people depending on the
40
traditional use of biomass is projected to reach 2.8
41
billion by 2030 [1]. The problem is particularly evident
42
in sub-Saharan Africa where the electrification level is
43
only 31% and 80% of people burn biomass as their
44
primary source of household energy [1].
45
46
Thermoelectric generators have recently been
47
investigated as a method of electricity generation from
48
biomass burning. The use of thermoelectric generators
49
for waste heat to electricity conversion is not new, but
50
perhaps is only now becoming more evident in everyday
51
applications. For example, Codecasa et al. [2, 3] recently
52
developed a 5 W, 12 V TEG system with the goal of
53
powering an autonomous gas heater for commercial
54
outdoor use. To date, TEGs have been predominantly
55
limited to low power demand systems, but larger scale
56
studies have also been carried out, such as those by
57
Doloszeski and Schmidt [4] who investigated the use of
58
a large thermoelectric module in combination with a
59
fluidised bed combustor to obtain up to 450 W of
60
electrical power.
61
62
Much of the research investigating the potential for
63
TEGs in low temperature waste heat harvesting has been
64
laboratory based, such as studies by [5-7]. Although the
65
concept of integrating thermoelectric generators with
66
cooking stoves has been investigated, many studies have
67
focussed on optimising the TEG output under fixed
68
parameters [8]. Although this method does offer
69
valuable information on the performance of the
70
generator, the test conditions are typically strictly
71
controlled and the heat source in many cases is derived
72
from an electrical power supply rather than the more
73
erratic conditions encountered in a live fire.
74
75
Of those researchers who experimentally investigated
76
TEG integration into a working stoves, Killander and
77
Bass [9] were some of the earliest. In their study in an
78
isolated home in northern Sweden, a thermoelectric
79
generator was connected to a wood-fed stove. Using two
80
Hi-Z HZ20 modules cooled by a 12 V, 2.2 W fan, their
81
prototype was capable of producing up to 10 W in the
82
cold mornings, with 4~7 W produced as the house
83
became warmer during the day. The output voltage from
84
the TEGs was boosted to 13.5 V by a DC/DC converter
85
and the generated power was sufficient to operate the
86
cooling fan and charge four 6 V batteries. These
87
batteries were connected in series/parallel to maintain a
88
12 V output to provide some electric light and supply
89
some television during the night.
90
91
Sawyer et al. [10] designed a thermoelectric module
92
coupled with a Haitian cooking stove. The primary
93
intention was to increase the efficiency of the stove by
94
rerouting the TEG cooling air to the combustion
95
chamber. The minimum requirement of the generator
96
was to power its own cooling fan. The authors also
97
intended to charge a battery pack which would allow the
98
fan to run at start-up without TEG power, and to charge
99
a secondary battery pack that would be able to power
devices connected via USB A Taihuaxing module
TEP-101
1264-1.5 was used which could produce up to 4 W at a
102
temperature difference of 200 °C. It was discovered that
103
halving the flow rate of air into the combustion chamber
104
had minimal effect on the time to boil 2 litres of water,
105
but noticeably affected the cooling of the TEG. Indeed,
106
the design relied on the fan running at the maximum
107
flow rate at all times. In their experiments the desired
108
temperature differential of 200 °C could not be achieved
109
due to rising cold side temperatures. The authors
110
determined that the main issue with the system was how
111
the limited power provided by the thermoelectric
112
module was budgeted between the components and
113
loads.
114
115
Champier et al. [11, 12] investigated using the exhaust
116
gases stream from an energy efficient mud cooking
117
stove as the heat source for a thermoelectric generator.
118
An experimental rig was setup initially using a 2.2 kW
119
butane gas burner. Using four bismuth telluride
120
thermoelectric modules (Taihuaxing Co. Ltd
TEP1-121
12656-0.8, max. 10.5 W at matched load) the authors
122
obtained between 1.7 W and 2.3 W per module at an
123
approximate module temperature difference of 160 °C
124
and a total of 7 W was generated. Citing the clamping
125
pressure as one of the main reasons for the low power
126
output, the authors made improvements to the generator
127
design in what was called the “TEGBois II” and
128
included a fan to replicate the gas temperatures and flow
129
speeds in the stove. With a moving airstream at
130
approximately 400 °C and maximum power point
131
optimisation of the DC-DC power conversion [13], the
132
authors obtained much improved power output and an
133
energy efficiency for the electrical conversion of over
134
90%.
135
136
Goudarzi et al. [14] designed a multifunction device
137
capable of producing a considerable amount of
138
electricity as well as hot water. The prototype stove was
139
equipped with baffles and a post-combustion chamber
140
which ensured more complete burning of the exhaust
141
gases by returning them to the hottest part of the firebox.
142
At low stove temperatures, combustion was aided by a
143
1 W fan to aerate the fire. 21 thermoelectric modules
144
(TEP1-12656-0.6) were used, each one connected by its
145
hot side to a 50 mm-long aluminium piece which in turn
146
was attached to the stove body. In this way the upper
147
temperature limit of the TEGs was not exceeded. The
148
modules were divided into seven groups of three, each
149
connected electrically in series. Each TEG was cooled
150
via a water-filled aluminium block, through which the
151
water flow rate could be adjusted. The authors tested in
152
an open environment and experimented with different
153
fuel consumption rates, ultimately producing an average
154
of 7.9 W for each module when charging with 9kg
155
firewood per hour.
156
157
Raman et al. [15] described the development, design and
158
performance analysis of a forced draft clean combustion
159
cookstove powered by a single thermoelectric module
160
capable of producing 5W at matched load. The power
161
produced by the TEG was to power the blower to
162
provide a clean combustion and reduce indoor air
163
pollution. Since the authors obtained a maximum of
164
4.5W from the TEG and less than 1W was needed to
165
power the blower, the remaining power was used for
166
mobile phone charging and LED lighting.
167
168
Recently, the present authors described the design,
169
laboratory testing, and field trial testing of an electricity
170
producing cooking stove [16, 17] along with the
171
development of appropriate charge control circuitry
172
[18]. Results are discussed in the context of laboratory
173
tests with the view of verifying the efficacy of the
174
technology and provide a context within which actual
175
use in field trials can be assessed. Ref. [17] outlined the
176
deployment and preliminary results of a field trial,
177
whereby five stoves with TEG generators and five
178
without were equipped with data logging equipment and
179
use behaviour was monitored for 80 days. This paper
180
focussed primarily on behavioural aspects of the field
181
trial participants including energy supply and demand.
182
Here it was found that the technology was used as
183
intended and provided sufficient, if not an abundance of
184
electrical energy that was used by the participants to
185
charge phones and LED lanterns for the duration of the
186
field trial.
187
188
Many of the studies described above have application in
189
the developing world. Including these studies, there still
190
exists little information in the literature regarding the
191
long or even short term performance of cooking stoves
192
fitted with thermoelectric generators when used by the
193
people they are designed for. Typically, laboratory and
194
field performance will differ, and one can be confronted
195
with problems in the field that were unforeseen or never
196
encountered in a laboratory setting. This research aims
197
to address some of the unknown issues with the help of
198
rural communities in Malawi: for example, it is
199
unknown how long rural villagers in Malawi use their
200
cooking stoves each day. Including a TEG generator
201
could alter their normal behaviour. Another question
202
that must be addressed is the cost and quantity of energy
203
necessary to make a meaningful impact on the lives of
204
the target beneficiaries [19, 20]. Much of the
205
information to date on these topics has been gathered in
206
survey form which may be, in some cases, unreliable.
207
Yet accurate information of this kind is crucial to
208
adequately design a TEG-stove that meets the basic user
209
requirements. Using the approach adopted in this study,
210
it is possible to obtain quantitative rather than qualitative
211
data on TEG-stove performance and usage.
212
213
This study is the third and final of a series of papers
214
starting with the current TEG-stove design concept [16],
215
its use in a field trial and subsequent participant
216
behaviour [17] continuing now to a more focussed
217
analysis on the thermal and energy performance
218
characteristics of the TEG system itself during the field
219
trial. It is envisaged that this work will inform those who
220
are contemplating similar thermoelectric technologies
221
for developing world applications.
222
223
1.2 Stove selection
224
In terms of fuel consumption and efficiency, the
225
chitetezo mbaula cooking stove is an improvement of up
to 43% on the traditional ‘three stone fire’ method of
227
cooking [21]. Concern Universal Malawi has been
228
involved in the production and marketing of nearly
229
20000 chitetezo stoves since 2008 [16]. This stove was
230
selected for integration with the TEG generator because
231
of its familiarity within the rural communities, and also
232
because its portability presented a technical and design
233
challenge. Recently, the government of Malawi
234
committed to introducing two million cleaner cooking
235
stoves nationwide by 2020 [22].
236
237
2. Overview of Thermoelectricity
238
Thermoelectric generators, or TEGs, are solid state
239
energy devices which convert heat directly into
240
electricity by means of the thermoelectric effect. An
241
overview of thermoelectricity is provided by Rowe [23],
242
and Hodes [24]. One of the problems encountered when
243
predicting TEG module performance is that the
244
theoretical material properties are typically better than
245
the practical ones. The model adopted in this study is
246
described in detail in [16] and [18] and uses the method
247
employed by Hsu and Huang [25]. This method, known
248
as the effective Seebeck coefficient model, calculates
249
the parameter α under zero load (i.e. open circuit
250
condition), but also imposes realistic temperature and
251
pressure conditions to the module to assess its behaviour
252
in practical scenarios. This is necessary since the TEG
253
performs differently under load conditions, and this
254
model improves significantly upon the standard model
255
which requires detailed knowledge of the internal
256
geometry of the TEG. The effective Seebeck coefficient,
257
αeff, is calculated by applying a fixed temperature
258
difference across the TEG and varying the load
259
resistance. The power is obtained from Equation 1.
260
261
𝑃𝑒𝑙𝑒𝑐 = (𝛼𝑒𝑓𝑓∆𝑇)
2 𝑅𝐿
(𝑅𝐿+ 𝑅𝑇𝐸𝐺)2 (1)
262
Theoretically, maximum power is obtained when the
263
TEG resistance matches the load resistance; i.e. when
264
RTEG = RL. Some specifications for the thermoelectric
265
module used in the field trial are provided in Table 1.
266
267
Table 1: TEG1-12610-5.1 supplier specifications
268
Dimensions 40mm x 40mm
Open circuit voltage 8.4 V
Internal resistance 3 Ω
Match load output voltage/current 4.2 V / 1.4 A Match load max. output power 5.9 W Heat flow through the module ~ 140 W
269
The TEG is used as a power source to power its own
270
cooling fan and to charge in parallel a rechargeable
271
lithium-iron-phosphate (LiFePo4) battery, specifically
272
the ANR26650 cylindrical cell manufactured by A123
273
Systems. LiFePo4 batteries are known for their good
274
safety characteristics and long life cycles. Some battery
275
specifications are provided in Table 2.
276
277
Table 2: LiFePo4 battery specifications
278
Cell dimensions (mm) ϕ 26 x 65
Cell capacity, nominal/minimum (Ah) 2.3/2.2
Voltage, nominal (V) 3.3
Max. continuous discharge (A) 70 Operating temperature (°C) -30 ~ 55
Typical cycle life >1,000
279
280
3. Generator & electronic circuit design
281
The stove is estimated to produce 3 kW, of which an
282
estimated maximum 140 W is extracted for the
283
generator. A visual inspection of the stove is performed
284
before a fire is created in the stove to check for cracks
285
during thermal expansion. To install the generator, a
286
hole is made in the side wall of the stove. The handles
287
of the stove remain intact to ensure portability. The
288
generator is assembled and installed as a single unit. The
289
thickness of the walls is such that removing a small
290
section does not noticeably weaken or damage the stove.
291
From this point onwards the term ‘generator’ refers to
292
the whole system: heat collection, TEG and cooling.
293
294
3.1 Heat collection and dissipation
295
The TEG is located between two 50x50x3 mm copper
296
plates. Calibrated K-type thermocouples are inserted
297
into these plates to estimate the temperature difference
298
across the module. On the hot side of the TEG is a
299
second copper plate, out of which three copper rods
300
protrude into the combustion chamber. The rods deliver
301
heat to the TEG, but are primarily intended to be used as
302
a grate to aid combustion by allowing air to be drawn
303
into the stove under and up through the fuel.
304
305
The copper plate on the cold side of the TEG is
306
thermally connected to a commercially available heat
307
pipe heat sink, normally used in CPU cooling (Arctic
308
Cooling Freezer 13). This heat sink consists of four
u-309
shaped 6 mm diameter copper heat pipes and 45
310
aluminium fins. The 92 mm diameter fan supplied with
311
this heat sink operates at 12 V and consumes up to 2.2
312
W of electricity which is 37% of the maximum power
313
that the chosen TEG can produce at a cold side of 80°C.
314
Instead, the impeller from this fan is dismantled from the
315
motor and connected to a low power DC motor which
316
can run the fan from 0.3 V and consumes typically up to
317
0.5 W since the circuit voltage rarely exceeds 5 V. Since
318
the fan will begin to rotate from very low TEG voltages,
319
it eliminates the necessity to charge a battery pack which
320
would allow the fan to run at start up without TEG
321
power, a problem encountered by Sawyer et al. [10]. The
322
cooling capacity of the fan is somewhat reduced, but
323
adequate cooling can still be achieved with a much
324
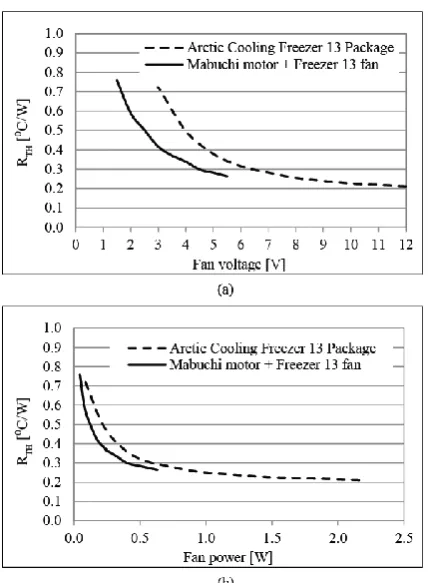
lower power drain as shown in Figure 1.
325
Figure 1: Thermal resistance of Arctic Cooling Freezer 13 heat sink with 100 W heat input versus
(a) fan supply voltage and (b) fan supply power
327
A thin sheet-metal skirt is placed on the inside of the
328
stove. The sheet serves several purposes by preventing
329
some heat from escaping to the walls of the stove, and
330
also by reflecting this heat back to the centre of the
331
combustion chamber. It also protects the TEG module
332
from direct exposure to the fire. A sketch and
333
photograph of the generator assembly is provided in
334
Figure 2. Thermally conductive paste is used at each
335
contact face to reduce contact resistances. The
336
integration with the stove is provided in Figure 3.
337
338
Figure 2: Heat collection and dissipation design
339
Figure 3: Integration of generator with chitetezo mbaula: (a) outside view and (b) inside the stove
340
As mentioned previously, the TEG is positioned
341
between two copper plates. The clamping pressure
342
affects the electrical output. For example, in their
343
laboratory experiments Rinalde et al. [8] found that in
344
some cases there was a 100 % change in output power
345
with increasing clamping pressure. At an apparent TEG
346
temperature difference of 200 °C, their TEG output was
347
35% below the value claimed by the manufacturer.
348
Increasing the pressure on the TEG should, in theory,
349
decrease the contact resistances and reduce the
350
difference in apparent and actual temperatures across the
351
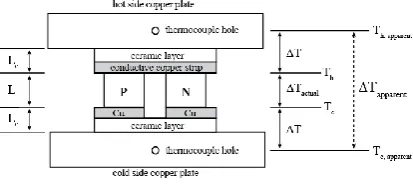
TEG, as shown in Figure 4.
352
353
354
355
356
357
[image:4.595.320.531.56.323.2]Figure 4: Apparent and actual temperatures across the TEG
359
The pressure must be applied evenly on both sides of the
360
thermoelectric module. Slight pressure variations across
361
the surfaces are enough to crack the brittle ceramic layer.
362
Since the thermo-elements are connected electrically in
363
series to provide the output, the device cannot usually
364
withstand the breakage of even a single thermocouple.
365
For the TEG module used in this study, a clamping
366
torque of 1 N·m per 50mm M5 bolt was used.
367
368
3.2 Battery charging circuitry
369
The power produced by the TEG is primarily used to
370
charge a 3.3 V lithium iron phosphate (LiFePO4) battery,
371
termed the ‘primary’ battery henceforth. The circuitry
372
used to charge the lithium-iron-phosphate battery is
373
quite simple, and has been specifically designed to be
374
so. Several researchers such as [26-28] have
375
investigated maximum-power-point-tracking (MPPT)
376
techniques to ensure that the load resistance and internal
377
resistance of the TEG are matched at all times.
378
However, previous studies using this simple circuit have
379
shown that the system approaches the maximum power
380
point when the temperature difference across the TEG is
381
close to or above 150 °C [17, 18], provided no external
382
load is connected to the circuit. At these TEG
383
temperature differences, the primary battery resistance
384
and the internal resistance of the TEG are better matched
385
and can result in output powers similar to that achieved
386
using MPPT methods.
387
388
A circuit diagram is provided in Figure 5. The circuit
389
includes the following features:
390
0.005 Ohm sense resistors enable the
391
calculation of the current and power produced
392
by the TEG and consumed through the USB
393
port by measurement of the voltage drop across
394
the resistor.
395
A Schottky diode prevents the battery from
396
discharging to the TEG. The Schottky diode
397
has a small voltage drop across it, and
398
consumes up to 0.4 W at full TEG power.
399
A 3.9 V Zener diode prevents battery
400
overcharge by bypassing the battery when the
401
battery nears full charge. Unfortunately this
402
particular Zener represents a significant power
403
loss as it leaks current from voltages as low as
404
3 V.
405
A thermal switch open-circuits the battery if
406
the battery temperature exceeds 60 °C.
407
Two pairs of indicator LEDs are installed on
408
the front panel of the circuit box, facing the
409
user as they operate the stove. Red LEDs
410
indicate when the TEG voltage is sufficient to
411
charge the battery. Green LEDs indicate full
412
charge.
413
A DC–DC converter boosts the output voltage
414
to a more useful 5 V, and is connected to a
415
single male USB port.
416
[image:5.595.65.272.57.152.2]417
Figure 5: Primary battery charging circuit
418
3.3 Laboratory testing of TEG-stove performance
419
Several experiments were performed in a laboratory
420
setting prior to the field trial [16]. The results from these
421
experiments showed that the TEG could produce a
422
power output up to 5.9 W when integrated with a stove,
423
which is in agreement with the manufacturer’s
424
specifications. To produce maximum power from the
425
TEG module used in this study, a TEG temperature
426
difference of over 200 °C is required. In addition, the
427
cold side TEG temperature should be as low as possible.
428
Furthermore, maximum power is generated from a TEG
429
only when its internal resistance matches that of the
430
load.
431
432
Before the TEG-stoves were deployed to the field, it was
433
necessary to investigate whether the inclusion of the
434
generator affected the performance of the chitetezo
435
mbaula. A series of water boil tests (WBTs) was
436
performed in a controlled setting using both the normal
437
stove and one with the TEG generator. In each
438
experiment, an aluminium saucepan of water containing
439
the same volume of liquid was brought to the boil. All
440
tests started with 30g of wood kindling and 10g of
441
tinder, all from the same wood source. All fuel to be
442
added was weighed prior to the start of the experiment.
443
The experiment consisted of 3 phases:
444
1. High power from a cold (ambient) start up
445
2. High power test from hot start up
446
3. Low power simmer
447
448
The following parameters were measured/calculated:
449
time to boil, burning rate, thermal efficiency, specific
450
fuel consumption and firepower. Results from these
451
experiments showed that both stoves displayed a
452
thermal efficiency of 18~20% and a firepower of
453
3.1~3.3kW when averaged over the three test phases.
454
These values were repeatable over several experiments.
455
There was no significant consistent deterioration or
456
improvement in energy performance with the inclusion
457
of the generator.
458
459
An estimated maximum 140 W of heat is extracted for
460
the generator. There is likely also some minor heat
461
losses due to the design. The thin sheet metal skirt
included with the generator may offset these energy
463
losses by limiting the heat transfer to the stove walls, as
464
shown in [16]. Also, it must be noted that the WBT is
465
not a perfect measurement of stove performance. Indeed
466
one of the desired outcomes from field testing the
TEG-467
stove is that users’ perceptions on stove performance
468
can be obtained.
469
470
3.4 Data acquisition during field trial
471
Each generator stove was equipped with data loggers
472
which record the temperature in the stove wall and
473
combustion chamber, the approximate temperature on
474
either side of the TEG and the TEG voltage. Calculation
475
of the TEG current and the current drawn via the USB
476
was achieved by recording the voltage drop across two
477
0.005 Ohm sense resistors. All data loggers recorded for
478
the entire duration of the trial at the selected recording
479
rate of one reading per minute.
480
481
4. Results & discussion
482
Five generator stoves were deployed in Malawi to the
483
‘treatment group’ village of Mponda, Balaka. A further
484
five ‘control group’ stoves without TEG generators were
485
deployed in the nearby village of Dulani, Balaka. The
486
control group was used to assess if there was a
487
significant difference in stove usage behaviour between
488
those with a TEG-stove and those without. Nine stoves
489
remained logging in the field for up to 80 days.
490
491
4.1 Stove usage
492
There exists little quantitative data on cooking stove and
493
fuel usage in the developing world. A potential negative
494
side effect of TEG-stove generator is that the users may
495
increase their normal stove usage to produce electricity.
496
This is not due to excessive amounts of heat being
497
removed; rather the users’ perception that burning more
498
fuel leads to more electricity. It was stressed to the users
499
that electricity would be produced under normal
500
operating conditions but inevitably there would be some
501
behavioural alteration, if only at the beginning of the
502
trial. Unfortunately, no prior information was available
503
on the typical stove usage for the participants in this
504
study, although this will be rectified in future studies.
505
506
Figure 6 plots the usage for both the treatment and
507
control groups. To identify ‘usage’, the data recorded by
508
the combustion chamber thermocouple is analysed. If
509
the thermocouple reading is above 100 °C, the stove is
510
deemed to be ‘in use’. This value was chosen because at
511
this hot side temperature the TEG begins to generate
512
notable power. It is unknown if the field trial participants
513
were actively tending to the stove however, or indeed if
514
they were operating it for a specific purpose. However,
515
since the temperature in the combustion chamber at the
516
thermocouple location drops very quickly when fuel is
517
not being burned, Figure 6 at least indicates the length
518
of time the participants burned fuels in the data-logged
519
stoves.
520
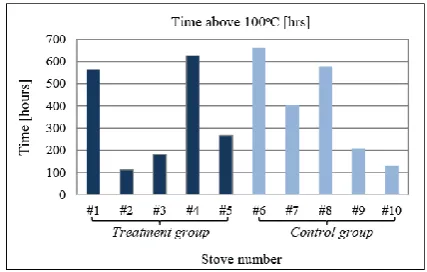
[image:6.595.318.532.55.191.2]521
Figure 6: Stove usage during the field trial
522
The figure plots the total number of hours above 100 °C
523
for all stoves. Interestingly, two stoves from each of the
524
groups are used more frequently, and indeed a control
525
group stove displays the most usage. Although the
526
sample number is too small to make generalisations, it
527
would appear that prolonged stove usage is normal and
528
not merely due to the inclusion of the generator. For
529
example, it has been shown that some control group
530
participants used the stove for up to 18 hours on a
531
particular day, with average usage never lower than 4
532
hours per day [17]. Nevertheless, for a true indication of
533
the effect of the TEG-stove generator on user behaviour,
534
a pre and post-intervention study should be performed.
535
536
It was also noted by Concern Universal field facilitators
537
that many participants had more than one stove,
538
sometimes operating two or more at the same time.
539
These stoves may also have been of different type, as
540
users tend to have a preference for a particular stove
541
based on their cooking needs (e.g. second stoves used
542
just for boiling water were observed). Table 3 and Table
543
4 display the total amount of days during which the
544
supplied stoves were not in use.
545
546
Table 3: No. of days TEG-stove is not in use
547
Stove #1 #2 #3 #4 #5
Total 5/80 13/30 33/80 1/80 22/80 % of days 6.3 43.3 41.3 1.3 27.5
548
Table 4: No. of days control group stove is not in use
549
Stove #6 #7 #8 #9 #10
Total 0/77 20/77 0/77 25/77 41/77
% of days 0 26 0 32.5 54.3
550
Figure 7 displays the erratic usage of stove 4 as an
551
example. This behaviour is typical of all stoves in the
552
study, and reinforces the likelihood that other cooking
553
stoves are used, and that cooking times will likely vary
554
depending on food types. It was feared that TEG-stove
555
usage may drop off after the initial excitement of having
556
a new technology but this appears not to be the case.
557
Stove usage varied for all stoves - both in the treatment
558
and control groups - throughout the field trial.
559
Figure 7: TEG-stove 4 usage during field trial
561
4.2 TEG temperatures during trial
562
Prolonged stove usage could have an effect on TEG
563
performance, particularly on its life cycle if the TEG
564
experiences frequent, large temperature cycles during
565
the day. Mastbergen [29] describes the thermal stresses
566
which can cause fatigue and ultimately cracking or
567
separation of the interface between the thermo-elements
568
and the conductive strip. This leads to an increase in
569
electrical resistance, sometimes after just a few hundred
570
cycles.
571
572
The chosen TEG in this study has a maximum
573
continuous operating temperature of 270 °C, with
574
intermittent cycling up to 300 °C allowed. Figure 8 plots
575
the maximum hot and cold side temperatures and the
576
maximum TEG temperature difference that occurred
577
during the field trial. Only TEG-stove 2 greatly
578
exceeded 300 °C during the trial and this is discussed in
579
a separate subsection.
580
581
582
583
584
Table 5 shows that two other TEG-stoves only briefly
585
exceeded the maximum recommended hot side
586
temperature, meaning that the generator was well
587
positioned to limit the hot side temperature. The
588
temperatures recorded by the thermocouples are likely
589
different to the actual temperatures across the TEG’s
590
thermo-elements (cf. Figure 4 previously).
591
592
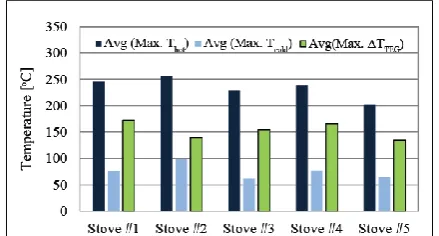
Figure 8: Maximum apparent TEG temperatures
593
594
595
[image:7.595.61.279.60.199.2]596
Table 5: Time TEG hot side was above 300 °C
597
Stove #1 #2 #3 #4 #5
Total [mins] 3 301 0 5 0
598
599
Ideally, the TEG would operate continuously at 270 °C
600
hot side with the cold side temperature as low as possible
601
but this is not realistic for the given design. The
602
temperatures in Figure 8 represent the maximum
603
readings over the whole trial, whereas Figure 9 displays
604
the average of the daily maximum temperatures. This
605
provides an indication of how often the generator
606
approached its ideal operating point. TEG-stoves 1, 2
607
and 4 had average maximum daily hot side temperatures
608
of almost 250 °C, while stoves 3 and 5 were slightly and
609
considerably lower respectively. The hot side
610
temperature is obviously affected by the fuel type,
611
presence of flames and stoking methods, but also by the
612
location of the generator in the stove. Small changes in
613
the distance measured from the centre of the stove to the
614
TEG can have a significant impact on the hot side
615
temperature. For example in this design, fixing the
616
generator 15mm further away from the centre of the
617
stove resulted in a 30 °C reduction. In an attempt to
618
achieve consistency in the stove manufacturing process,
619
paddle moulds are now being used by the stove making
620
groups in Malawi. It is conceivable that the hole for the
621
generator could be incorporated at this stage, which
622
would allow for greater accuracy and consistency in the
623
positioning of the generator.
624
625
Returning to Figure 9, in all cases the average of the
626
daily maximum cold side temperature was less than 100
627
°C. This temperature limit is significant as it may be a
628
limit for any potential passive water-based cooling
629
solutions. Clearly, to justify the use of a power draining
630
fan-based approach, the cooling system must be capable
631
of lowering the cold side temperature below 100 °C.
632
[image:7.595.318.538.534.652.2]633
Figure 9: Average of maximum TEG temperatures
634
The figure also plots the average maximum TEG
635
temperature difference. As mentioned previously, this
636
circuit achieves close to the maximum power point from
637
ΔTTEG ≥150 °C. From the figure, three of the five TEG
638
stoves appear to reach this value regularly. It must be
639
noted that it is still desirable to have the same ΔTTEG at
640
a lower cold side temperature as this will produce more
641
power. The cold side temperature is affected by heat
[image:7.595.62.276.604.720.2]exchanger fouling due to food spillage as seen in Figure
643
10. This was noticeable upon field visits during the trial
644
and upon data collection at the end of the trial period.
645
[image:8.595.318.535.54.344.2]646
Figure 10: Fouling of (a) the heat sink and (b) the cooling fan
647
4.2.1 Failure of TEG-stove 2
648
From Figure 8 it can be seen that TEG-stove 2 exceeded
649
350 °C on the hot side, which was as a result of this stove
650
failing during the field trial. The point of failure
651
occurred on the 31st day of the field trial during the third
652
usage period of the day as seen in Figure 11. The reason
653
for the malfunction was heat sink failure (see Figure 12).
654
The temperature of the cold side of the TEG rose to
655
approximately 150 °C on this day. Interestingly, it was
656
not caused by excess heat flow through the TEG since
657
the hot side temperature of the TEG was only just above
658
200 °C at the time. The failure was due to the breakdown
659
of the heat exchanger solder at the contact point between
660
the heat pipes and their base plate. This meant that the
661
heat transported through the TEG could not pass to the
662
heat exchanger effectively, which ultimately caused
663
overheating of the TEG until failure occurred. The
664
cooling fan and circuit have subsequently been tested
665
and operated as normal which reinforces the idea that the
666
failure was purely mechanical.
667
668
Figure 11: TEG-stove 2 temperatures on day 31, showing (a) the three cooking periods and (b) the rise in cold side TEG temperature during the final
cooking period.
[image:8.595.302.537.55.609.2]669
Figure 12: TEG-stove 2 malfunction due to failure of the solder connection of the heat pipe base
670
The cause of the solder breakdown is likely due to how
671
the generator was mounted to the stove. The mounting
672
bolts apply pressure on the heat pipes, while the
673
clamping of the TEG applies pressure on the plate the
674
heat pipes are soldered to. This soldered connection is
675
therefore the weakest link where mechanical failure can
676
occur if the generator is accidentally knocked or
677
dropped. Unfortunately, using this heat sink means that
678
the generator protrudes significantly from the stove
679
wall. TEG-stove 2 was replaced by a new, non-data
680
logged stove generator for the remainder of the trial and
681
operated without problems.
682
[image:8.595.62.276.107.255.2]4.3 TEG real-life performance
684
Figure 13 displays the maximum output power
685
generated by each TEG-stove during the 80 day field
686
trial. Due to the high ambient air temperature and
687
increased sunlight exposure in Malawi it was expected
688
that power generation would be less compared with
689
experiments performed in Dublin. Despite this, four of
690
the five generators produced near to or more than 5 W
691
which shows that the generators could perform
692
reasonably well under real life conditions.
693
694
The figure also plots the average of the daily maximum
695
power generated by each TEG-stove. Stoves 1 to 4
696
approached 4 W regularly whereas stove 5 produced less
697
than 3 W of power. This can be linked to the temperature
698
plots in Figure 9 where it was shown that stove 5 had an
699
average daily maximum hot side temperature of only
700
200 °C, with an average daily maximum ΔTTEG ≈ 130
701
°C. This indicates that the field trial participants are not
702
regularly creating the conditions to generate the
703
maximum achievable power from the generators. From
704
observations made in the field and comments from the
705
field facilitators, it is noted that users regularly leave the
706
fire unattended which could account for the power
707
deficit.
708
709
Figure 13: Maximum and average maximum power generated by each TEG-stove during the field trial
710
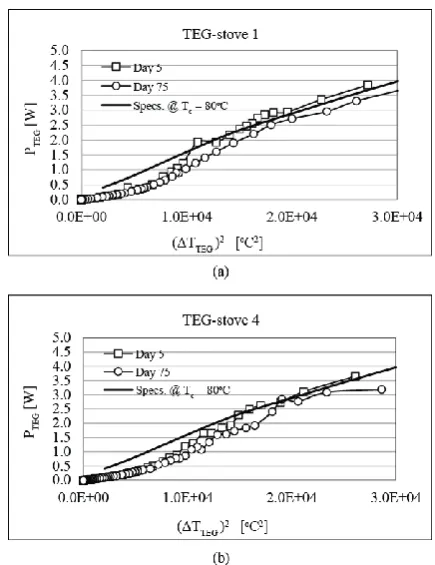
To establish if TEG output deteriorated over time, the
711
power generated for each TEG was studied at the
712
beginning and end of the field trial. For TEGs, output
713
power is proportional to the square of the temperature
714
difference. Figure 14 plots this comparison for
TEG-715
stoves 1 and 4 which were the most frequently used
716
stoves. Also in the figure is data corresponding to the
717
manufacturer’s specifications for this TEG when the
718
cold side is maintained at 80 °C. The reason for not
719
pursuing a MPPT technique can be seen. At larger
720
temperature differences the power output from the TEG
721
is close to the manufacturer’s specifications, though at
722
lower temperatures the output power is less than
723
optimum as the load is not matched to the internal
724
resistance of the TEG. This is discussed further in ref.
725
[17]. From the figure there appears to be a small
726
decrease in output power over time for both generators.
727
The cause of this decrease is not merely due to thermal
728
cycling of the TEG itself, rather its effect on the
729
generator system as a whole. In particular, thermal
730
cycling seems to cause a pumping effect and eventual
731
drying out of the thermal paste. There can also be
732
noticeable loosening of the clamping nuts which reduces
733
clamping pressure and power output. This behaviour
734
was also noted by Mastbergen [29], but it is important to
735
note that these issues could be remedied with simple
736
maintenance by trained personnel.
737
[image:9.595.317.535.150.433.2]738
Figure 14: TEG power output over time for (a) TEG-stove 1 and (b) TEG-TEG-stove 4
739
4.3.1 Direct -vs- primary battery charging
740
Efficiency is defined as the power output to the load
741
relative to the power generated by the TEG. Due to the
742
power consumed by the fan, Schottky and Zener diodes
743
and other circuit components, approximately 60% of
744
the power generated from the TEG can be stored in the
745
battery when no external load is connected to the USB
746
port, though the charge level of the battery does have
747
an impact on this figure [16]. The field trial
748
participants were provided with a USB cable and an
749
LED lantern as well as multiple connectors for mobile
750
phones. In the interests of safety, and particularly
751
because small children are frequently with the stove
752
users, it was recommended to the participants that they
753
charge when the stove was not in use, i.e. to use the
754
energy stored in the primary battery. Understandably,
755
the users charged at their convenience and the results in
756
757
Table 6 highlight this.
758
759
760
[image:9.595.63.277.354.496.2]762
[image:10.595.320.534.54.189.2]763
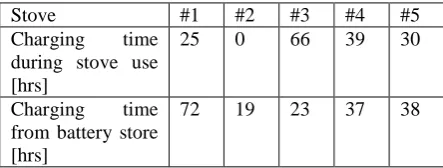
Table 6: Electrical power usage behaviour
764
Stove #1 #2 #3 #4 #5
Charging time during stove use [hrs]
25 0 66 39 30
Charging time from battery store [hrs]
72 19 23 37 38
765
Since many of the participants charged while using the
766
stove, it raises interesting questions about the necessity
767
of the primary battery since it increases the overall cost
768
of the system. Indeed, the user of TEG-stove 3 said she
769
valued the TEG-stove so highly that she mainly cooked
770
with this stove only when she needed electricity, for fear
771
of overusing the stove and breaking it. This is reflected
772
in Error! Reference source not found. which shows
773
frequent gaps between power generating periods.
774
[image:10.595.57.279.120.204.2]775
Figure 15: Subset of TEG-Stove 3 daily power generated showing irregular usage
776
Figure 16 highlights that the power generated was
777
immediately consumed by the user and therefore the
778
connected device was charged primarily from the TEG
779
directly. On some occasions the consumed power
780
exceeded the power generated. In these cases, some of
781
the energy stored in the primary battery during previous
782
burning periods was also used to charge the appliance.
783
An example of this behaviour can be observed when a
784
user connects a device to the USB port during the
785
evening cooking period. The device charges while
786
cooking but remains connected when cooking has
787
finished. At this point the energy stored in the primary
788
battery during the morning and afternoon cooking
789
periods will continue to charge the device.
790
791
792
Figure 16: Subset of TEG-Stove 3 daily power consumption as a percentage of generated power
793
4.3.2 Appliance charging
794
Field facilitators and user surveys showed that the
795
participants charged the provided LED lights, mobile
796
phones, and even radios using the TEG stove. In some
797
cases, phone charging was used as an income generating
798
activity. Power consumption behaviour, like stove
799
usage, was erratic. Users may go days without charging
800
an appliance and then suddenly charge several in a 24h
801
period. By analysing the power consumption profiles, it
802
is sometimes possible to ascertain the devices charged.
803
Figure 17 shows selected power consumption profiles
804
for TEG-stoves 1 and 4. From these images it is possible
805
to differentiate between mobile phone and LED lantern
806
charging. Mobile phone charging with this circuit is
807
characterised by an initial spike in current or power
808
followed by a slow decrease over the charging period.
809
The LED lantern, if charged from flat, typically
810
maintains a constant charging power. From Figure 17a,
811
the user of TEG-stove 1 was able to charge two mobile
812
phones and the LED lantern on this day. Similarly, the
813
user for TEG-stove 4 was also able to charge two mobile
814
phones and the LED lantern, although the charging
815
profiles are quite different. During the first charging
816
profile, it is likely that the user quickly disconnected the
817
first phone and connected a second phone which would
818
explain the extended charging time.
819
[image:10.595.63.277.330.461.2]Figure 17: Selected power consumption profiles for (a) TEG-stove 1 and (b) TEG-stove 4
821
4.3.4 Supply –vs– demand
822
The total power generated and consumed by each stove
823
user is given in Table 7. The user of TEG-stove 3 has a
824
well-balanced power profile because direct charging
825
was frequently employed. Indeed it would seem that
826
efficiencies greater than 60% can be obtained when
827
direct charging. This is because the TEG and
828
accompanying circuit approach the maximum power
829
point at a temperature difference above 150°C, but
830
below this the battery resistance does not match the
831
TEG’s internal resistance. When another load is
832
connected to the circuit via the USB port, in some cases
833
the internal and load resistances are better matched and
834
the TEG produces more power than it would when
835
charging the primary battery only.
836
For the other TEG-stoves, power generation
837
significantly exceeded power consumption. The largest
838
average daily power consumption was just over 3 W·h
839
for TEG-stove 1 [17]. This would suggest that 3 W·h is
840
sufficient to meet the daily electrical needs of a rural
841
household in this region.
842
843
To put the power consumption into context, consider
844
just the ability to provide light. The LED lantern
845
provided was shown to require 4 W·h to charge from
846
flat. This was sufficient to provide a total of 10 hours of
847
light (5 hours in turbo mode and 5 in lantern mode, see
848
ref. [16]). If the power consumed by the field trial
849
participants was solely used to charge the LED lantern,
850
an equivalent lighting time can be estimated as shown in
[image:11.595.64.275.58.366.2]851
Table 7. The table also displays the estimated available
852
lighting time per day based on power consumption
853
measurements.
854
[image:11.595.305.540.139.287.2]855
Table 7: Total power generated and consumed for each
856
TEG-stove
857
Stove #1 #2 #3 #4 #5
Power generated [W·h]
693 138 259 704 259 Power consumed
[W·h]
259 36 195 179 117 Equivalent LED
lantern charges
65 9 49 45 29
Equivalent Light [hrs]
650 90 490 450 290 Equivalent Light
hours per day [hrs/day]
8.1 3 6.1 5.6 3.6
858
5. Conclusions
859
Five prototype TEG-generator cooking stoves were
860
deployed to a village community in rural Malawi, along
861
with five non-generating stoves. The TEG-stoves were
862
successfully used by the participants to charge mobile
863
phones, lights and radios. Of the five generators
864
deployed, one failed due to mechanical breakdown on
865
the cooling side.
866
867
Stove usage behaviour was determined to be erratic.
868
Prolonged stove usage is not solely attributable to the
869
inclusion of the generator, since the longest usage
870
periods were found in the control group who did not
871
have TEG-stoves. Temperature analysis showed that the
872
majority of the TEGs were kept within their
873
recommended operating conditions for the vast majority
874
of the trial, although the effect of thermal cycling
875
seemed to cause a small decrease in output power over
876
time.
877
878
In terms of power production, the users did not
879
frequently obtain the maximum power output from the
880
generators, yet the power generated greatly exceeded
881
that consumed in most cases. It would appear from the
882
daily power consumption profiles that 3 W·h is
883
sufficient to meet the average daily electrical power
884
requirements for the participants in this study. The
885
generator design has been refined based on the results of
886
this study with a view to a second field trial.
887
888
Acknowledgments
889
The authors would like to gratefully acknowledge Irish
890
Aid, The Irish Research Council and Intel Corporation
891
for their support and contribution to this research, and
892
also Concern Universal for their continued assistance in
893
the field.
894
895
896
897
898
899
Nomenclature
901
Symbol Description Unit
L Length of thermo-element m
Lc Contact layer thickness m
Pelec Electrical power W
PTEG Power generated by the TEG W PUSB Power consumed by user via USB W
RL Load resistance Ω
RTEG TEG internal resistance Ω Th Module hot side temperature K Tc Module cold side temperature K ΔTTEG Module temperature difference K ΔTactual Actual TEG temp. difference K ΔTapparent Apparent TEG temp. difference K WTEG Power generated by the TEG W·h WUSB Power consumed by user via USB W·h
α Seebeck coefficient V/K
αeff Effective Seebeck coefficient V/K
902
903
References
904
[1] OECD/IEA. Energy Poverty: How to make modern
905
energy access universal? 2010.
906
[2] Codecasa MP, Fanciulli C, Gaddi R, Gomez-Paz F,
907
Passaretti F. Update on the Design and Development of
908
a TEG Cogenerator Device Integrated into
Self-909
Standing Gas Heaters. 2013:1-6.
910
[3] Codecasa MP, Fanciulli C, Gaddi R, Passaretti F.
911
Design and development of a thermoelectric
912
cogeneration device integrated in autonomous gas
913
heaters. 9th European Conference on Thermoelectrics:
914
Ect2011, 28-30 Sept 2011. USA: American Institute of
915
Physics; 2012. p. 512-15.
916
[4] Doloszeski M, Schmidt A. The use of thermoelectric
917
converters for the production of electricity from
918
biomass. XVI ICT '97 Proceedings ICT'97 16th
919
International Conference on Thermoelectrics, 26-29
920
Aug 1997. New York, NY, USA: IEEE; 1997. p.
607-921
10.
922
[5] Eakburanawat J, Boonyaroonate I. Development of
923
a thermoelectric battery-charger with
microcontroller-924
based maximum power point tracking technique.
925
Applied Energy. 2006;83:687-704.
926
[6] Gou X, Xiao H, Yang S. Modeling, experimental
927
study and optimization on low-temperature waste heat
928
thermoelectric generator system. Applied Energy.
929
2010;87:3131-6.
930
[7] Hsu C-T, Huang G-Y, Chu H-S, Yu B, Yao D-J.
931
Experiments and simulations on low-temperature waste
932
heat harvesting system by thermoelectric power
933
generators. Applied Energy. 2011;88:1291-7.
934
[8] Rinalde GF, Juanico LE, Taglialavore E, Gortari S,
935
Molina MG. Development of thermoelectric generators
936
for electrification of isolated rural homes. International
937
Journal of Hydrogen Energy. 2010;35:5818-22.
938
[9] Killander A, Bass JC. A stove-top generator for cold
939
areas. Fifteenth International Conference on
940
Thermoelectrics Proceedings ICT '96, 26-29 March
941
1996. New York, NY, USA: IEEE; 1996. p. 390-3.
942
[10] Sawyer B, Masood F, Rugg J, Bird J, Gorevski T.
943
Thermoelectric and fan system for cook stove. 2008.
944
[11] Champier D, Bedecarrats JP, Kousksou T,
945
Rivaletto M, Strub F, Pignolet P. Study of a TE
946
(thermoelectric) generator incorporated in a
947
multifunction wood stove. Energy. 2011;36:1518-26.
948
[12] Champier D, Bedecarrats JP, Rivaletto M, Strub F.
949
Thermoelectric power generation from biomass cook
950
stoves. Energy. 2010;35:935-42.
951
[13] Champier D, Favarel C, Bedecarrats JP, Kousksou
952
T, Rozis JF. Prototype Combined
953
Heater/Thermoelectric Power Generator for Remote
954
Applications. 2013:1-12.
955
[14] Goudarzi AM, Mazandarani P, Panahi R, Behsaz
956
H, Rezania A, Rosendahl LA. Integration of
957
Thermoelectric Generators and Wood Stove to Produce
958
Heat, Hot Water, and Electrical Power. 2013:1-7.
959
[15] Raman P, Ram NK, Gupta R. Development, design
960
and performance analysis of a forced draft clean
961
combustion cookstove powered by a thermo electric
962
generator with multi-utility options. Energy.
963
2014;69:813-25.
964
[16] O'Shaughnessy SM, Deasy MJ, Kinsella CE, Doyle
965
JV, Robinson AJ. Small scale electricity generation
966
from a portable biomass cookstove: Prototype design
967
and preliminary results. Applied Energy.
2013;102:374-968
85.
969
[17] O'Shaughnessy SM, Deasy MJ, Doyle JV,
970
Robinson AJ. Field trial testing of an
electricity-971
producing portable biomass cooking stove in rural
972
Malawi. Energy for Sustainable Development.
973
2014;20:1-10.
974
[18] Kinsella CE, O’Shaughnessy SM, Deasy MJ, Duffy
975
M, Robinson AJ. Battery charging considerations in
976
small scale electricity generation from a thermoelectric
977
module. Applied Energy. 2014;114:80-90.
978
[19] Adkins E, Oppelstrup K, Modi V. Rural household
979
energy consumption in the millennium villages in
Sub-980
Saharan Africa. Energy for Sustainable Development.
981
2012;16:249-59.
982
[20] Manchester SC, Swan LG. Off-grid mobile phone
983
charging: An experimental study. Energy for
984
Sustainable Development. 2013;17:564-71.
985
[21] Malakini; M, Mwase; W, Maganga; AM, Khonj; T.
986
Fuelwood Use Efficiency in Cooking Technologies for
987
Low Income Households in Malawi. Middle-East
988
Journal of Scientific Research 2014;19:1328-33.
989
[22] Embassy of the United States Lilongwe Malawi. 2
990
million Clean Cook-stoves in Malawi by 2020. 2014.
991
[23] Rowe DM. Thermoelectric power generation.
992
Proceedings of the Institution of Electrical Engineers.
993
1978;125:1113-36.
994
[24] Hodes M. On one-dimensional analysis of
995
thermoelectric modules (TEMs). IEEE Transactions on
996
Components and Packaging Technologies.
997
2005;28:218-29.
998
[25] Hsu CT, Huang GY, Chu HS, Yu B, Yao DJ. An
999
effective Seebeck coefficient obtained by experimental
1000
results of a thermoelectric generator module. Applied
1001
Energy. 2011.
1002
[26] Ko Ko W, Dasgupta S, Panda SK. An Optimized
1003
MPPT Circuit for Thermoelectric Energy Harvester for
1004
Low Power Applications. 8th International Conference
1005
on Power Electronics - ECCE Asia, 30 May-3 June
1006
2011. Piscataway, NJ, USA: IEEE; 2011. p. 1579-84.
1007
[27] Xiaodong Z, Wenlong L, Jiangui L. Thermoelectric
1008
power generation with maximum power point tracking.
8th International Conference on Advances in Power
1010
System Control, Operation and Management (APSCOM
1011
2009), 8-11 Nov 2009. Stevenage, UK: IET; 2010. p. 6
1012
pp.
1013
[28] Sungkyu C, Namjae K, Soonseo P, Shiho K. A
1014
coreless maximum power point tracking circuit of
1015
thermoelectric generators for battery charging systems.
1016
Solid State Circuits Conference (A-SSCC), 2010 IEEE
1017
Asian2010. p. 1-4.
1018
[29] Mastbergen D. Development and optimization of a
1019
stove-powered thermoelectric generator: Colorado State
1020
University; 2008.
1021