Original Article
The value of CT image-based texture analysis for
differentiating renal primary undifferentiated
pleomorphic sarcoma from three subtypes
of renal cell carcinoma
Guoshun Liu1,2, Wenxi Li3, Lei Li4, Xinqing Jiang2
1The First Affiliated Hospital of Jinan University, Guangzhou, China; Departments of 2Radiology, 3Geriatrics,
Guangzhou First People’s Hospital, Guangzhou Medical University, Guangzhou, China; 4Department of Radiology,
184 Hospital of The People’s Liberation Army, Yingtan, China
Received December 14, 2016; Accepted August 7, 2017; Epub September 15, 2017; Published September 30, 2017
Abstract: Purpose: To explore the value of computed tomography (CT) image-based texture analysis for the differen-tial diagnosis of renal primary undifferentiated pleomorphic sarcoma and three subtypes of renal cell carcinoma. Materials and methods: Eleven cases of renal primary undifferentiated pleomorphic sarcoma and 33 cases of renal cell carcinoma (including 11 cases each of clear cell carcinoma, papillary renal cell carcinoma, and chromophobe
renal cell carcinoma), which were confirmed by surgical pathology, were retrospectively analyzed. All patients un -derwent an abdominal CT scan and a three-phase enhanced scan (except for 1 patient with undifferentiated poly-morphic sarcoma without a delayed scan). MaZda software was used to manually place regions of interest (ROIs) to
extract the textural features of the lesions. The texture feature selection methods included the Fisher coefficient, the joint error coefficient (POE+ACC), the mutual information (MI), and the above three methods combined (FPM). First, these 4 methods were used to select the most meaningful texture features for the identification of primary undif -ferentiated pleomorphic sarcoma and 3 subtypes of renal cell carcinoma. Then, raw data analysis (RDA), principal component analysis (PCA), and linear discriminant analysis (LDA) were used to identify the four types of lesions. The
results are expressed as the misclassified rate (MCR). In addition, using the 4 selected categories, 2 intermediate or more senior doctors assessed and classified the imaging data of the 44 cases. Results: Based on the 4 phase CT images and the use of the Fisher, POE+ACC, MI, and FPM methods to extract texture features and RDA and PCA to
identify the 44 cases, we found that the MCR was high (65.12-77.27%), and the misjudgement results showed no
statistically significant differences (P>0.05). The MCR using LDA was low (6.82-59.09%) and showed a statistically significant difference from that resulting from the use of RDA and PCA (P<0.05). The lowest MCR was obtained with the FPM method using LDA and showed a statistically significant difference from those of the Fisher, POE+ACC, and MI methods. Based on the values obtained using the FPM method with LDA, no significant differences were found
among the misdiagnoses in all of the phases (x2=3.526, P>0.05). The MCR was lowest in the arterial phase (6.82%,
3/44). The MCR of the imaging diagnosis was 45.45% and showed a statistically significant difference from that
obtained with the FPM method using LDA (x2=17.001, P<0.05). Conclusion: The combined use of MaZda software,
the FPM method to extract CT image texture features, and LDA produced the highest rate of identification of renal
primary undifferentiated pleomorphic sarcoma and 3 subtypes of kidney cancer.
Keywords: Texture analysis, primary undifferentiated pleomorphic sarcoma, renal cancer carcinoma, subtype, dif-ferentiation
Introduction
Renal cell carcinoma (RCC) and primary undif-ferentiated pleomorphic sarcoma (PUPS) are the most common and rare renal neoplasms, respectively. Computed tomography (CT) and magnetic resonance imaging (MRI)
and its imaging features lack specificity, which makes a clear diagnosis difficult [4, 5]. Texture
analysis can provide information that cannot be seen by the naked eye via the quantitative anal-ysis of the image pixel grey value of the local characteristics, the pixel value variation, and the distribution pattern. In recent years, this method has been applied to the medical imag-ing of many types of auxiliary diseases [6, 7]. At present, few studies on the application of image texture analysis in the kidney have been conducted. However, kidney cancer is one of the most common tumours. Different types of kidney cancer and renal primary undifferenti-ated pleomorphic sarcoma require different clinical treatments, and a correct diagnosis is helpful to form a reasonable treatment plan. Therefore, the aim of this study was to explore the value of CT image-based texture analysis for the differential diagnosis of renal primary undifferentiated pleomorphic sarcoma and 3 subtypes of renal cell carcinoma.
Patients and methods
Patients
This study was approved by the Institutional
Review Board of Guangzhou First People’s
Hospital. The clinical investigations in this study were conducted according to the principles ex- pressed in the Declaration of Helsinki. Informed consent, written or oral, was obtained from all of the participants. This retrospective study
uti-lized de-identified patient data collected from
the CT room in the Department of Radiology at
Guangzhou First People’s Hospital affiliated to Guangzhou Medical University. Eleven cases
(all patients underwent a CT scan before sur-gery, 10 patients underwent a three-phase enhanced scan, and 1 patient underwent only arterial and venous phase scans) of PUPS of the kidney were diagnosed by surgery and
pathology at Guangzhou First People’s Hospital
from December 2004 to August 2016. Seven of the patients were male and 4 were female, and
their ages ranged from 38 to 76 years, with a mean age of 60±11 years. We analyzed 213 cases of renal cell carcinoma confirmed by sur -gical pathology from December 2004 to August
2016 at Guangzhou First People’s Hospital, of
which 11 cases each of clear cell carcinoma, papillary carcinoma, and chromophobe renal cell carcinoma were randomly selected (7 males and 4 females with clear cell carcinoma,
age 27-81 years, average age 56±8 years; 5
males and 6 females with papillary carcinoma, age 23-73 years, average age 55±13 years;
and 8 males and 3 females with chromophobe renal cell carcinoma, age 33-68 years, average
age 45±13 years).
CT examination
All examinations were performed using a 16-
MDCT (TOSHIBA Aquision, Japan) and included
a plain scan and an enhanced scan with the following scanning parameters: collimator 0.625 mm, tube voltage 100-120 kV, tube cur-rent 120-160 mAs, layer thickness 5.0 mm, and layer spacing 3-5 mm. A non-ionic contrast
agent (2 mL/kg, Ultravist 350, Bayer AG,
Lever-kusen, Germany) was administered, which was
adjusted for the patient’s weight in kg and auto
-matically injected at a flow rate of 4 mL/s
through the elbow vein with a double cylinder high pressure syringe. Approximately 25-30 s,
60-70 s, and 128-180 s after the contrast
agent injection, the arterial phase, venous phase, and excretory phase were obtained, respectively.
Image texture analysis Image selection
The CT images of all of the patients were
exported from the PACS work station in a BMP
format. The window width and window position were adjusted for consistency, and the data were stored on the hard disk for further analy-sis. The diagnosis of these 44 patients was performed by two intermediate or more superi-or physicians who had experience in the diag-nosis of abdominal images. The diagdiag-nosis was based on a 4-by-1 rule: A represented clear cell
carcinoma, B represented papillary renal cell
carcinoma, C represented chromophobe renal cell carcinoma, and D represented undifferenti-ated pleomorphic sarcoma. A consensus was reached in the cases of disagreement regard-ing the diagnosis.
Texture analysis
Image texture feature extraction: A texture analysis was performed using MaZda soft- ware (Version 4.7, the Technical University
of Lodz, Institute of Electronics, http://www. eletel.p.lodz.pl/mazda/). To reduce the error of
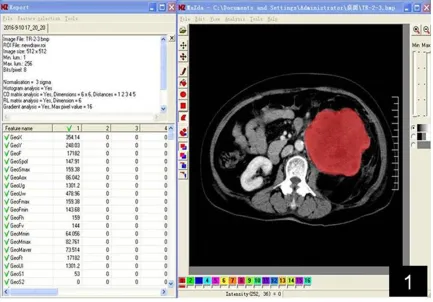
phases, the boundary of the ROI at the maxi-mum level in the clearest phase was manually drawn while maintaining consistency with the other phases (Figure 1). The grey level co-occurrence matrix (GLCM), grey histogram, run-length matrix (RUN), texture features based on a Fourier transform, and auto-regressive meth-od were generated after the texture features
were normalized to reduce the effects of con -trast and brightness changes (Table 1). Due to the number of texture features, we selected the most discriminating features of these two types of lesions for further analysis. The MaZda
soft-ware provides the Fisher coefficient (Fisher), classification error probability combined with
the average correlation coefficients (POE+ACC),
mutual information (MI) of the three types of
methods with the 10 most significant texture
feature selections, and the combination of the
3 methods (FPM) with the 30 most significant
texture feature selections for further analysis of
the disease classification.
Discriminate analysis: The selected texture fea-tures were used to classify 4 types of lesions
using B11 statistical software (version 4.7, the Technical University of Lodz, Institute of Electr-onics, http://www.eletel.p.lodz.pl/mazda/). The
[image:3.612.91.524.72.374.2]discriminate methods include draw data analy-sis (RDA), principal component analyanaly-sis (PCA), Figure 1. Manually drawn ROI at the maximum level in the clearest phase.
Table 1. Texture feature parameters generated by the MaZda software Texture description Texture feature parameters
Histogram Mean, variance, skewness, kurtosis, percentile value
Greylevelco-occurrence matrix ASM energy, contrast, autocorrelation, entropy, entropy sum, square sum, variance and inverse moment, entropy difference
Run-length check Non-uniformity measure of run length, non-uniformity measure of grey scale, long run enhancement, short run enhancement, fractional run
Absolute gradient Gradient mean, variance, skewness, kurtosis, non-zero Autoregressive model Theta 1-4, sigma
[image:3.612.91.525.422.517.2]Figure 2. Aa-d. A 65-year-old male with renal primary undifferentiated pleomorphic sarcoma was correctly diag-nosed. The CT enhanced scan shows moderate progressive enhancement, larger lesions, cystic necrosis, and more
violations of the perirenal space. Ba-d. A 47-year-old female with renal primary undifferentiated pleomorphic sar -coma was misdiagnosed with clear cell carcinoma. The CT enhanced scan shows moderately forward and fast-out enhancement, a smaller lesion volume, less necrosis, and no perirenal invasion. Ca-d. A 56-year-old male with renal primary undifferentiated pleomorphic sarcoma was misdiagnosed with chromophobe renal cell carcinoma. The CT enhanced scan shows mild progressive enhancement, a centrally segmentally located, low-density
enhance-ment zone with a narrow time delay range, no significant renal involveenhance-ment, and perirenal fascia thickening (due to
chronic stimulation). Da-d. A 33-year-old male with renal primary undifferentiated pleomorphic sarcoma was
and linear discriminate analysis (LDA). The results obtained in the 4 different phases of
lesions were expressed as the misclassified rate (MCR=number of misclassified cases/
total number of cases × 100%), and a lower MCR indicated that the lesion contains more texture features.
Statistical analysis
Using the pathology as the reference standard, Linex List data x2test was used to examine the differences in the results for the different phas-es, texture extractions, and analysis methods
and to determine whether a statistically signifi -cant difference was present between the diag-noses provided by the physicians according to the images and the MaZda software. The sta-tistical analyses were performed using SPSS
version 13.0. A P value <0.05 was considered significant.
Results
Diagnoses of physicians based on CT images
Of the 11 cases of renal PUPS, 4 cases were diagnosed correctly (Figure 2), and 7 cases were misdiagnosed as renal cell carcinoma (4 cases were misdiagnosed as clear cell carcino-ma, as shown in Figure 2B; 2 cases were misdi-agnosed aschromophobe renal cell carcinoma, as shown in Figure 2C; and 1 case was misdiag-nosed as papillary cell carcinoma, as shown in Figure 2D. Of the 11 cases of renal clear cell carcinoma, 9 cases were diagnosed correctly (1 case was misdiagnosed as chromophobe renal cell carcinoma and 1 case was misdiag-nosed as papillary cell carcinoma). Of the 11 cases of renal chromophobe renal cell carcino-ma, 7 cases were diagnosed correctly (3 cases were misdiagnosed as clear cell carcinoma and 1 case was misdiagnosed as papillary cell car-cinoma). Of the 11 cases of renal papillary cell carcinoma, 4 cases were diagnosed correctly (5 cases were misdiagnosed as clear cell carci-noma and 2 cases were misdiagnosed as chro-mophobe renal cell carcinoma). Of the 44 cases, 24 cases were diagnosed correctly and 20 cases were misdiagnosed, resulting in an MCR of 45.45% (20/44).
The statistical analysis of the MCR and the misjudged difference based on CT image tex-ture analysis
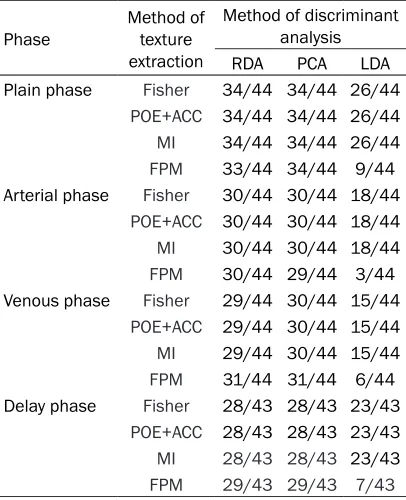
As shown in Table 2, used Linex List data x2 test, we found that based on the 4 methods used to extract the texture features (Fisher,
POE+ACC, MI, and FPM), regardless of the use
of plain scans, the arterial phase, the venous phase, or the delay period, the MCR using LDA was relatively lower than that of RDA and PCA, and the FPM texture extraction method using LDA produced the lowest value. The misjudged
results of RDA and PCA showed no significant differences in all of the phases (P>0.05), and the MCR was high (65.12%-77.27%). Based on
[image:5.612.89.292.169.419.2]CT plain and delay scan image, whether to use pathological maps. The pleomorphic morphology of the tumour cells, which were mostly irregular or round in shape, was obvious. Red dye staining showed increased megakaryocytes, multinucleated tumour cells, the nucleus, obvi-ous nucleoli with a pathological split phase, increased mixed foam-like cells, lymphocytes and plasma cells, and local tissue necrosis.
Table 2. Identification of renal primary undiffer -entiated pleomorphic sarcoma and 3 subtypes of renal cell carcinoma
Phase Method of texture extraction
Method of discriminant analysis RDA PCA LDA Plain phase Fisher 34/44 34/44 26/44
POE+ACC 34/44 34/44 26/44
MI 34/44 34/44 26/44
FPM 33/44 34/44 9/44 Arterial phase Fisher 30/44 30/44 18/44
POE+ACC 30/44 30/44 18/44 MI 30/44 30/44 18/44 FPM 30/44 29/44 3/44 Venous phase Fisher 29/44 30/44 15/44
POE+ACC 29/44 30/44 15/44
MI 29/44 30/44 15/44
FPM 31/44 31/44 6/44 Delay phase Fisher 28/43 28/43 23/43
POE+ACC 28/43 28/43 23/43
MI 28/43 28/43 23/43
FPM 29/43 29/43 7/43 Fisher: Fisher coefficient. POE+ACC: classification error
probability combined with the average correlation
coef-ficients. MI: mutual information. FPM: Fisher+POE+ACC+
Fisher, POE+ACC or MI texture extraction meth -od, the misdiagnosis results of using LDA
showed no significant differences with RDA and PCA (P>0.05), but based on CT arterial phase
and venous phase image, the misdiagnosis results of using LDA showed a statistically
sig-nificant differences with RDA and PCA (P<0.05). A statistically significant difference was found
between the FPM method using LDA and RDA
and PCA (P<0.05). Based on the FPM method using LDA, no significant difference was
ob-served in the misdiagnosis results in all of the phases (x2=3.526, P>0.05), and the MCR exhibited the lowest value in the arterial phase
(6.82%, 3/44). Based on the FPM method using
LDA, 3 cases were misdiagnosed, including 1 case of undifferentiated pleomorphic sarcoma that was misdiagnosed as chromophobe renal cell carcinoma, 1 case of chromophobe renal cell carcinoma that was misdiagnosed as undif-ferentiated pleomorphic sarcoma, and 1 case of clear cell carcinoma that was misdiagnosed
Discussion
Differentiation of renal primary undifferenti-ated pleomorphic sarcoma and 3 subtypes of renal cell carcinoma based on CT images
Clinically, CT scans are often used in imaging examinations of kidney disease, which exhibit
good application value [8]. However, the results
of CT imaging examinations are limited by the level of diagnosis and depend on the experi-ence and subjectivity of the physician, espe-cially in the case of rare and atypical diseases. Renal carcinoma is the most common malig-nant neoplasm of the kidney. Its imaging
mani-festations have a certain specificity, which facil -itates diagnosis. However, its subtypes are diverse, and by relying solely on CT imaging, it is
difficult to distinguish the subtypes [9]. Clear
cell carcinoma, papillary carcinoma, and chro-mophobe renal cell carcinomaare the most common subtypes of renal cell carcinoma, and
[image:6.612.92.524.72.180.2]although the imaging findings have certain Figure 3. Differential diagnosis of renal primary undifferentiated pleomorphic sarcoma and 3 subtypes of renal cell carcinoma based on the FPM method using LDA in the arterial phase. The number 1 represents undifferentiated pleomorphic sarcoma, 2 represents chromophobe renal cell carcinoma, 3 represents clear cell carcinoma, and 4 represents papillary renal cell carcinoma. The four types of lesions were more dispersed in different regions, which made them easier to distinguish. Three cases were misjudged, including 1 case of undifferentiated pleomorphic sarcoma that was misdiagnosed as chromophobe renal cell carcinoma, 1 case of chromophobe renal cell carci-noma that was misdiagnosed as undifferentiated pleomorphic sarcoma, and 1 case of clear cell carcicarci-noma that was misdiagnosed as chromophobe renal cell carcinoma.
Table 3. Differentiation of primary undifferentiated pleomorphic sarcoma and 3 subtypes of renal cell carcinoma according to LDA and image-based physi-cian diagnoses
Identification method diagnosesIncorrect diagnosesCorrect
LDA 3 41
Image-based physician diagnoses 20 24
x2=17.001 P=0.000
Statistical difference using the FPM method and LDA based on
CT arterial phase images and physician diagnoses (P<0.01).
as chromophobe renal cell carcinoma (Fig- ure 3).
Statistical analysis of the misjudged differ-ence using the FPM method and LDA based on CT arterial phase images and physician diagnoses
As shown in Table 3, used 2 × 2 data x2 test
we found a statistically significant difference
between the two methods (x2=17.001,
[image:6.612.92.315.340.403.2]characteristics, some overlap occurs [10]. Radiologists mainly rely on the distinctive
char-acteristics for diagnosis, which can significantly
increase the MCR. The diagnostic accuracy of these diseases obtained in this study was 60.61% (20/33). Primary undifferentiated pleo-morphic sarcoma is a rare malignant tumour of the kidney, and its imaging features lack
speci-ficity. Imaging diagnosis is difficult and this type
of tumour is easy to misdiagnose; thus, the diagnostic accuracy in this study was only 36.36% (4/11). Therefore, based on CT images,
it is very difficult to differentiate between renal
primary undifferentiated polymorphic sarcoma and the 3 subtypes of renal cell carcinoma.
Differentiation of renal primary undifferenti-ated pleomorphic sarcoma and 3 subtypes of renal cell carcinoma based on CT image tex-ture analysis
Texture analysis utilizes the changes in the grey
value of image pixels and their distribution
pat-tern, which can reflect microscopic pathologi -cal changes that are not visible and can be used in the analysis of various images [11]. MaZda, a software package for 2D and 3D image texture analysis, provides a complete path for the quantitative analysis of image tex-tures [12]. MaZda software provides 4
meth-ods of texture extraction: Fisher, POE+ACC, MI, and FPM [13]. The first three methods automat
-ically select the 10 most significant features of
the lesions, whereas the FPM method selects
the 30 most significant texture features [14].
Compared to the previous 3 methods, which provide more texture features, the prediction accuracy of the FPM method is relatively high,
as confirmed by this study. In addition, MaZda
software provides 2 categories of discriminant
classification methods, including linear classifi -cation (RDA, PCA, and LDA) and nonlinear
clas-sification (NDA) [15]. Because the data obtained
in this study are not subject to nonlinear
clas-sification, only linear classification was per
-formed. The results showed significant differ -ences between the FPM using LDA and RDA/
PCA, with a significantly lower MCR for the FPM than for RDA/PCA. Based on the FPM texture extraction of LDA, a significant difference was not observed for misclassifications between all
of the phases, and the MCR of the arterial
phase exhibited the lowest value (6.82%, 3/44). We also found significant differences between
the results of the FPM using LDA and the diag-noses of physicians using imaging methods for renal primary undifferentiated pleomorphic sar-coma and the 3 subtypes of kidney cancer, with
a significantly lower MCR for the FPM using LDA
than for the imaging diagnosis (52.27%, 20/44). Thus, the FPM texture extraction of LDA, which can successfully identify primary renal undiffer-entiated pleomorphic sarcoma and the 3
sub-types of renal cancer, was significantly better
than conventional imaging diagnosis, with the
highest anastomosis (93.18%, 41/44) in the
arterial phase, which is consistent with that of conventional CT-enhanced arterial phase imag-es that provide more imaging information.
Limitations
The limitations of this study are as follows. First, due to the low incidence of undifferenti-ated pleomorphic sarcoma of the kidney, the number of cases in this study was low. We hope to further expand the number of cases in fol-low-up studies. Second, this study is a retro-spective study. In follow-up studies, we hope to establish the discriminant equation by expand-ing the sample to conduct a prospective analy-sis. Third, this study is based on a single CT image texture feature extraction. The ideal situ-ation would involve 3D modelling of the CT image sequence and determining the texture characteristics of lesions using 3D spatial anal-yses [16].
In summary, the combination of MaZda soft-ware, the combined method (FPM) of extracting CT image texture features, and the linear
clas-sification analysis (LDA) can be used to differ -entiate renal primary undiffer-entiated pleomor-phic sarcoma and 3 subtypes of kidney cancer. Therefore, texture analysis-based CT imaging can potentially be used as a clinical method for the differential diagnosis of atypical manifesta-tions of common and rare kidney diseases.
Disclosure of conflict of interest
None.
Address correspondence to: Dr. Xinqing Jiang, De-
partment of Radiology, Guangzhou First People’s Hospital, Guangzhou Medical University, Panfu Road No 1, Guangzhou 510180, China. E-mail:
References
[1] Bata P, Gyebnar J, Tarnoki DL, Tarnoki AD, Kekesi D, Szendroi A, Fejer B, Szasz AM, Nyirady P, Karlinger K and Berczi V. Clear cell
renal cell carcinoma and papillary renal cell carcinoma: differentiation of distinct histologi-cal types with multiphase CT. DiagnInterv
Radiol 2013; 19: 387-392.
[2] Yu X, Lin M, Ouyang H, Zhou C and Zhang H. Application of ADC measurement in
character-ization of renal cell carcinomas with different
pathological types and grades by 3.0T
diffu-sion-weighted MRI. Eur J Radiol 2012; 81:
3061-3066.
[3] Göğüş Ç, Gökce Mİ, Süer E, Tulunay Ö and Şafak M. Primary malignant fibrous histiocyto -ma of the kidney: report of a case and litera-ture review. Turk J Urol 2013; 39: 194-197. [4] Xue LY, Lu Q, Huang BJ, Li Z, Li CX, Wen JX and
Wang WP. Papillary renal cell carcinoma and clear cell renal cell carcinoma: differentiation of distinct histological types with contrast-en-hanced ultrasonography. Eur J Radiol 2015;
84: 1849-1856.
[5] Pathrose G, John NT and Manojkumar R. A rare
case of malignant fibrous histiocytoma/pleo -morphic undifferentiated sarcoma of the kid-ney. J Clin Diagn Res 2015; 9: PD27-PD29. [6] Yoon SH, Kim YH, Lee YJ, Park J, Kim JW, Lee
HS and Kim B. Tumor heterogeneity in human
epidermal growth factor receptor 2 (HER2)-positive advanced gastric cancer assessed by CT texture analysis: association with survival
after trastuzumab treatment. PLoS One 2016; 11: e0161278.
[7] Mougiakakou SG, Valavanis IK, Nikita A and Nikita KS. Differential diagnosis of CT focal liv-er lesions using texture features, feature
selec-tion and ensemble driven classifiers. ArtifIntell
Med 2007; 41: 25-37.
[8] Kim SH, Kim CS, Kim MJ, Cho JY and Cho SH. Differentiation of Clear cell renal cell carcino-ma from other subtypes and fat-poor angio-myolipoma by use of quantitative enhance-ment measureenhance-ment during three-phase MDCT.
AJR Am J Roentgenol 2016; 206: W21-W28.
[9] Ren A, Cai F, Shang YN, Ma ES, Huang ZG, Wang W, Lu Y and Zhang XZ. Differentiation of renal oncocytoma and renal clear cell carcino-ma using relative CT enhancement ratio. Chin
Med J (Engl) 2015; 128: 175-179.
[10] Ruppert-Kohlmayr AJ, Uggowitzer M, Meissni-tzer T and Ruppert G. Differentiation of renal
clear cell carcinoma and renal papillary carci-noma using quantitative CT enhancement
pa-rameters. AJR Am J Roentgenol 2004; 183: 1387-1391.
[11] Drabycz S, Roldán G, de Robles P, Adler D, McIntyre JB, Magliocco AM, Cairncross JG and
Mitchell JR. An analysis of image texture, tu-mor location, and MGMT promoter methylation in glioblastoma using magnetic resonance
im-aging. NeuroImage 2010; 49: 1398-1405.
[12] Orphanidou-Vlachou E, Vlachos N, Davies NP, Arvanitis TN, Grundy RG and Peet AC. Texture analysis of T1-and T2-weighted MR images and use of probabilistic neural network to dis-criminate posterior fossa tumours in children.
NMR Biomed 2014; 27: 632-639.
[13] Szczypiński PM, Strzelecki M, Materka A, Klepaczko A. MaZda--a software package for
image texture analysis. Comput Methods Pro-
grams Biomed 2009; 94: 66-76.
[14] Gentillon H, Stefańczyk L, Strzelecki M and
Respondek-Liberska M. Parameter set for computer-assisted texture analysis of fetal
brain. BMC Res Notes 2016; 9: 496.
[15] Yan L, Liu Z, Wang G, Huang Y, Liu Y, Yu Y and Liang C. Angiomyolipoma with minimal fat: dif-ferentiation from clear cell renal cell carcino-ma and papillary renal cell carcinocarcino-ma by tex-ture analysis on CT images. Acad Radiol 2015; 22: 1115-1121.
[16] De Albuquerque M, Anjos LG, Maia Tavares de Andrade H, De Oliveira MS, Castellano G,
Junqueira Ribeiro de Rezende T, Nucci A and