Sentence-level quality estimation by predicting HTER as a
multi-component metric
Eleftherios Avramidis
German Research Center for Artificial Intelligence (DFKI) Language Technology Lab, Berlin, Germany
Abstract
This submission investigates alternative machine learning models for predicting the HTER score on the sentence level. Instead of directly predicting the HTER score, we suggest a model that jointly pre-dicts the amount of the 4 distinct post-editing operations, which are then used to calculate the HTER score. This also gives the possibility to correct invalid (e.g. neg-ative) predicted values prior to the calcula-tion of the HTER score. Without any fea-ture exploration, a multi-layer perceptron with 4 outputs yields small but significant improvements over the baseline.
1 Introduction
Quality Estimation (QE) is the evaluation method that aims at employing machine learning in order to predict some measure of quality given a Ma-chine Translation (MT) output (Blatz et al.,2004). A commonly-used subtask of QE refers to the learning of automatic metrics. These metrics pro-duce a continuous score based on the comparison between the MT output and a reference transla-tion. When the reference is a minimal post-edition of the MT output, the quality score produced is in-tuitively more objective and robust as compared to other QE subtasks, where the quality score is as-signed directly by the annotators. In that case, the score is a direct reflection of the changes that need to take place in order to fix the translation. HTER (Snover et al.,2009) is the most commonly used metric as it directly represents the least required post-editing effort.
In order to predict the results of an automatic metric, QE approaches use machine learning to predict a model that associates a feature vector with the single quality score. In this case the
statis-tical model treats the automatic metric as a black box, in the sense that no particular knowledge about the exact calculation of the quality score is explicitly included in the model.
In this submission we aim to partially break this black-box. We explore the idea of creating a QE model that does not directly predict the single HTER score, but it jointly predicts the 4 compo-nents of the metric, which are later used for com-puting the single score. This way, the structure of the model can be aware of the distinct factors that comprise the final quality score and also poten-tially learn the interactions between them. Hence, the focus of this submission will remain on ma-chine learning and there will not be exploration in terms of features. In Section2 we briefly in-troduce previous work, in Section 3 we provide details about the method, whereas the experiment results are given in Section4. In Section5we de-scribe the models submitted at the shared-task and we explain why they differ from our best models. Finally, in Section 6 we present the conclusions and some ideas for future work.
2 Previous work
The prediction of HTER first appeared as a means to estimate post-editing effort (Specia and Farzin-dar, 2010). Bypassing the direct calculation of HTER was shown byKozlova et al.(2016), who had positive results by predicting BLEU instead of HTER. Predicting the HTER score with regards to post-editing operations, such as re-ordering and lexical choices, has been done by adding the rel-evant features in the input (Sagemo and Stymne, 2016), whereasTezcan et al.(2016) use the word-level quality estimation labels as a feature for pre-dicting the sentence-level score. To the best of our knowledge, all previous work used a model to directly predict a single HTER score, in
trast toAvramidis(2014), which trained one sep-arate model for every HTER component and used the 4 individual predictions to calculate the final score, albeit with no positive results. In our work we extend that, by employing a more elegant ma-chine learning approach that predicts four separate labels for the HTER components but through a sin-gle model.
3 Methods
3.1 Machine Learning
The calculation of HTER is based on the count of 4 components, namely the number of insertions, deletions, substitutions and shifts (e.g. reordering) that are required for minimally post-editing a MT output towards the correct translation. The final HTER score is the total number of editing opera-tions divided by the number of reference words.
HTER= #insertions+#dels+#subs+#shifts
#reference words
(1) We are here testing 4 different approaches to the prediction of HTER:
1. Baseline with single score: the baseline sys-tem of the WMT17 shared task using SVM regression (Basak et al.,2007) to directly pre-dict the HTER score.
2. Combination of 4 SVM models(4×SVM):
this is followingAvramidis (2014) so that it produces 4 separate SVM regression models that predict the amount of post-editing opera-tions (inseropera-tions, deleopera-tions, substituopera-tions and shifts respectively). Then, HTER is com-puted based on the 4 separate outputs (Equa-tion1).
3. Single-output perceptron (MLP): a multi-layer perceptron is trained to predict the HTER score
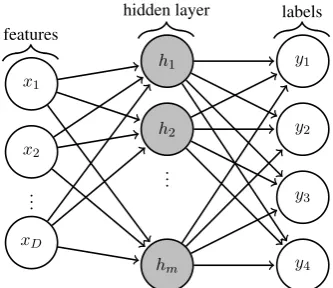
4. Multi-output perceptron(MLP4): a multi-layer perceptron is trained given the feature set in the input and the counts of the 4 post-editing operations as the output labels. Sim-ilar to 4×SVM, the separate predictions are
used to compute the HTER score (Equa-tion 1). The perceptron is depicted in Fig-ure1.
x1
x2
...
xD
h1
h2
...
hm
y1
y2
y3
y4 features
[image:2.595.334.501.64.208.2]hidden layer labels
Figure 1: Network graph for the multi-layer per-ceptron which given the featuresx1...Dcan jointly predict the amount of the post-editing operations y1...4
In the fist two models, SVM follows the base-line set-up of the WMT17 shared task, using SVM regression with an RBF kernel. The hyperparam-eters of all three models, including the number of the hidden units of the perceptron, are tuned via grid search on cross-validation with 5 folds over the training data.
3.2 Normalization of predictions
Additionally to the separate models, we are test-ing here some additional normalization on the pre-dicted number of post-editing operations, before it is used to calculate HTER:
i. Integer rounding: although the model was trained using only integers as labels, the re-gression model resulted into predictions in-cluding decimals. By assuming that only an integer amount of post-editing operations should be valid, we round up the post-editing operations to the closest integer.
ii. Trim negative and big numbers: MLP4 may also predict numbers outside the valid integer range, e.g. providing negative num-bers or numnum-bers higher than the amount of actual words in the sentence, particularly when features have not been normalized. Here, we trim the invalid values to the nearest integer within the valid range.
3.3 Optimization measure
tested the optimization scoring the folds with R2
and Pearson’s rho (which is the official metric of the shared task) in three variations:
a) the R2 of the predicted amount of
post-editing operations against the golden amount of the post-editing operations
b) the product of 4 rhos (rho edits); each rho evaluating the predictions for one type of post-editing operation (no normalization of predictions) against the golden amount of ed-its for the same post-editing operation
c) the rho over the final computed HTER (rho HTER) against the golden HTER with-out any prior normalization of predictions
4 Experiments
Here we present the experiments of testing the var-ious machine learning approaches on the develop-ment set. After the decisions were taken based on the development set, the models were also applied on the test-sets and the respective results are also given. The performance of the models is measured with Pearson’s rho, as this is the basic metric of the WMT17 Shared Task. A test on statistical sig-nificance for comparisons is performed with boot-strap re-sampling over 1000 samples. The 4 types of post-editing operations were re-computed with TERCOM on the exact way that the workshop or-ganizers computed the HTER scores.1
Similar to the baseline, features values are stan-dardized by removing the mean and scaled to unit variance. Since the experiment is focusing on ma-chine learning, for German-English only the base-line features are used. For English-German, we additionally performed preliminary experiments with the feature-set fromAvramidis(2017) includ-ing 94 features that improved QE performance for translating into German, generated with the soft-ware Qualitative (Avramidis,2016). The addition of these features did not result into any improve-ments, so we are not reporting their results dur-ing the development phase (see Section5for more details). The code for training quality estimation models was based on the software Quest++ (Spe-cia et al.,2015) and Scikit-learn (Pedregosa et al., 2011) ver. 1.18.
1TERCOM ver. 0.7.25 was downloaded from http: //www.cs.umd.edu/˜snover/tercom. The scripts used for running the experiments can be found athttps: //github.com/lefterav/MLP4.
The development results concerning the pre-sented methods are given below in this section. The model approaches are tested for both language directions, whereas the experiments on the nor-malization of the predictions and ML optimiza-tion are run only for German-English and these observations are applied to the models for English-German.
4.1 Best ML method
The results concerning the choice of the ML method applied on German-English are shown in Table1.
method dev test SVM 0.400 0.441 4×SVM 0.392 0.409
MLP 0.447* 0.447 MLP4 0.476* 0.475**
Table 1: Pearson rho correlation against golden labels concerning the 4 different approaches for predicting HTER for German-English. (*) indi-cates significant improvement (α= 0.05) over the
SVM baseline (**) significant improvement over all models
The approach of MLP4 achieves a small but significant improvement over the baseline and the 4×SVM on the development set. On the develop-ment set both MLP and MLP4 beat significantly the baseline, but MLP4 is not significantly better than MLP. Nevertheless, when applied to the test-set, the improvement achieved with MLP4 is sig-nificant as compared to all other ML methods.
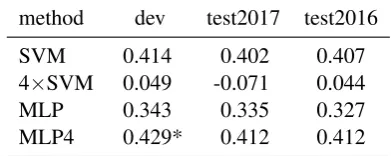
method dev test2017 test2016 SVM 0.414 0.402 0.407 4×SVM 0.049 -0.071 0.044
[image:3.595.317.513.548.626.2]MLP 0.343 0.335 0.327 MLP4 0.429* 0.412 0.412
Table 2: Performance of the 4 different approaches for predicting HTER for English-German (*) indi-cates a significant improvement (α = 0.1) over the
baseline
development set. When compared to the other two methods, though, MLP4 achieves a significant im-provement. In contrast to the direction German-English, in English-German the MLP with one output performs worse than the baseline. 4×SVM fails to predict HTER as its predictions achieve zero correlation. Since the individual models failed to predict the post-editing operations sep-arately, this may be an indication that among the 4 post-editing operations in English-German there are dependencies which are stronger than the ones in German-English.
4.2 Normalization of predicted post-editing operations
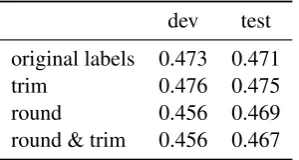
The effect of the normalization of the predicted post-editing operations of MLP4, prior to the cal-culation of the final HTER score, is shown in Ta-ble3.
[image:4.595.108.258.327.407.2]dev test original labels 0.473 0.471 trim 0.476 0.475 round 0.456 0.469 round & trim 0.456 0.467
Table 3: Performance improvements by introduc-ing roundintroduc-ing and cut-off for the predicted post-editing operations (German-English)
The experiment indicates some small improve-ment when we trim the invalid predicted values, so we use this for all other calculations. Prelinary experiments indicated more significant im-provements when the feature values have not been standardized and re-scaled prior to the training.
4.3 ML optimization
The effect of using different methods for hyperpa-rameter optimization is show in Table4.
dev test R2 0.440 0.454
rho HTER 0.431 0.457 rho edits 0.476 0.475
Table 4: Experimentation with different optimiza-tion measures for defining the perceptron hyperpa-rameters (German-English model)
The product of the 4 rhos, calculated over the 4 types of post-editing operations (rho edits) has
slightly better performance than the other scoring methods, nevertheless the difference is not statisti-cally significant. Using these findings just as an in-dication, we perform all experiments by optimiz-ing the hyperparameters withrho edits.
The optimized hyperparameters for the SVM models are shown in Table5, whereas the ones for the MLP models are shown in Table6. All SVMs have an RBF kernel and all MLPs are optimized with adam as a solver. It is noteworthy that for German-English a network topology with multiple hidden layers performed better, which is an indica-tion that the mapping between features and labels in this language pair is much more complex than the one for German-English.
langpair model C γ
de-en SVM 0.1 10 0.001
4×SVM (ins) 0.2 10 0.01 4×SVM (del) 0.2 10 0.01
4×SVM (shifts) 0.2 10 0.01 4×SVM (subst) 0.1 10 0.01
en-de SVM 0.1 1 0.01
4×SVM (ins) 0.2 1 0.001 4×SVM (del) 0.1 1 0.001
4×SVM (shifts) 0.1 1 0.001
4×SVM (subst) 0.2 1 0.001
Table 5: Hyperparameters used after the optimiza-tion of the SVM models
langp. model act. α tol. hidden units de-en MLP relu 0.10 10−9 1: 100
MLP4 relu 0.10 10−3 1: 300
en-de MLP tanh 0.01 10−3 3: 150, 75, 6
MLP4 tanh 0.10 10−3 2: 300, 150
Table 6: Hyperparameters and network topology after the optimization of the MLP models
SVM suffers from non-scaled feature values, this led our development phase to proceed by contrast-ing with a much lower baseline than the one finally provided by the workshop organizers. Non-scaled features and other settings affected also the perfor-mance of MLP models, and therefore the scores on our final submissions are significantly lower than the official baseline. The issue became apparent only after the submission, so we then re-computed the all models with standardized and scaled fea-ture values. The results presented in Section4are based on these corrected models.
The submitted models used both rounding and trimming of predicted integers (Section3.2). The MLPs were optimized with anα = 0.01,tanhas an activation function, andadamas a solver. The German-English model got optimal with 300 hid-den units. The English-German was trained using the additional 52 features fromAvramidis(2017) which gave good development results only with 3,000 hidden units, which is an indication of over-fitting.
method dev test
[image:5.595.71.293.537.622.2]baseline (ours) 0.32 0.34 MLP4 (submitted) 0.40 0.40 baseline (official) 0.40 0.44 MLP4 (corrected) 0.48 0.48
Table 7: Scores for the submitted models and for their corrected versions after the submission (German-English)
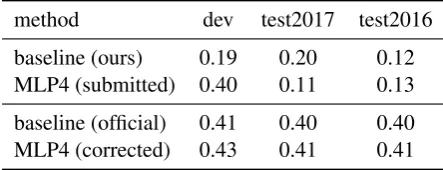
method dev test2017 test2016 baseline (ours) 0.19 0.20 0.12 MLP4 (submitted) 0.40 0.11 0.13 baseline (official) 0.41 0.40 0.40 MLP4 (corrected) 0.43 0.41 0.41
Table 8: Scores for the submitted models and for their corrected versions after the submission English-German
A comparison of the models developed be-fore the submission and the corrected ones are shown in Tables 7 and 8. The submitted model for German-English was expected to be signifi-cantly better than the baseline, whereas the one for English-German with the additional features had
strong indications of overfitting and performed in-deed poorly at the final test-sets.
The corrected models perform better after scal-ing is added and the roundscal-ing of integers is dis-abled. The corrected model for English-German converges without overfitting after removing the additional features and adding one more hidden layer. These models, if submitted to the shared task, despite comparing with the baseline, they would still score lower than almost all the others submitted methods. Though, we need to note that this should still be satisfactory, as we did not per-form any feature engineering, aiming at confirm-ing our hypothesis for usconfirm-ing multi-output models.
6 Conclusion and further work
In this submission we investigated the idea of us-ing a multi-layer perceptron in order to jointly pre-dict the 4 distinct post-editing operations, which are then used for calculating the HTER score. The experiments show some small but significant improvements on both the development set and the test-set for German-English, but the same ap-proach showed improvement only on the develop-ment set when applied English-German.
Despite not having conclusive results yet, we think that the idea is promising and that further experiments could have positive impact. Concern-ing the current development, several issues need to be further investigated, such as possible ways to avoid the lack of robustness of the perceptron. Since this work did not focus at feature engineer-ing, further work could profit from introducing features highly relevant to the specific types of post-editing operations, or even upscaling obser-vations from word-level and phrase-level QE. On the machine-learning level, additional hidden lay-ers and more work on the number of hidden units might be of benefit. Finally, evaluation specific to the types of the predicted post-editing operations could provide hints for further improvement.
Acknowledgments
References
Eleftherios Avramidis. 2014. Efforts on Ma-chine Learning over Human-mediated
Trans-lation Edit Rate. In Proceedings of the Ninth
Workshop on Statistical Machine Translation. Association for Computational Linguistics, Baltimore, Maryland, USA, pages 302–306.
http://www.aclweb.org/anthology/W/W14/W14-3337.
Eleftherios Avramidis. 2016. Qualitative: Python Tool for MT Quality Estimation Supporting Server
Mode and Hybrid MT. The Prague Bulletin
of Mathematical Linguistics (PBML)106:147–158.
https://ufal.mff.cuni.cz/pbml/106/art-avramidis.pdf.
Eleftherios Avramidis. 2017.Comparative Quality Es-timation for Machine Translation. Observations on
machine learning and features. Proceedings of the
20th Annual Conference of the European Associ-ation for Machine TranslAssoci-ation, The Prague Bul-letin of Mathematical Linguistics (108):307–318.
https://doi.org/10.1515/pralin-2017-0029.
Debasish Basak, Srimanta Pal, and Dipak Chan-dra Patranabis. 2007. Support vector regression. Neural Information Processing-Letters and Reviews 11(10):203–224.
John Blatz, Erin Fitzgerald, George Foster, Simona Gandrabur, Cyril Goutte, Alex Kulesza, Alberto Sanchis, and Nicola Ueffing. 2004. Confidence
es-timation for machine translation. In Proceedings
of the 20th international conference on Computa-tional Linguistics (COLING 04). Association for Computational Linguistics, Stroudsburg, PA, USA.
https://doi.org/10.3115/1220355.1220401.
Anna Kozlova, Mariya Shmatova, and Anton Frolov. 2016. YSDA Participation in the WMT’16
Quality Estimation Shared Task. In
Pro-ceedings of the First Conference on Machine Translation. Association for Computational Linguistics, Berlin, Germany, pages 793–799.
http://www.aclweb.org/anthology/W/W16/W16-2385.
Fabian Pedregosa, Gael Varoquaux, Alexandre Gram-fort, Vincent Michel, Bertrand Thirion, Olivier Grisel, Mathieu Blondel, Peter Prettenhofer, Ron Weiss, Vincent Dubourg, Jake Vanderplas, Alexan-dre Passos, David Cournapeau, Matthieu Brucher, Matthieu Perrot, and Edouard Duchesnay. 2011. Scikit-learn: Machine Learning in Python. Journal of Machine Learning Research12:2825–2830.
Oscar Sagemo and Sara Stymne. 2016. The UU Sub-mission to the Machine Translation Quality
Estima-tion Task. InProceedings of the First Conference
on Machine Translation. Association for Computa-tional Linguistics, Berlin, Germany, pages 825–830.
http://www.aclweb.org/anthology/W/W16/W16-2390.
Matthew Snover, Nitin Madnani, Bonnie J Dorr, and Richard Schwartz. 2009. Fluency, Adequacy, or HTER?: Exploring Different Human Judgments
with a Tunable MT Metric. In Proceedings of the
Fourth Workshop on Statistical Machine Transla-tion. Association for Computational Linguistics, Stroudsburg, PA, USA, StatMT ’09, pages 259–268.
http://www.aclweb.org/anthology/W/W09/W09-0x41.
Lucia Specia and Atefeh Farzindar. 2010. Estimat-ing Machine Translation Post-EditEstimat-ing Effort with
HTER. AMTA2010 Workshop Bringing MT to
the User MT Research and the Translation Indus-try pages 33–41. http://mt-archive.info/JEC-2010-Specia.pdf.
Lucia Specia, Gustavo Paetzold, and Carolina Scar-ton. 2015. Multi-level Translation Quality
Predic-tion with QuEst++. InProceedings of ACL-IJCNLP
2015 System Demonstrations. Association for Com-putational Linguistics and The Asian Federation of Natural Language Processing, Beijing, China, pages 115–120. http://www.aclweb.org/anthology/P15-4020.
Arda Tezcan, Veronique Hoste, Bart Desmet, and Lieve Macken. 2016. UGENT-LT3 SCATE System for Machine Translation Quality
Esti-mation. In Proceedings of the First Conference