Original Article
Three-dimensional high-resolution
anorectal manometry parameter for predicting
the perineal descent in adult female individuals
Jie Li1,2*, Yuwei Li2*, Xipeng Zhang2, Yi Zhang2, Chen Xu2, Zonghai Huang1
1Southern Medical University, Zhujiang Hospital, Guangzhou 510282, Guangdong, PR China; 2Department of
Colorectal Surgery, Tianjin Union Medical Center, Tianjin 300121, PR China. *Equal contributors.
Received January 14, 2016; Accepted June 8, 2016; Epub September 15, 2016; Published September 30, 2016
Abstract: The primary objective of this study was to establish the normal range values for diagnosing adult female perineal descent (PD) by using the three-dimensional high-resolution anorectal manometry (3DHRAM). The second aim was to determine the level of agreement in the diagnosis of PD between 3DHRAM and conventional defecog-raphy, which was considered as the gold standard. The method used in this research included two parts: I. 249 asymptomatic volunteers, who were previously diagnosed as non-PD by conventional defecography, were divided into two groups: pruripara group (147 subjects) and nullipara group (102 subjects). All the individuals underwent 3DHRAM in the Pelvic Floor Centre, Department of Colorectal Surgery, Tianjin Union Medical Center. On 3DHRAM,
perineal descent was defined as the downward movement of the anal high-pressure zone during defecation. The
parameters were recorded and the cut-off values were established for each group; II. With the reference ranges and the cut-off values established in part I, 270 adult female patients (116 nulliparous patients, 154 parous patients)
with anorectal dyschezia were examined with conventional defecography and 3DHRAM to identify the PD. Kappa coefficient (κ), Chi-Square Tests were used to assess the agreement between 3DHRAM and conventional defecog -raphy in the evaluation of PD. As for diagnosis of PD by 3DHRAM, the cut-off value for nulliparous individuals was 6.4 mm (95% CI: 5.2-8.6). The reference range was 0-6.4 mm. The cut-off value for parous was 10.6 mm (95% CI: 8.1-12.4). The reference range was 0-10.6 mm. The agreement between conventional defecography and 3DHRAM
with regard to the diagnosis of perineal descent in parous patients group was substantial (kappa 0.847; Chi-Square Tests P = 0.688), while the agreement in nulliparous patients group was moderate (kappa 0.786; Chi-Square Tests P = 0.508). The results of our study demonstrated that 3DHRAM could accurately diagnose the PD without ionizing
radiation. The cut-off values for the PD were reliable. Compared with conventional defecography, 3DHRAM had shown resemble diagnostic performance in assessing PD. So with its better tolerance and availability, 3DHRAM could be another reliable diagnosis tool for PD. sample.
Keywords: Perineal descent, three-dimensional high-resolution anorectal manometry, conventional defecography,
high-pressure zone
Introduction
As a common phenomenon associated with constipation and incontinence, perineal des- cent was a general symptom which was detect-ed by Porter [1] for the first time in 1962, it was defined as relaxed pelvic floor in chronic consti-pation patients by Parks [2] in 1966. Sub- sequently, other scholars [3] suggested that perineal descent was a general symptom also in fecal incontinence. Nowadays, PD is consid-ered to be the stage of excessive straining for defecation and is accepted to be a secondary
phenomenon associated with various diseases causing pelvic outlet obstruction rather than an independent disease inducing chronic consti-pation and fecal incontinence.
A retrospective study in 249 cases
were essential to assess the PD, conventional defecography remained the gold standard for diagnosing the PD. But the limitation of conven-tional defecography was that the patients had to be exposed to X-ray and inability to show all anatomic and physiological changes involved in defecation, which might develop some error in diagnosis. So alternatives to conventional defe-cography, such as endoanal ultrasonography, dynamic magnetic resonance imaging and high-resolution anorectal manometry had been developed for the evaluation of PD in recent years [5]. 3DHRAM was a novel technique which provides a simultaneous assessment of longitudinal and circumferential pressures throughout the length of the anal sphincter and topographical changes in 3 dimensions. Right now, there were only a few published studies utilizing 3DHRM in patients with pelvic floor dis-eases [6, 7]. Véronique Vitton [8] demonstrated that 3DHRAM could reliably diagnose exces-sive perineal descent in 2013, but the accurate criterion had not been set up, the cut-off val-ues, reference ranges for diagnosing the PD by using 3DHRAM have not been available until now. The aim of this study was to establish the normal parameter in healthy adult females to diagnose the PD by using 3DHRAM, and to vali-date the 3DHRAM technique by evaluating its effectiveness and concordance with defecog-raphy in the assessment of adult female PD.
Materials and methods
Between March 2014 and February 2015, 249 asymptomatic adult female volunteers, in whom non-PD were previously diagnosed by conventional defecography, were enrolled in the study from the Pelvic Floor Center, Department of Colorectal Surgury, Tianjin Union Medical Center. Three experienced senior tech-nicians examined all the individuals. Among these subjects, 102 were nulliparous (mean age 25.3 years, range 18-34) and 147 (mean age 47.5 years, range 24-59) were parous. The inclusion criteria included: female gender; age above 18 to 60 years old; non-perineal descent was diagnosed by conventional defecography before manometric studies; not taking any medication within 3 months before manomet-ric studies; normal defecation within 6 months before manometric studies: stool frequency < 3 times/day and > 3 times/week, stool form type in Bristol 3-5 and type Bristol 4 for more than 3/4 of the time, defecation time < 10 min, no
defecation straining, no sense of incomplete evacuation and anorectal obstruction, never defecate with hand assisting, no bowel-related abdominal pain, no fecal incontinence. Exclusion criteria includes: male gender; age over 60 years, age under 18 years; previous surgeries for pelvic floor disorders, gastrointes-tinal tract (including anorectum) and genitouri-nary system; histories pelvic trauma and lateral episiotomy or other vaginal surgery or lactating women; previous anorectal radiation.
All the enrolled participants had a clinical inter-view and physical examination before the study. Then all of them underwent the 3DHRAM, the amplitude of the high-pressure zone’s down-ward movement during squeezing was record-ed. Quantitative measurements were made for estimating the reference range and cut-off values.
Conventional defecography
The participants were put in the left lateral position and 200 ml semi-solid barium past prepared in advance was injected into the rec-tum until the sensation of defecation occurred. Afterward, the participants were asked to sit on a special commode parallel to the X-ray table for lateral visualization of the anal canal and rectum, contract the pelvic floor musculature and empty the rectum as completely as possi-ble. Radiographs were taken at rest, squeezing, and during defecation of the contrast. The coc-cyx, sacrum, head of the femur, posterior wall of the rectum, and anal canal were identified. As for conventional defecography, perineal descent can be measured as the vertical dis-tance between the pubococcygeal line and the anorectal junction. In normal subjects, the perineum descends 1-3 cm [9] during the evac-uation, the distance of more than 3 cm in the position of the anal canal between rest and bearing down was considered PD for nullipara, while the distance of more than 3.5 cm was considered PD for multipara [10].
Manometry
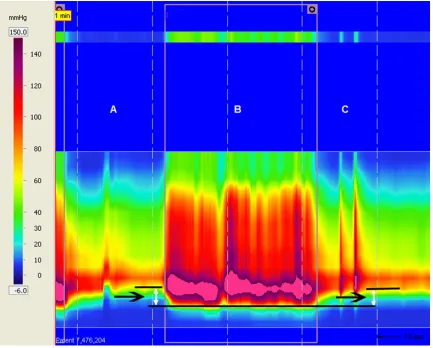
ischi-al tuberosity. The probe was placed in the anischi-al verge. The anal canal high-pressure zone was captured with some clearance on the cranial (rectal pressures) and caudal (atmospheric pressure) ends. The circular orientation of the probe was maintained by the practioner during rest and bearing down with the aid of markings on the probe. Separate measurements were obtained at rest and defecation, respectively. The location of the perineal area at rest was measured by using the scale of the probe. The participants are asked to perform the action of defecation as completely as possible, and the new location of the perineal area was mea-sured. The difference in the values between the first and the second measurements was the extent of perineal descent. The amplitude of downward and upward movement of high-pres-sure zone during the defecation can be seen in Figure 1 while the obvious change in the three dimensional morphology can be seen in Figure
2. The downward movements of high-pressure zone during the defecation were recorded and the cut-off values were established.
With the diagnostic criterions for PD by using 3DHRAM forecasted above, 270 adult female patients (116 nullipara patients, mean age 24.7 years, ranging in age from 18 to 29; 154 parous patients, mean age 49.2 years, ranging in age from 23 to 58) with anorectal disfunc-tions underwent the conventional defecogra-phy and 3DHRAM examinations to identify the PD. The diagnosis results were recorded and the data was compared. All the participants provided informed written consent. The rese- arch was conformed to the ethics committee of the Tianjin Union Medical Center.
Statistical analysis
analysis, which was used to establish the refer-ence ranges and cut-off value; <2>. Chi-squared tests and Kappa coefficient statistics, which were used to assess agreement between 3DHRAM and conventional defecography in the evaluation of PD.
The mathematical formulas of mean deviation and standard deviation are described in equa-tion (1) and equaequa-tion (2). Based on these two statistical methods, the cut-off value for nullip-arous individuals was 6.4 mm (95% CI: 5.2-8.6). The reference range was 0-6.4 mm. The cut-off value for parous was 10.6 mm (95% CI: 8.1-12.4). The reference range was 0-10.6 mm. The mathematical formula of mean deviation is:
Mean deviation = / x -N n (1)
The standard deviation value can be calculated by the mathematical formula:
Standard deviation = i 1(xi )2 N
N
1 -n
=
/ (2) Where μ is the mean value, which is defined by:
xi i 1 N
N 1
=
n /= . xi is each value. Then N is the number of all the values.
Chi-square is a statistical test method which is commonly used to compare observed data with data we would expect to obtain according to a specific hypothesis, which is also referred to as X2 test. The formula for calculating chi-square is described in equation 3.
X2 =
e (o e)- 2
/
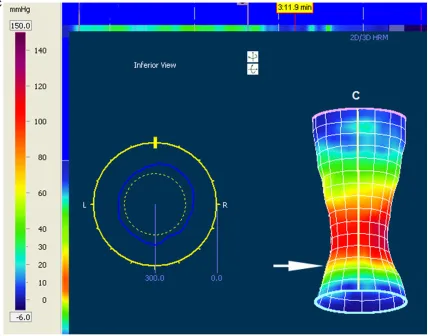
[image:5.612.95.523.73.409.2](3) Where “o” indicates the observed data; “e” indi-cates the expected data. Chi-square is the sum Figure 2. Three dimentional morphology during the evacuation. State A, resting phase, the white arrow stands for
A retrospective study in 249 cases
of the squared difference between observed “o” and the expected “e” data (or the deviation), divided by the expected data in all the possible categories [11].
Kappa coefficient is a statistic which evaluates the inter-rater agreement for qualitative items. It is more robust agreement measurement than simple percent agreement calculation, because kappa coefficient considers the agreement happening by chance.
Kappa coefficient is commonly calculated by equation 4.
k =
1 expected agreement observed agreement expected agreement
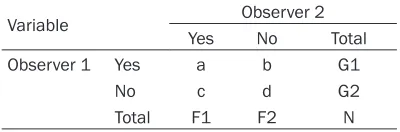
1 p p p e o e -= (4) Here one example is used to explain the princi-ple of Kappa coefficient calculation. Suppose two observers are analyzing a group of samples in Table 1. “a” and “d” represent the numbers of samples the two observes agree, while “b” and “c” represent the number of samples the two observes disagree [12].
Then, observed agreement and expected agr- eement can be calculated by equation 5 and equation 6.
Po= a dN
+
^
h
(5)
P N N
F1 G1 N F2 G2 e= + ) )
`
j
`
j
(6) It is defined that: 0, no agreement between the 2 techniques; 0.00 to 0.19, poor agree-ment; 0.20 to 0.39, fair agreeagree-ment; 0.40 to 0.59, moderate agreement; 0.60 to 0.79, substantial agreement; and 0.80 to 1.00, per-fect agreement. For all tests, a P value of < 0.05 was considered statistically significant. In order to improve efficiency, all data were analyzed by the statistical software package SPSS 13.0 (Chicago, Illinois, USA), which embeds all of above statistical analysis methods.
Results
Cut-off values and reference ranges
The distribution of the high-pressure zone’s downward movement data was predicted as non-Gaussian distribution by normality test. They had a nearly normal distribution when log10 transformed. The fluctuation amplitude of the high-pressure zone from two groups could be seen in Table 2. The cut-off values by mean and standard deviation on the logarith-mic scale were transformed back to the original units to establish the reference range: 0-6.4 mm for nullipara and 0-10.6 mm for pruripara. Pruripara group: the amplitude of high-pressure zone’s descent ranged from 7.9 mm to 13.6 mm, cut-off value was 10.6 mm (95% CI: 8.1-12.4). Nullipara group: the amplitude of high-pressure zone’s descent ranged from 5.3 mm to 9.7 mm, cut-off value was 6.4 mm (95% CI: 5.2-8.6).
Agreement between two methods
For 3DHRAM, rates of diagnostic concordance with conventional defecography were high for the assessment of perineal descent. The agree-ment for nulliparous patients regarding diagno-sis of PD by using two methods was shown in Table 3. Overall, the agreement between two methods in nulliparous patients was classified as substantial (k = 0.786, Chi-Square Tests P = 0.508).
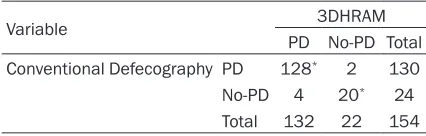
As for the parous patients, the index of agree-ment between conventional defecography and 3DHRAM with regard to the diagnosis of peri-neal descent was high, classified as perfect (kappa 0.847; Chi-Square Tests P = 0.688). The result was shown in Table 4.
Discussion
Perineal descent was frequent phenomenon. Doctors need more information on the accura-cy of available diagnostic techniques to make therapeutic decisions. Choosing the most suit-able treatment for perineal descent required a complete clinical investigation and examination techniques capable of identifying anatomical and functional abnormalities. Conventional defecography was an established method which had been used as the gold standard technique in assessing PD [13, 14]. This con-Table 1. An example showing the calculation
process of Kappa coefficient
Variable Observer 2
Yes No Total
Observer 1 Yes a b G1
No c d G2
[image:6.612.89.289.98.164.2]ventional defecography technique evaluated of the PD in relation to the pubococcygeal line. Perineal descent was defined as the descent of the anorectal junction from rest to evacuation and could be measured as vertical distance between the pubococcy-geal line and the ano-rectal junction, same as the vertical distance between the upper anal canal (anorectal junc-tion) and pubococcygeal line. In normal nullipa-rous individuals, the perineum descends less than 3 cm, while in normal multiparas. The dis-tance was less than 3.5 cm. A difference of more than 3 cm in the position of the anal canal during the defecation was considered perineal descent for the nulliparous while 3.5 cm for the parous.
However, conventional defecography must be performed in a specific radiologic environment.
Patients had to be exposed to radiation. What was more; the pubic bone could not be visual-ized in clinic practice mostly, which always gen-erated the discrepance of the diagnosis. Additionally, conventional defecography was poorly tolerated by elderly patients, especially during extended exams. With the development of medical technology, a great amount of equip-ments were invented to redeem the deficiency of conventional defecography for the past few years. 3DHRAM was a new technique that pro-vided a simultaneous assessment of pressures and topographical changes in 3 dimensions. With this novel implement, the fluctuation of anorectal pressure could be seen in direct style during the defecation and it could verdict the PD through the downwards movement of the high-pressure zone (Figure 2B), which was simi-lar to the modality of perineometer, but more advanced than the latter. Compared with con-ventional defecography, the estimation of PD by 3DHRAM was based on the descent of the high-pressure zone during squeezing, which corresponded to the descent of the anal canal. 3DHRAM required no bony anatomic relation-ships and only assessed the downward move-ment of the high-pressure zone without knowl-edge of the initial position of the anorectal junction.
[image:7.612.90.522.85.192.2]Different from traditional manometry based on linear waves, this newly developed manometry method provided more accurate changes dur-ing the squeezdur-ing in 3 dimensions [15]. The 3D spatiotemporal plots could be showed as col-ored images representing pressure, distance and time [16]. The probe was equipped with 256 tactile pressure microtransducers, a solid state catheter was across the anorectal canal, which was used to measure the anorectal canal pressures and the movement of anal canal Table 2. The data of two groups from 249 asymptomatic volunteers, who underwent the 3DHRAM
Variable Nullipara (n = 102) Pruripara (n = 147) P value
Mean ± s.e.m 95% CI Mean ± s.e.m 95% CI
Maximum resting pressure (mmHg) 67.4±4.1 63.8-75.7 65.8±2.8 62.6-73.8 0.413 Mean resting pressure (mmHg) 62.7±2.5 57.4-64.1 60.8±2.9 56.4-63.7 0.748
Maximum squeeze pressure (mmHg) 187.4±6.5 171.2-205.5 164.8±8.3 152.8-175.3 0.011*
High-pressure zone length (cm) 3.7±0.1 3.3-3.9 3.5±0.1 3.4-3.7 0.756
Fluctuation of HPZ during defecation (mm) 6.4±0.9 5.2-8.6 10.6±1.4 8.1-12.4 0.046* Anal relaxation rate (%) 21.7±3.2 16.4-27.5 25.1±2.6 18.7-30.2 0.925
[image:7.612.90.304.261.327.2]Note: HPZ: high-pressure zone. Date expressed as mean ± s.e.m or 95% confidence interval (95% CI). *P < 0.05.
Table 3. Agreement between 3DHRAM and con-ventional defecography regarding diagnosis of PD in nulliparous patients
Variable 3DHRAM
PD No-PD Total Conventional Defecography PD 84* 6 90
No-PD 3 23* 26
Total 87 2 9 116
“*” concordant findings.
Table 4. Agreement between 3DHRAM and con-ventional defecography regarding diagnosis of PD in parous patients
Variable 3DHRAM
PD No-PD Total Conventional Defecography PD 128* 2 130
No-PD 4 20* 24
Total 132 22 154
[image:7.612.89.302.398.466.2]A retrospective study in 249 cases
high-pressure zone at rest and defecation (Figure 1). All the data from measurements were analysed using MANOVIEWTM software (Sierra Scientific Instruments, Los Angeles, California, USA), which could provide a detailed topographical and three dimentional pressure gradient representation.
The probe was plug into the anal canal. The parameters of the high-pressure zone were obtained. The length of high-pressure zone changed slightly during the evacuation so we just pay attention to the inferior border of the high-pressure zone. At the end of the evacua-tion, the inferior border of high-pressure zone regained its initial position, demonstrating that the position of the probe had not moved during the evacuation. The amplitude of downward and upward movements of the inferior border could be seen in Figure 1.
Pregnancy and Delivery were important risk factors for pelvic descending. Pelvic floor endured more pressure during the telophase of the pregnancy. Pudendal nerve was considered to be injured during the delivery [17, 18], espe-cially in first stage of the labor. So the subjects were divided into two groups and the criterion standards were established for each group, which was similar to the criterion of convention-al defecography. Among the 154 mulipara patients with dyschesia, 35 of them underwent at least 1 cesarean section, the reason why we didn’t subdivide the parous group according to the style of delivery was that the main influence of this parturition on the pelvic floor muscle was in first stage, and on the whole, influence on the pelvic musculus from the cesarean sec-tion was similar to spontaneous delivery, which was agreed by many investigators in recent years [19]. The Kappa value of nulliparous group from 270 female patient with dyschezia was lower than that of parous group, the possi-ble reason could be the different elasticity between the nullipara and the pouripara. The data from the measurement of the high-pressure zone’s downward movement was simi-lar to normal distribution after the log10 trans-formed. The reference ranges and cut-off val-ues were obtained by mean and standard devi-ation. The reference ranges were also obtained by percentages method and the 5th percentile of the measurements in the reference group were available, but it was less convincible
com-pared with the mean method. For comparison of the PD’s diagnosis between conventional defecography and 3DHRAM, the Chi-squared test was used and the kappa coefficients were calculated to verify the agreement between two methods.
Although the position in which we placed our participants for the 3DHRAM was considered standard practice for anorectal manometry, the body position could have influenced the results of this study [20-22]. The movement of high-pressure zone during squeezing was measured with the participant in the left lateral decubitus position, while the conventional defeacography test was performed with the participants in a physiologically seated position which was cur-rently the only “physiological” defecation posi-tion. Anyway, we suggest that the effect of body position should be further explored in future studies. However, there were some limitations in this study. The parity was not calculated in the normal subjects. It was reported that the frequency of delivery was related with the impairment of pudendal nerve [23-26]. Next, the body mass index (BMI) was not taken into account in the study. A recent study has report-ed the association between BMI and anorectal pressure measured by 3DHRAM [27, 28]. Another limitation was the relatively small num-ber of asymptomatic volunteers. What was more, this study did not include fecal inconti-nence patients to compare with the constipat-ed patients, which was a speculative study in future.
Conclusion
In conclusion, 3-DHRAM was shown to be a reli-able technique for the assessment of perineal descent with the reference ranges established in this research. With its minimally invasive, comfortable position and well tolerated, 3D- HRAM may be another suitable method used to assess the PD patients in future.
Acknowledgements
The authors gratefully acknowledge the finan-cial support provided for this study by the Pelvic Floor Center, Tianjin Union Medical Center.
Disclosure of conflict of interest
Address correspondence to: Dr. Zonghai Huang, Department of Colorectal Surgery, Zhujiang Hospital,
Southern Medical University, Guangzhou 510282,
Guangdong, PR China. Tel: 86-020-61643213; Fax:
86-020-61643213; E-mail: guangzhouhuangzh@
163.com
References
[1] Porter NH. 1 A physiological study of the pelvic
floor in rectal prolapse. Ann R Coll Surg Engl
1962; 31: 379-404.
[2] Parks AG, Porter NH and Hardcastle J. The syn-drome of the descending perineum. Proc R Soc Med 1966; 59: 477-482.
[3] Henry MM, Parks AG and Swash M. The pelvic
floor musculature in the descending perineum
syndrome. Br J Surg 1982; 69: 470-472. [4] Nygaard I, Handa VL, Brubaker L,
Borello-France D, Wei J, Wells E, Goode P; Pelvic Floor Disorders Network. Changes in physical activi-ty after abdominal sacrocolpopexy for ad-vanced pelvic organ prolapse. Am J Obstet Gynecol 2008; 198: 570, e571-575.
[5] Locke GR 3rd, Pemberton JH and Phillips SF. AGA technical review on constipation. American Gastroenterological Association. Gastroenter- ology 2000; 119: 1766-1778.
[6] Noelting J, Ratuapli SK, Bharucha AE, Harvey DM, Ravi K and Zinsmeister AR. Normal values
for high-resolution anorectal manometry in
healthy women: effects of age and significance
of rectoanal gradient. Am J Gastroenterol 2012; 107: 1530-1536.
[7] Pehl C, Seidl H, Scalercio N, Gundling F, Schmidt T, Schepp W and Labermeyer S. Accuracy of anorectal manometry in patients with fecal incontinence. Digestion 2012; 86: 78-85.
[8] Vitton V, Grimaud JC and Bouvier M. Three-dimension High-resolution Anorectal Manome- try Can Precisely Measure Perineal Descent. J Neurogastroenterol Motil 2013; 19: 257-258. [9] Mahieu P, Pringot J and Bodart P. Defecography:
II. Contribution to the diagnosis of defecation disorders. Gastrointest Radiol 1984; 9: 253-261.
[10] Brennan D, Williams G and Kruskal J. Practical
performance of defecography for the evalua-tion of constipaevalua-tion and incontinence. Semin Ultrasound CT MR 2008; 29: 420-426. [11] Fisher RA and Yates F. Statistical tables for
bio-logical, agricultural and medical research. Statistical tables for biological, agricultural and medical research. 1949.
[12] Viera AJ and Garrett JM. Understanding in-terobserver agreement: the kappa statistic. Fam Med 2005; 37: 360-363.
[13] Mackle EJ and Parks TG. The pathogenesis and pathophysiology of rectal prolapse and solitary rectal ulcer syndrome. Clin Gastro- enterol 1986; 15: 985-1002.
[14] Mellgren A, Bremmer S, Johansson C, Dolk A, Uden R, Ahlback SO and Holmstrom B. Defe- cography. Results of investigations in 2,816 patients. Dis Colon Rectum 1994; 37: 1133-1141.
[15] Jones MP, Post J and Crowell MD. High-resolution manometry in the evaluation of ano-rectal disorders: a simultaneous comparison with water-perfused manometry. Am J Gas- troenterol 2007; 102: 850-855.
[16] Rao SS. Advances in diagnostic assessment of fecal incontinence and dyssynergic defeca-tion. Clin Gastroenterol Hepatol 2010; 8: 910-919.
[17] Landmann RG and Wexner SD. Paradoxical puborectalis contraction and increased peri-neal descent. Clin Colon Rectal Surg 2008; 21: 138-145.
[18] Andromanakos N, Skandalakis P, Troupis T and Filippou D. Constipation of anorectal outlet ob-struction: pathophysiology, evaluation and management. J Gastroenterol Hepatol 2006; 21: 638-646.
[19] Lee SJ and Park JW. Follow-up evaluation of
the effect of vaginal delivery on the pelvic floor.
Dis Colon Rectum 2000; 43: 1550-1555. [20] Barnett JL, Hasler WL and Camilleri M. Ame-
rican Gastroenterological Association medical position statement on anorectal testing
tech-niques. American Gastroenterological
Asso-ciation. Gastroenterology 1999; 116: 732-760.
[21] Jorge JM, Ger GC, Gonzalez L and Wexner SD.
Patient position during cinedefecography.
Influence on perineal descent and other mea -surements. Dis Colon Rectum 1994; 37: 927-931.
[22] Thekkinkattil DK, Lim MK, Nicholls MJ, Sagar
PM, Finan PJ and Burke DA. Contribution of posture to anorectal manometric measure-ments: are the measurements in left-lateral position physiologic? Dis Colon Rectum 2007; 50: 2112-2119.
[23] Snooks SJ, Setchell M, Swash M and Henry
MM. Injury to innervation of pelvic floor sphinc -ter musculature in childbirth. Lancet 1984; 2: 546-550.
[24] Hehir MP, O’Connor HD, Higgins S, Robson MS,
A retrospective study in 249 cases
[25] Harewood GC, Coulie B, Camilleri M, Rath-Harvey D and Pemberton JH. Descending perineum syndrome: audit of clinical and
labo-ratory features and outcome of pelvic floor re -training. Am J Gastroenterol 1999; 94: 126-130.
[26] Kepenekci I, Keskinkilic B, Akinsu F, Cakir P, Elhan AH, Erkek AB and Kuzu MA. Prevalence of pelvic floor disorders in the female popula -tion and the impact of age, mode of delivery, and parity. Dis Colon Rectum 2011; 54: 85-94.
[27] Ellington DR, Polin MR, Szychowski JM, Deng L
and Richter HE. The effect of obesity on fecal
incontinence symptom distress, quality of life,
and diagnostic testing measures in women. Int Urogynecol J 2013; 24: 1733-1738.
[28] Ihnat P, Vavra P, Gunkova P, Pelikan A and Zonca P. 3D high resolution anorectal
manom-etry in functional anorectal evaluation. Rozhl