AGGREGATES AND BINDERS
Author(s): Geraldine Walsh* Margaret O'Mahony+ Ian L. Jamieson*
*
National Roads Authority LaboratoriesPottery Road Kill of the Grange
Dun Laoghaire, Co. Dublin Ireland
Phone (353-1-285-2122)
+ Department of Civil Engineering Trinity College
Dublin 2 Ireland
* To whom correspondence should be addressed
Transportation Research Board 74th Annual Meeting
THE SHRP NET ADSORPTION TEST : APPLICATION TO IRISH CHIP-SEALING AGGREGATES AND BINDERS.
ABSTRACT
The Net Adsorption Test (M-001) developed for the SUPERPAVE mix design procedure is of interest to those concerned with the selection of binders and chippings for chip seals (surface dressings). In this paper, the relevance of the Net Adsorption Test (NAT), which is performed on the dust fraction, for assessing the adhesion performance of chipping sizes (14 mm) used for chip seals and the behaviour of bitumen emulsions is evaluated.
Since the surface chemical composition of 14mm chippings was not found to be statistically different from the composition of the dust from the crushed chippings it was accepted that NAT results were indicative of the adhesion performance of the chippings with the binder used in the test.
In testing bitumen emulsions the prior removal of the water phase by evaporation was necessary.
was assumed to be responsible for the very specific affinity of these binders for aggregates. This is consistent with results of SHRP studies on the effect of antistripping agents on bonding energies.
THE SHRP NET ADSORPTION TEST : APPLICATION TO IRJSH CHIP-sEALING AGGREGATES AND BINDERS.
INTRODUCTION
The Strategic Highway Research Program's (SHRP) Net Adsorption Test is based on the physical chemical adsorption of a solute (bitumen) from a solution onto a solid (road aggregate). The test provides a fundamental quantitative measure of the affinity between bitumen and aggregate and a means of measuring quantitatively the effects of factors such as moisture, bitumen additives, etc. on the bond.
Previous research, since 1950, has indicated the importance of the influence of aggregate type and properties on the aggregate/binder adhesion bond. Hallberg(l) conducted experiments, from 1950 - 1958, on the influence of aggregate petrography on the aggregate/binder adhesion bond and showed statistically that the adhesion performance of the bond was better with basic (low silica content) as opposed to acidic (silica content >66 percent) rocks.
high adsorption with limestone and low adsorption with granite, but the magnitude of the differences among the aggregates for each bitumen was quite large.
A routine NAT procedure was developed as a preliminary screening method (M-001) for aggregate/binder combinations in the SHRP SUPERPA VE mix design method(S). If this can be used to evaluate aggregate/binder combinations for chip sealing operations, it would be of particular value in European countries where chip-sealing (surface dressing) is a major road maintenance procedure. The purpose of this paper is to describe the results of an investigation involving aggregates and binders used in chip-sealing in Ireland.
ADSORPTION ISOTHERMS
The Net Adsorption test, as previously mentioned, is based upon the phenomenon of adsorption and in the SHRP investigation liquid adsorption isotherms were studied, as shown in Figure 1. The figure shows the influence of aggregate type on adsorption of bitumen over a range of bitumen solution concentrations.
resistant< 2
>.
OBJECTIVES
The purpose of this investigation was to determine if the net adsorption procedure could be used to assess the affinity of aggregate/binder combinations for chip sealing.
The M-001 procedure uses the fine aggregate, fraction 4.75 - 0.0 mm, (hereinafter referred to as "dust") of a hot-mix aggregate grading. However, in chip-sealing only single sized aggregates are used, usually 10 and 14 mm sizes, though even 16 mm or larger sizes are used in some circumstances. The net adsorption test is not practical with the aggregate sizes used in chip sealing since to maintain the same ratio of solvent volume to aggregate used in the research investigation a large quantity of the solvent would be required.
In addition the method must be applicable to the most common type of surface dressing binder which is bitumen emulsion.
The objectives therefore were:
(i) to determine if results obtained on the dust fraction are applicable to the performance of larger size chippings.
CALCULATIONS AND EVALUATION.
The NAT determines:
(i) The affinity between bitumen and aggregate - Initial adsorption.
(ii) The moisture sensitivity of the aggregate/binder bond - Net Adsorption or the amount of bitumen remaining on the aggregate after water is added.
In order to calculate both the initial and net adsorption three measurements on the solution of bitumen in the solvent (toluene) are carried out:
(i) Initial concentration of bitumen/toluene solution, A 1.
(ii) Solution concentration after 6 hours in contact with the aggregate, A2•
(iii) Solution concentration after addition of water to the aggregate/bitumen solution, A3.
The solution concentrations are determined by a spectrophotometer technique at 410nm.
The Initial Adsorption is given by : Ai = VC(A 1 - A 2) WA 1
where V = volume of solution - 140ml
The Net Adsorption is given by : An
=
where volume at this stage = 136ml.
Percent Net Adsorption =
~~
x 100 1VC(A 1 - A3)
WA1
These calculations are used in the standard procedure (M-001) and criteria for performance were suggested< 2> as shown in Table 1.
The authors found that the precision of the method was excellent using the graded dust fraction shown in Table 2. This is the grading used in the SHRP research investigations and unlike the grading used in M-001 it contains no passing 75JJIT1 fraction. Otherwise the fractions are in proportion with the standard asphalt concrete grading ASTM 03515. The use of a standard grading minimises variations in surface area which SHRP showed to have a major influence on the results of the test. On repeat testing of a number of aggregate/binder combinations the standard deviation was <0.05 mg/g compared to the value of 0.08 mg/g as reported SHRP. All results presented in this paper are the means of measurements carried out in triplicate.
of the total bitumen in the solution, a more discriminating assessment of affinity and resistance to stripping is possible. On re-evaluation, it is apparent that aggregate B actually has a lower initial adsorption, 42.7 per cent, than A, 48.2 per cent, and it has only a marginally better net percent adsorption value than A (35. 7 - 35.3).
The performance criteria in Table 1 are not applicable to the re-evaluated data and ranges of values associated with acceptable marginal and poor adhesion performance and resistance to stripping are unavailable at this stage. These need to be developed in the light of the known performance of aggregates and binders.
EXPERIMENTAL WORK
Effect of Aggregate Size:
Stepwise regression of the SHRP results( 2) indicated that the chemical and physical properties of the aggregate have a major influence on the net adsorption of the test results. These factors are listed in decreasing order of impact in Table 4.
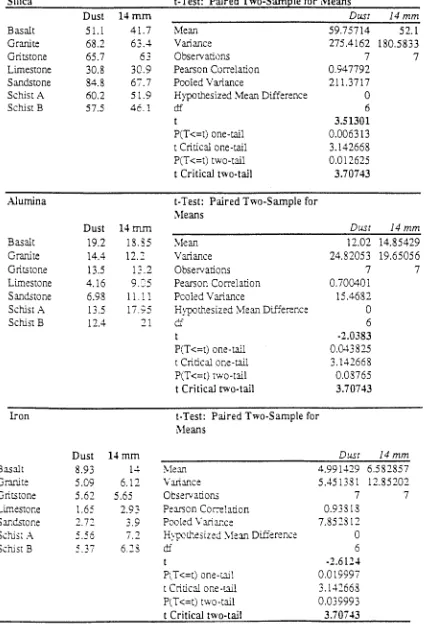
passing 100 JJif1 and analysed by X-Ray Fluorescence Spectroscopy. The elemental composition of the surface of the 14mm chippings and the bulk composition of the dust, obtained on crushing the chippings, are compared for all seven aggregates in Figure 2.
With the exception of silica (Si0 2) the composition of the surfacing of the chippings and the bulk composition of the dust were similar and varied only by the order of 2-4 percent. Though the silica contents varied by the order of 5-10 percent a t-test comparison for correlated samples showed that these differences are insignificant at a level of p<O.Ol. Based on the hypothesis that the means of the sample results i.e. 14rnrn size and crushed dust, are the same, J.ll
=
J.l2
or J.ll-J.l2
=
0, the significance of these differences was determined by comparing the calculated t value (from the results) with a critical t value at a particular significance level. These calculations are illustrated in Table 5. In view of this finding and the strong influence of chemical composition of the aggregate on NAT results, it was accepted that results carried out on the dust fraction can be used as an adhesion performance indicator of the larger, 10-14mm size, chippings with the binder used in the test.Testing using Bitumen Emulsions:
in the Net Adsorption test.
VALUES OBTAINED ON IRISH CHIP SEALING AGGREGATES AND BINDERS.
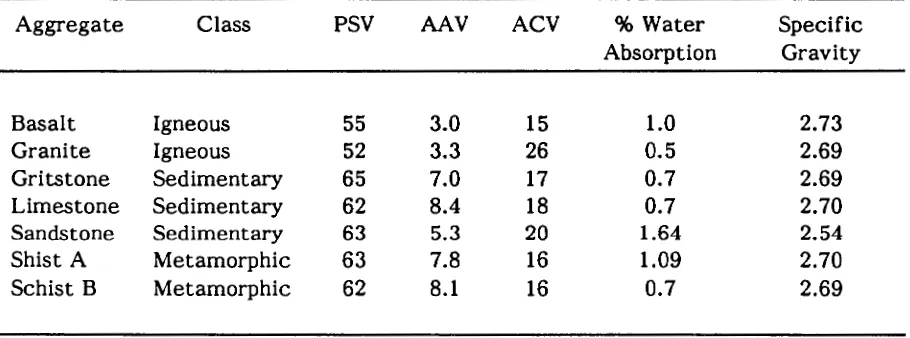
Seven Irish aggregates were selected for the test programme. These are typically used for chip sealing in Ireland and they comprised igneous, metamorphic and sedimentary categories of rock as shown in Table 6.
Binders were chosen from five different Irish suppliers: two paving grade bitumens (100 pen.) and three cationic bitumen emulsions.
Paving grade bitumens:
Table 7 and Figure 3 illustrate the results obtained for four of the aggregates with bitumens 1 and 2.
An interaction diagram (Figure 4) indicates that the influence of binder type varies according to the type of aggregate. In the case of granite and gritstone, bitumen 2 has an adverse effect on the net adsorption value indicating a greater suspectibility to stripping. With schist A and B, however, bitumen 2 has a positive effect on the net adsorption value, indicating a superior stripping resistance. Thus while the aggregate properties play a very significant role in determining the strength and durability of the bond, the type of binder can also have an important effect.
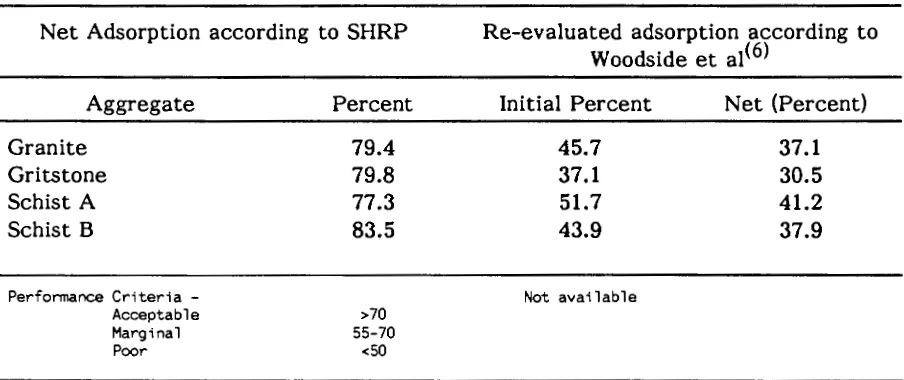
The results given by bitumen 2, with granite and gritstone in particular, are quite similar. However, re-evaluation of the results, as described previously, to express the initial and net adsorption as a percentage of the total bitumen in the solution shows (Table 8) that the adsorption behaviour varies quite considerably. It is clear that bitumen 2 has a greater affinity for granite with an initial adsorption of 45.7 percent compared with 37.1 percent for gritstone. The net adsorption values, of 37.1 and 30.5 percent respectively, indicate that the grits tone has a marginally higher stripping resistance than the granite.
Bitumen Emulsions:
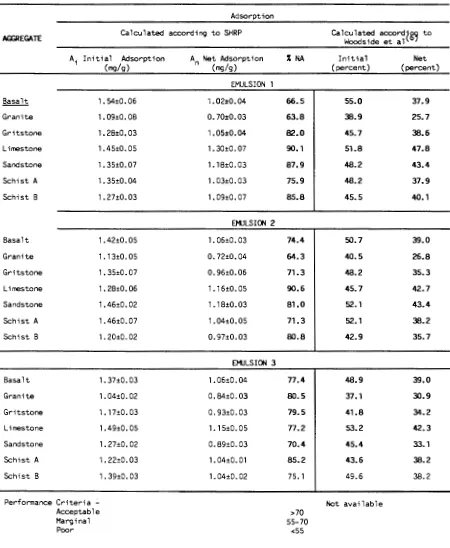
Table 9 presents the results obtained for the seven aggregates with the three cationic bitumen emulsions. The results are calculated according to both the SHRP and Woodside methods. Figure 5 illustrates the NAT results in bar-chart form.
of the adhesion bond than do the variations in the source of paving grade bitumens. For example, in the case of emulsion 1, basalt has a net adsorption value of 66.5 percent, limestone has a value of 90.1 percent and schist A a value of 75.9 percent. Comparison of Table 9 with Table 7 shows that some values are lower than those obtained with paving grade bitumens and some aggregate/emulsion combinations are actually below the acceptable limits of 70 per cent recommended by SHRP. Granite, with bitumen 1 and 2 has high net adsorption values of 83 and 79.4 percent respectively but with emulsions 1 and 2 substantially lower values, 63.8 and 64.3 percent, were obtained. Similar effects were observed with the gritstone in particular, with a 15 percent difference between bitumen 1 and emulsion 2. In some cases, therefore the emulsion type can have an adverse effect on the moisture sensitivity of the bond. The affinity of an aggregate and bitumen with surfactant appears to be unique for the type of surfactant and aggregate and SHRP investigations on bitumens modified with anti-stripping agents provided similar results, as shown in Figure 6.
The re-evaluated initial and net values, Table 9 and Figure 7, indicate that granite/emulsion combinations have the lowest affinity of all combinations of aggregate type and emulsion source. Initial and net adsorption values are 38.9 and 25.7 percent respectively with emulsion 1, 40.5 and 26.8 percent with emulsion 2 and 37.1 and 30.9 per cent with emulsion 3.
CONCLUSIONS
used to rank the affinity of Irish aggregate/binder combinations manufacture and for chip seals (surface dressings).
2. The chemical composition of the surface of 14mm chippings from seven different sources was not statistically different from the chemical content of the dust obtained on crushing the chippings and on this basis it was accepted that NAT results were indicative of the adhesion performance of surface dressing chippings when applied with the binder used in the test.
3. The procedure used for carrying out the test with bitumen emulsion binders is to first remove the water phase by evaporation so that the binder in the solvent comprises the bitumen with the surfactant.
4. The results obtained with aggregate/bitumen combinations confirm the SHRP findings that the aggregate type has a dominating influence on aggregate/binder adhesion. However, in testing aggregate/emulsion combinations the test showed
that the emulsion source had a major effect and the presence of the surfactant
Aggregate Emulsion Net Adsorption (Percent}
I Limestone Emulsion 1 90.1 Emulsion 2 90.6 Emulsion 3 77.2 Granite Emulsion 1 63.8 Emulsion 2 64.3 Emulsion 3 80.5
Sandstone Emulsion 1 87.9 Emulsion 2 81.0 Emulsion 3 70.4
This finding is consistent with results of SHRP studies in which the effect of antistripping agents on bonding energies were investigated.
ACKNOWLEDGEMENTS
REFERENCES
1 Hallberg, S. The Adhesion of bituminous binders and aggregate in the presence of water. J - Meddeland 1978, Statens Vaginstitut, Stockholm.
2. Curtis, C.W., Ensley, K., and j.Epps. Fundamental Properties of Asphalt-Aggregate Interactions Including Adhesion and Absorption. Report-A-341 Strategic Highway Research Program, National Research Council, Washington D.C. 1993.
3. Podoll, R.T., Becker, C.H. and K.C.Irwin. Surface Analysis by Laser Ionization of the Asphalt-Aggregate Bond. Phase 2 Progress Report (SRI International) Strategic Highway Research Program, National Research Council, Washington D.C. August 1991.
4. Labib, M.E. and P.J .Zanzucchi. Evaluation of Donor-Acceptor Properties of Asphalt and Aggregate Materials and Relationship to Asphalt Composite Performance. Phase II Report (David Sarnoff Research Center). Strategic Highway Research Program, National Research Council, Washington D.C. 1991.
5. Harrigan, E.T., Leahy, R.B. and j.S.Youtcheff. The SUPERPAVE Mix Design System Manual of Specifications, Test Methods and Practices. Report-A-379 SHRP A379. Strategic Highway Research Program, National Research Council, Washington D.C. 1994.
6. Woodside, A.R., Woodward, W.D.H., Russell, T.E.I. and R.A. Peden. The Relationship between Aggregate Mineralogy and Adhesion to Bitumen. Proceedings of a Symposium on Performance and Durability of Bituminous Mixtures. Department of Civil Engineering, University of Leeds, March 1994.
TABLE I Criteria suggested (SHRP) for Aggregate/Binder Adhesion Performance
Percent Net Adsorption
>70 55-70
<55
Aggregate/binder bond performance Good
TABLE 2 Grading used for the Net Adsorption Test
Sieve Size
2.36 mm 1.18 mm
600 J..lffi
300 J..lffi
150 J..lffi
75 J..lffi
Percent Retained
8.0 25.0 17.0 23.0 14.0 6.0
Weight Retained (g)
4.3 13.5 9.1 12.4
[image:19.612.73.549.124.282.2]TABLE 3 Recalculation of NAT Results as Suggested by Woodside et al
Calculated Net Adsorption according to SHRP
Aggregate A Aggregate B
Performance Criteria -Acceptable Marginal
Poor
Percent 71.3 80.8
>70 55-70
<55
Re-evaluated adsorption according to Woodside et al(6)
Initial percent 48.2 42.7
Not Available
[image:20.612.79.534.120.266.2]TABLE 4 The Influence of Aggregate Properties on Net Adsorption<2>
Aggregate Variables Potassium Oxide Surf ace Area Calcium Oxide Zeta potential Sodium Oxide
Correlation Coefficient 0.48
[image:21.612.76.534.110.224.2]Walsh et al 21 TABLE 5 Statistical t-test Analysis of the Silica, Alumina and Iron Content of Dust and 14nun Sizes of the Selected Aggregates
Silica t-Test: Paired Two-SarnEle for Means
Dust 14mm Dust 14mm
Basalt 51.1 41.7 Mean 59.75714 52.1
Granite 68.2 63..+ Variance 275.4162 180.5833
Gritstone 65.7 63 Observati1)ns 7 7
Limestone 30.8 30.9 Pearson Correlation 0.947792 Sandstone 84.8 67.7 Pooled Variance 211.3717 Schist A 60.2 51.9 Hypothesized Mean Difference 0
Schist B 57.5 46.1 df 6
3.51301 P(T<=t) one-tail 0.006313 t Critical one-tail 3.142668 P(T <=t) two-tail 0.012625 t Critical two-tail 3.70743
Alumina t-Test: Paired Two-Sample for
Means
Dust 14mm Dust 14mm
Basalt 19.2 18.S5 Mean 12.02 14.85429
Granite 14.4 12.2 Variance 24.82053 19.65056
Gritstone 13.5 13.2 Observations 7 7
Limestone 4.16 9.:5 Pearson Correlation 0.700401 Sandstone 6.98 11.11 Pooled Variance 15.4682 Schist A 13.5 17.'75 Hypothesized :Vfean Difference 0
Schist B 12.4 21 df 6
t -2.0383
P(T<=t) one-tail 0.043825 t Critical one-tail 3.142668 P(T <=t) two-tlil 0.08765 t Critical two-tail 3.70743
Iron t-Test: Paired Two-Sample for
Means
Dust 14 mrn Dust 14mm
Basalt 8.93 1-+ Mean 4.991-1-29 6.582857
Granite 5.09 6.12 Variance 5.451381 12.85202
Gritstone 5.62 5.65 Observations 7 7
Limestone 1.65 2.93 Pearson Correlation 0.93818
San<b-rone 2.72 3.9 Pooled Variance 7.852312 Schist :\ 5.56 ....
'·-
.., Hy~thesized :Vfean Difference 0Schist B ) . j
-
,., .... I 6.23 df 6 [image:22.612.100.524.146.772.2]TABLE 6 Mechanical and Physical Properties of Aggregates Selected for the Test Programme
Aggregate Class PSV AAV ACV %Water Specific
Absorption Gravity
Basalt Igneous 55 3.0 15 1.0 2.73
Granite Igneous 52 3.3 26 0.5 2.69
Grits tone Sedimentary 65 7.0 17 0.7 2.69
Limestone Sedimentary 62 8.4 18 0.7 2.70
Sandstone Sedimentary 63 5.3 20 1.64 2.54
Shist A Metamorphic 63 7.8 16 1.09 2.70
[image:23.612.80.535.138.307.2]TABLE 7 Percent NAT results obtained with Irish Aggregate and Bitumens
Bitumen 1 Bitumen 2
Aggregate Ai Initial An Net %NA Ai Initial An Net %NA Adsorption Adsorption Adsorption Adsorption
mg/g mg/g mg/g mg/g
Granite 1.16±0.02 0.96±0.02 83.0 1.28±0.05 1.01±0.01 79.4 Grits tone 1.14±0.02 0.99±0.01 86.8 1.04±0.02 0.83±0.02 79.8 Schist A 1.36±0.05 1.03±0.02 75.5 1.45±0.02 1.12±0.02 77.3 Schist B 1.49±0.02 1.20±0.03 80.9 1.23±0.02 1.02±0.02 83.5
Performance Criteria - Not available
Acceptable
>7-Marginal
[image:24.612.73.563.123.349.2]TABLE 8 Re-evaluation of Initial and Net Adsorption Data for Bitumen 2
Net Adsorption according to SHRP
Aggregate Granite
Grits tone Schist A Schist B
Performance Criteria -Acceptable Marginal Poor
Percent 79.4 79.8 77.3 83.5
>70 55-70
<50
Re-evaluated adsorption according to Woodside et a1< 6>
Initial Percent 45.7 37.1 51.7 43.9
Not available
[image:25.612.81.533.120.310.2]TABLE 9 Re-evaluated and SHRP Results for Irish Aggregates and Emulsions
Adsorption
AGGREGATE Calculated according to SHRP Calculated Woodside et al accord~g~ to
A; Initial Adsorption A n Net Adsorption %NA Initial Net
(mg/g) (mg/g) (percent) (percent)
EMULSION 1
Basalt 1. 54±0. 06 1.02±0.04 66.5 55.0 37.9
Granite 1.09±0.08 0.70±0.03 63.8 38.9 25.7
Grits tone 1.28±0.03 1. 05±0. 04 82.0 45.7 38.6
Limestone 1.45±0. 05 1. 30±0. 07 90.1 51.8 47.8
Sandstone 1. 35±0. 07 1.18±0.03 87.9 48.2 43.4
Schist A 1. 35±0. 04 1. 03±0. 03 75.9 48.2 37.9
Schist B 1. 27±0.03 1.09±0.07 85.8 45.5 40.1
EMJLSION 2
Basalt 1.42±0.05 1.06±0.03 74.4 50.7 39.0
Granite 1. 13±0. 05 0.72±0.04 64.3 40.5 26.8
Grits tone 1. 35±0. 07 0.96±0.06 71.3 48.2 35.3
Limestone 1. 28±0. 06 1. 16±0. 05 90.6 45.7 42.7
Sandstone 1.46±0.02 1. 18±0.03 81.0 52.1 43.4
Schist A 1. 46±0. 07 1.04±0.05 71.3 52.1 38.2
Schist B 1. 20±0. 02 0.97±0.03 80.8 42.9 35.7
EMJLSION 3
Basalt 1.37±0.03 1.06±0. 04 77.4 48.9 39.0
Granite 1. 04±0. 02 0.84±0.03 80.5 37.1 30.9
Grits tone 1. 17±0. 03 0.93±0.03 79.5 41.8 34.2
Limestone 1. 49±0. OS 1.15±0.05 77.2 53.2 42.3
Sandstone 1.27±0.02 0.89±0.03 70.4 45.4 33.1
Schist A 1. 22±0. 03 1. 04±0. 01 85.2 43.6 38.2
Schist B 1. 39±0. 03 1.04±0.02 75.1 49.6 38.2
Performance Criteria - Not available
Acceptable >70
Marginal 55-70
Walsh et al Z7 FIGURE 1 Adsorption of a bitumen onto four different aggregates.
2.4
* * * * *
RC- Me
o o o o o
RL- Gu
* / *o o o o o
RH- Gr
~ ~ ~ ~ ~
RK- Bo
*
2.0
1
[image:27.612.109.546.152.643.2]/
*-
0"1 ... 0"1e
1.6
-"0 ill .0 ~ 0 U'l "0 co1.2
+l I: ::l~
0~
J
I
0.8
j
J
~
0.4
~
l
~
j
0. 0
-1
~-
r --,i 1 i 1 , i i ; i i 1 r r 1 r 1 1 1 1 1 1 1 1 1 1 1 l , 1-r~-
r r 1 1 1 10.0
0.2
0.4
0.6
0.8
e:rej.JnS ; :
""0 1\) 0
t11
llesea
~
c c.o
~ -~
~
(")
~ (;)3 c.~
a
?f.
g.s_
08 ~ ~-~ OP
~ ~ OS
a
09
"lsnp paqsru:::> pue
sa:>eJ.mS
2U1dd!Q:>
:UO!l!sOOWOJ
Z
I
>una~
I
aoe~ns
1
>ilns
~
a~e~ns
D
""0 1\:)
0 (]1
auoJspues
auoJsawn
08 00
~
:::.!!
" c.o ~
-~
~
n ~ ;-3
Q.~
-)!Ins
~
e::reJ.Jns
0
8 lS!LfOSct.
c.oen - -en en_
o en
ct3 c. en
-Walsh et al 29 FIGURE 3 NAT results: Irish aggregates and bitumens
100 90 80
'0
Q)
.a
...
0 (/) '0 <(
...
~ '0c: 50
co
-
~2 40
-
c:~
u 30
...
~ Q. 20 10 0cti ~
Vl c
cti cti
co
'-<.9
<lJ <lJ <lJ <( co
c c c
."§§ .~
0 0 0
:§ 1il 1il ..c ..c
<lJ '0 t.l t.l
·;:::
E c U) U)
<.9
:.J U) cti
[image:31.612.129.453.167.529.2]Walsh et al
FlGURE 4 Bitwnen/ Aggregate interaction diagram
88
86
84
82
'1J
QJ
.c
..
800
II)
'1J
<(
c:
QJ
E 78 B
iii 'E QJ
76
u
~
c..
74
72 ~·· ... ···
70
83.5
79.o_..,.
Granite
~Gritstone
- 6 - Schist A
77.j )( Schist B
~+---~
Binder 1 Binder 2
Bitumen Type
. 1
£
UOJSinUJ3 ll.'!
(; UOJSinUJ3
0
~
UOJSinUJ3 1!1
(/)
()
::r
~ CD
(/)
(/)
'"
:l () c. V> ::r~
0
)> :l
It>
dd.\1
dl1?5;u55v-
r-3" ~
0 ii> It>
CD @ V>
'" 2 0 0
V> :l :l
'"
FIGURE 6 NAT results: Influence of anti-strip agents 800 700 ;:-.::: ~
~ 600
"iU 500 u .5. ~400 ~ r:::
w 300 0'1
r::: '5 200
r::: 0 CD 100 0 600
... 500
~
~
'; 400
u .5. ~300 41 c w
~ 200
'5 c 0 100 CD 0 Granite RA Granite RA
Bitumen AAD + 0.05% Modifier
Greywacke
RH
Gravel RJ
Aggregate
Granite
RB
Bitumen AAM + 0.05% Modifier
Greywacke
RH
Gravel RJ
Aggregate
Granite
RB
~No modifier
IIAS-008
DAS-017
'I E:J No modifier !
llliiAS-008 I
, I
I ,
[image:34.612.148.483.152.354.2]Walsh et al
FIGURE 7 NAT results: Initial vs net adsorption. Calculated by Woodside method
<!
50-~
40t
-.:: 30 a.
.... 0 20 f/'1 "C I'll
-
Q) 10c::
~ 0 0
0 10
<! 50 2
~
"c:: 40
.2
Q. 30 ....
0
f/'1
20-'C i
I'll
-
Q) 10l
I2 I
I ~
0 0
0 10
<! 50 ..,..
2
~
0 40...:..
=
0
a
,_ 3o..,..0
f/'1 20 _.:._
'C
I'll
-
Q) 10 -2~
0 0
0 10
Emulsion 1
limesto schist B'ston~salt
ist A
11
20 30 40 50 60
% initial adsorption %lA
Emulsion 2
!/stone
schist B
20 30 40
so
60% initial adsorption %lA
Emulsion 3
20 30 40 50
% Initial adsorption %lA
[image:35.612.119.504.153.758.2]