Machine Learning Approach to Evaluate MultiLingual Summaries
Samira Ellouze and Maher Jaoua and Lamia Hadrich Belguith
ANLP-RG, MIRACL Laboratory, FSEG Sfax, University of Sfax, Sfax, Tunisia
[email protected], [email protected], [email protected]
Abstract
The present paper introduces a new Multil-ing text summary evaluation method. This method relies on machine learning ap-proach which operates by combining mul-tiple features to build models that predict the human score (overall responsiveness) of a new summary. We have tried several single and “ensemble learning” classiers to build the best model. We have experi-mented our method in summary level eval-uation where we evaluate the quality of each text summary separately. The cor-relation between built models and human score is better than the correlation between the baselines and the manual score.
1 Introduction
Nowadays, the evaluation of summarization sys-tems is an important step in the development cy-cle of those systems. In fact, it accelerates the cycle of development by giving an analysis of er-rors, making an optimization of systems and com-paring each system with others. The evaluation of text summary covers its content, its linguistic quality or both. Whatever the type of evaluation (content and/or linguistic quality), the evaluation of system summary output is a difficult task given that in most times there is not a single good sum-mary. In the extreme case, two summaries of the same documents set may have completely differ-ent words and/or sdiffer-entences with differdiffer-ent struc-tures. Several metrics have been evaluated the content, the linguistic quality and the overall re-sponsiveness of MonoLing text summaries. We can cite ROUGE (Lin and Hovy, 2003), BE (Hovy et al., 2006), AutoSummENG (Giannakopoulos et al., 2008), BEwTE (Tratz and Hovy, 2008) , etc. Some of those metircs can assess MultiLing text
summaries such as ROUGE and AutoSummENG. But, those features can only evaluate the content of MultiLing text summaries.
To encourage research to develop automatic multilingual multi-documents summarization sys-tems a new task, dubbed MultiLing Pilot (Gian-nakopoulos et al., 2011), has been introduced for the first time in TAC2011 conference. Later, the two workshops 2013 ACL MultiLing Pilot (Gian-nakopoulos, 2013) and MultiLing 2015 at SIGdial 2015 (Giannakopoulos et al., 2015) have been or-ganised with the same purpose as MultiLing Pi-lot 2011. The participated summarization sys-tems in the MultiLing task have been assessed us-ing automatic content metrics such as ROUGE-1, ROUGE-2 and MeMoG and a manual metric named Overall Respensiveness which covers the content and the linguistic quality of a text sum-mary. However, the manual evaluation of both the content and the linguistic quality of multilingual multi-documents summarization systems is an ar-duous and costly process. In addition, the auto-matic evaluation of only the content of summary is not enough because a summary should also have a good linguistic quality. For this reason, automatic metrics that evaluate the content and the linguis-tic quality of summaries from several languages should be developed. In this context, we propose a new method based on a machine learning ap-proach for evaluating the overall quality of auto-matic text summaries. This method could pre-dict the human score (Overall Reponsiveness) of English and Arabic text summaries by combining multiple content and linguistic quality features.
The rest of the paper is organized in the fol-lowing way: First in Section 2 we introduce the main metrics that have been proposed to evaluate text summaries; then in Section 3 we explain the methodology adopted in our work. In Section 4 we present the different experiments and results
for summary level evaluation. Finally, Section 5 describes the main conclusions and possible future works.
2 Related Works
The summary evaluation task started as Mono-ling evaluation task. Several manual and auto-matic metrics have been developed to evaluate the content and the linguistic quality of text sum-mary. Manual evaluation is expensive and time-consuming. Then, there is a need to assess text summaries automatically. One of the standards in automatic evaluation is ROUGE (Lin and Hovy, 2003). It measures overlapping content between a candidate summary and reference summaries. ROUGE metric scores are obtained through the comparison of common words: N-grams. Later, Giannakopoulos et al. (2008) introduced Auto-SummENG metric, which is based on statistical extracting of textual information from the mary. The information extracted from the sum-mary, represents a set of relations between n-grams in this summary. The n-n-grams and the re-lations are represented as a graph where the nodes are the N-grams and the edges represent the rela-tions between them. The calculation of the simi-larity is performed by comparing the graph of the candidate summary with the graph of each ref-erence summary. In a subsequent work, (Gian-nakopoulos and Karkaletsis, 2010) have presented Merge Model Graph (MeMoG) which is another variation of AutoSummENG based on n-gram graphs. This variation calculates the merged graph of all reference summaries. Then, it compares the candidate summary graph to the merged graph of reference summaries. Afterwards, the SIMetrix (Summary Input similarity Metrics) measurement was developed by (Louis and Nenkova, 2013); it assesses a candidate summary by comparing it with the source documents. The SIMetrix putes ten measures of similarity based on the com-parison between the source documents and the candidate summary. Among the used similarity measures we cite the cosine similarity, the di-vergence of Jensen-Shannon, the didi-vergence of Kullback-Leibler, etc.
Recently, (Giannakopoulos and Karkaletsis, 2013) proposed NPowER (N-gram graph Powered Evaluation via Regression) metric, which presents a combination of AutoSummENG and MeMoG. They build a linear regression model that
pre-dicts a manual (human) score. All the above metrics (ROUGE, AutoSummENG, NPowER and SIMetrix) are used in monolingual and multilin-gual summary evaluation. Same of those metrics are adapted to multilingual evaluation while oth-ers (i.e. AutoSummENG) can from the beginning, support multilingual evaluation.
3 Proposed Method
From Table 1, we notably remark that in the Ara-bic language, the correlation between ROUGE-2 and Overall Responsiveness is very low. In addition, almost no correlation exists between MeMoG, AutoSummENG, NPowER and Overall Responsiveness for the Arabic language. Perhaps, this is due to the complexity of the Arabic lan-guage structure. For the English lanlan-guage, we note that the correlation between automatic met-rics and Overall Responsiveness is better than for the Arabic language but it still low. This motivated us to combine those automatic metrics in order to predict Overall Responsiveness. So, the combina-tion of those metrics will give better correlacombina-tion. In addition, the Overall Responsiveness score is a real number between 1 and 5 which assesses the content and the linguistic quality of a text sum-mary. This means that we should combine multi-ple features related to the content and the linguis-tic quality of a summary. For this reason we have added multiple syntactic features. Then, a predic-tive model for each language is built by combining multiple features.
The basic idea of the proposed evaluation methodology is based on the prediction of the hu-man grade score (Overall Responsiveness) (Dang and Karolina, 2008) for a candidate summary in Arabic or English languages. This prediction is obtained by the extraction of features from the candidate summary itself, from comparing the candidate summary with the source documents or with reference summaries. To obtain the predic-tive model for each language, extracted features are combined using a linear regression algorithm. In the following subsections, we will first give the list of used features, then we move to the descrip-tion of the combinadescrip-tion scheme.
3.1 Used features
Table 1: Kendall’s Tau Correlation Between Gradings (R2, MeMoG, AutoSummENG, NPowER and OR) with p-value<0.1 from MultiLing 2013 corpus
Language R2 to OR MeMoG∗to OR AutoSummENG∗to OR NPowER∗to OR
Arabic 0.125 0.018 0.029 0.031
English 0.216 0.202 0.239 0.234
∗we give the kendall correlation for MeMoG, AutoSummENG and NPowER with parameters: minimum length of N-grams =
maximum length of N-grams = window size=3
features are:
• ROUGE Scores: ROUGE scores are de-signed to evaluate the content of a text sum-mary. They are based on the overlap of words N-grams between a candidate summary and one or more reference summaries. Accord-ing to (Conroy and Dang, 2008), ROUGE variants which take into account large con-texts may capture the linguistic qualities of the summary such as some grammatical phenomena. We mean that ROUGE vari-ants that use bigrams, trigrams or more can capture some grammatical phenomena from the well formation of reference sentences. For this reason, we include ROUGE scores which take into account large contexts in the ROUGE feature class:ROUGE-1 (R1), 2 (R2), 3 (R3), ROUGE-4 (RROUGE-4) and ROUGE-5 (R5) which calculate respectively words overlaps of bigrams, tri-grams, 4-grams and 5-grams.
• AutoSummENG, MeMoG and NPowER scores: Those three scores are based on N-grams graph (Giannakopoulos and Karkalet-sis, 2010) are used to assess the content and the readability of a summary. To calculate these scores, we should adjust three parame-ters: minimum length of N-grams, maximum length of N-grams and window size between two N-grams. In our experiments, we have used three configurations for each score. The first configuration gives 1 to minimum length of N-gram, 2 to maximum length of N-gram and 3 to window size. The second config-uration assigns 3 to minimum length of N-gram, 3 to maximum length of N-gram and 3 to window size. Finally, the third one at-tributs 4 to minimum length of N-gram, 4 to maximum length of N-gram and 3 to win-dow size. In fact, because Overall respon-sivness scores evaluate the content and the linguistic quality of summary, we have cho-sen the first configuration to assess the
con-tent and the two other configurations to cap-ture some grammatical phenomena from the well formation of reference sentences. We have assumed that also for those scores figurations which take into account large con-texts may capture the linguistic qualities of the summary.
• SIMetrix scores: we have used the follow-ing six scores calculated by SIMetrix (Louis and Nenkova, 2013) : the Kullback-Leibler (KL) divergence between the source docu-ments (SDs) and the candidate summary (CS) (KLInputSummary), the KL divergence be-tween the CS and the SDs (KLSummaryIn-put), the unsmoothed version of Jensen Shan-non divergence between the SDs and the CS (unsmoothedJSD) and the smoothed one (smoothedJSD), the probability of uni-grams of the CS given SDs (unigramProb), multino-mial probability of the CS given SDs (multi-nomialProb).
• Syntactic features: the syntactic structure of sentences is an important factor that can determine the linguistic quality of texts. (Schwarm and Ostendorf, 2005) and (Feng et al., 2010) used syntactic features to gauge the readability of text as assessment of read-ing level. While (Kate et al., 2010) used syntactic features to predict linguistic quality of natural-language documents. We imple-ment some of these features using the Stan-ford parser (Klein and Manning, 2003). We calculate the number and the average number of noun phrases (NP), verbal phrases (VP) and prepositional phrases (PP). The average number of each of the previous phrases is cal-culated as the ratio between the number of one of the previous phrase type and the total number of sentences.
3.2 Combination scheme
Then, We select the relevant ones using ”wrapper method”(Kohavi and John, 1997). This method evaluates subsets of features which allows to de-tect the possible interactions between features. It evaluates the performance of each subset of fea-tures, then it gives as a result the best one. This does not mean that the other features are not good, but it means that the combination of features from the best subset gives the best performance.
Now, to build the predictive model (combi-nation scheme) for a language, we have used several basic (single algorithms) and ”ensem-ble learning” algorithms, implemented by the Weka environment (Witten et al., 2011), using a regression method. For basic algorithms we use ”GaussianProcesses”, LinearRegression and SMOReg. For ”ensemble learning” algorithms, we use ”Bagging” (Breiman, 1996), ”AdditiveRe-gression”(Friedman, 1999), ”Stacking” (Wolpert, 1992) and ”Vote” (Kuncheva, 2004).
After testing the algorithms, we adopt the one that produces the best predictive model. The vali-dation of each model is performed by two meth-ods: cross-validation method with 10 folds and supplied test set method.
4 Evaluation
4.1 Corpus
In this article, we use the TAC 2011 MultiLing Pilot 2011 corpus (Giannakopoulos et al., 2011) and the MultiLing 2013 corpus (Giannakopoulos, 2013). The two corpus involve the source docu-ments, peer summaries, model summaries and au-tomatic and manual evaluation results. The first corpus is available in 7 languages. We use only the Arabic and English documents. For Arabic languages, there are seven participating systems and two baseline systems. While for English lan-guage, there are eight participating systems and two baseline systems. For each language, source documents are divided to ten collections of news-paper articles. Each collection includes ten articles related to the same topic. Each collection has three model (human) summaries. Each summarization system is invited to generate a summary for each collection of documents. For MultiLing 2013 cor-pus, This corpus is available in 10 languages. We use only the Arabic and English documents. For each collection, there are eight participating sys-tems, two baseline systems and 15 collections of newspaper articles. Each collection includes ten
articles related to the same topic. Each summa-rization system is invited to generate a summary for each collection.
4.2 Experiments and results
We have experimented our method in summary level evaluation (Micro-evaluation). At this level, we take, for each Summarizer system, each pro-duced summary in a separate entry. It is worth mentioning that this evaluation level is more dif-ficult than system level evaluation (i.e. where the average quality of a summarizing system is mea-sured) even for MonoLingual summary evalua-tion (Ellouze et al., 2013), (Ellouze et al., 2016). For each language, we have tested several sin-gle and “ensemble learning” classifiers integrated on Weka environment and based on regression method like GaussianProcesses, linearRegression, vote, Bagging, etc.
We validate our models using cross-validation with 10 folds and using supplied test set. For cross-validation method, we have calculated the features from ”MultiLing 2013” corpus. While, for supplied test set method we have used ”Mul-tiLing 2013” corpus as training set and ”MultiL-ing Pilot TAC’2011” corpus as test”MultiL-ing set. We have chosen to train our models on ”MultiLing 2013” corpus because we have more summaries in this corpus (150 summaries for Arabic and 149 for English). To evaluate the proposed method, we study the correlation of Pearson (Pearson, 1895), Spearman (Spearman, 1910) and Kendall (Kendall, 1938) between the manual scores (Over-all Responsiveness) and the scores produced by the proposed method. Furthermore, we report the ”Root Mean Squared Error” (RMSE) mea-sure generated by each model. This meamea-sure is based on the difference between the manual scores (Overall responsiveness) and the predicted scores.
Arabic Summary Evaluation
We begin with the experiments performed with Arabic language. The selected features for Ara-bic models are: autosummeng443,
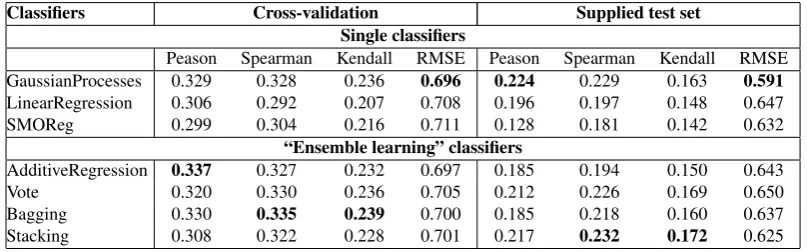
unsmoothed-JSD, unigramProb, multinomialProb, ROUGE-3 and number of NP phrases in the summary. The Pearson, the Spearman and the Kendall Correla-tions and the root mean square error (RMSE) gen-erated by each classifier for Arabic language are presented in Table 2.
Table 2: Pearson, Spearman and Kendall Correlations with Overall Responsiveness and RMSE (between brackets) for Various Single and Ensemble learning Classifiers for Arabic language
Classifiers Cross-validation Supplied test set Single classifiers
Peason Spearman Kendall RMSE Peason Spearman Kendall RMSE GaussianProcesses 0.329 0.328 0.236 0.696 0.224 0.229 0.163 0.591
LinearRegression 0.306 0.292 0.207 0.708 0.196 0.197 0.148 0.647
SMOReg 0.299 0.304 0.216 0.711 0.128 0.181 0.142 0.632
“Ensemble learning” classifiers
AdditiveRegression 0.337 0.327 0.232 0.697 0.185 0.194 0.150 0.643
Vote 0.320 0.330 0.236 0.705 0.212 0.226 0.169 0.650
Bagging 0.330 0.335 0.239 0.700 0.185 0.218 0.160 0.637
Stacking 0.308 0.322 0.228 0.701 0.217 0.232 0.172 0.625
several single and ensemble learning classifiers. In the case of cross validation method, the re-sults show that the model built from the ”en-semble learning” classifier ”Bagging” produced the best Kendall (0.239) and Spearman (0.335) correlations, ”AdditiveRegression” produced the best Pearson (0.337) correlation while the ”Gaus-sianProcesses” have produced the lowest RMSE (0.696). In the case of supplied test set method, Table 2 indicates that the best “ensemble learn-ing” classifier is the “Stacklearn-ing” which provides a model having a Kendall correlation of 0.171 and a Spearman correlation of (0.232) while the ”GaussianProcesses” have produced the best Pear-son (0.224) correlation and the lowest RMSE. An-other notable observation is that the correlation us-ing cross-validation is more important than usus-ing supplied test set. Whereas, the RMSE using sup-plied test set is lower than using cross-validation. This means that the error between the predictive values and the actual values is less important us-ing supplied test set. The decrease of correlation between the cross-validation method and the sup-plied test set method needs to be studied further in future works.
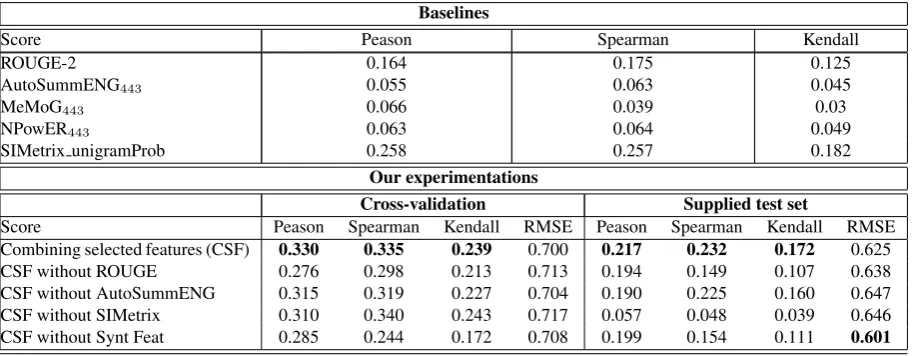
We pass now to the comparison between the performance of the best obtained model and the baseline metrics that were adopted by the Mul-tiLing workshop such as R-2, MeMoG and also we add the best variant of each of the three other famous metrics AutoSummENG, NPoWER and SIMetrix. Table 3 details the different correlations and RMSEs of baseline metrics and our different experimentations.
From Table 3, the model built from the com-bination of selected features has the best corre-lation and RMSE comparing to baselines. When observing the Table 3, we see the gap between
baseline metrics and the model build from selected features. In addition, we notice the decrease of correlation on both methods of validation (cross-validation, supplied test set), when we tried to re-move one of the classes of features. Moreover, we remark that removing SIMetrix metric from the se-lected features have a big effect on its correlation with Overall Responsiveness when using supplied test set as validation method.
Besides, we note that the correlation of the best model with Overall Responsiveness is low, while it is more important than the correlation of base-lines. This may be due to the small set of the ob-servations per Arabic language. We need a larger set of observations to determine the best combi-nation of features and to have better correlation. Furthermore, perhaps, this is due to the complex-ity of the Arabic language structure which is an ag-glutinative language where agglutination (Grefen-stette et al., 2005) occurs when articles, preposi-tions and conjuncpreposi-tions are attached to the begin-ning of words and pronouns are attached to the end of words. This phenomenon can greatly in-fluence the operation of comparing the candidate summary with reference summaries. Especially when a word appears in the candidate summary without agglutination while it appears in a refer-ence summary in an agglutinative form and vice versa.
English Summary Evaluation
We pass now to the different experiments per-formed with English language. The selected features for English models are NPowER123,
autosummeng443, the number of NP phrases in the
Table 3: Pearson, Spearman and Kendall Correlations with Overall Responsiveness Score and RMSE (between brackets) for Arabic language
Baselines
Score Peason Spearman Kendall
ROUGE-2 0.164 0.175 0.125
AutoSummENG443 0.055 0.063 0.045
MeMoG443 0.066 0.039 0.03
NPowER443 0.063 0.064 0.049
SIMetrix unigramProb 0.258 0.257 0.182
Our experimentations
Cross-validation Supplied test set
Score Peason Spearman Kendall RMSE Peason Spearman Kendall RMSE
Combining selected features (CSF) 0.330 0.335 0.239 0.700 0.217 0.232 0.172 0.625
CSF without ROUGE 0.276 0.298 0.213 0.713 0.194 0.149 0.107 0.638
CSF without AutoSummENG 0.315 0.319 0.227 0.704 0.190 0.225 0.160 0.647 CSF without SIMetrix 0.310 0.340 0.243 0.717 0.057 0.048 0.039 0.646 CSF without Synt Feat 0.285 0.244 0.172 0.708 0.199 0.154 0.111 0.601
classifier for English language are presented in Ta-ble 4.
Table 4 shows the performance of the selected features in building the predictive models using several single and ensemble learning classifiers for the English language. For cross validation method, the results show that the model built from the ”ensemble learning” classifier ”Bagging” pro-duced the best Kendall (0.393), Spearman (0.537) and Pearson (0.529) correlations and the lowest RMSE (0.652).
For supplied test set validation method, Table 2 indicates that the best “ensemble learning” classi-fier in terms of correlation and RMSE is also the “Bagging”. In fact, this ”ensemble learning” has the best correlations (i.e. Kendall: 0.322) and the lowest RMSE (0.754). Again, we note that the cor-relation using cross-validation is more important than using supplied test set. The decrease of cor-relation between the cross-validation method and the supplied test set method can be caused by the variation of the human evaluator and/or the change of evaluation guidelines from MultiLing 2011 to MultiLing 2013.
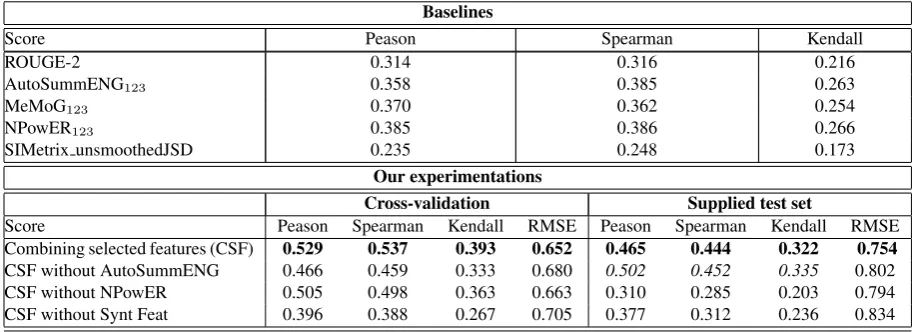
We now move to the comparison between the performance of the best obtained model and the baseline metrics that were adopted by the MultiL-ing workshop such as ROUGE-2 and MeMoG and also we add the best variant of each of the three other famous metrics AutoSummENG, NPoWER and SIMetrix. Table 5 details the different corre-lations and RMSEs of baseline metrics, other fa-mous metrics and our best model.
From Table 5, we see the gap between
base-line metrics and our experiments, with both vali-dation methods. We have retained the model built from the ”Bagging” classifier with both valida-tion methods. We observe also that the elimi-nation of one of the used classes of features de-creases the correlation of the best model (built from selected features) with Overall Responsive-ness and increases the RMSE. Furthermore, we note that the elimination of syntactic features class decreases enormously the correlation with the use of both methods of validation. The surprising noti-fication is that the elimination of AutoSummENG score increases the correlation instead of decreas-ing it. Generally, we have noted the effect of syn-tactic features in the best model for both languages (Arabic, English).
5 Conclusion
We have presented a method for evaluating the Overall Responsiveness of text summary in both Arabic and English language. This method is based on a combination of ROUGE scores, Au-toSummENG scores, MeMoG scores, NPowER scores, SIMetrix scores and a variety of syntactic features. We have combined these features using a regression method. Before building the linear re-gression model, we select the relevant features us-ing the ”Wrapper subset evaluator” method. The selected method includes automatic metrics and syntactic features. And generally automatic fea-tures that take into account large context are se-lected (autosummeng443, ROUGE-3, etc). This
con-Table 4: Pearson, Spearman and Kendall Correlations with Overall Responsiveness and RMSE (between brackets) for Various Single and Ensemble learning Classifiers for English language
Classifiers Cross-validation Supplied test set Single classifiers
Peason Spearman Kendall RMSE Peason Spearman Kendall RMSE GaussianProcesses 0.519 0.508 0.367 0.656 0.395 0.365 0.258 0.780 LinearRegression 0.514 0.490 0.353 0.658 0.236 0.384 0.277 1.542
SMOReg 0.510 0.5184 0.375 0.668 0.372 0.310 0.227 0.803
“Ensemble learning” classifiers
AdditiveRegression 0.522 0.499 0.360 1.092 0.276 0.427 0.313 3.028
Vote 0.523 0.522 0.380 0.661 0.232 0.395 0.285 1.475
Bagging 0.529 0.537 0.393 0.652 0.465 0.444 0.322 0.754
[image:7.595.96.500.99.225.2]Stacking 0.503 0.519 0.379 0.663 0.372 0.427 0.304 0.837
Table 5: Pearson, Spearman and Kendall Correlations with Overall Responsiveness Score and RMSE (between brackets) for Arabic language
Baselines
Score Peason Spearman Kendall
ROUGE-2 0.314 0.316 0.216
AutoSummENG123 0.358 0.385 0.263
MeMoG123 0.370 0.362 0.254
NPowER123 0.385 0.386 0.266
SIMetrix unsmoothedJSD 0.235 0.248 0.173
Our experimentations
Cross-validation Supplied test set
Score Peason Spearman Kendall RMSE Peason Spearman Kendall RMSE
Combining selected features (CSF) 0.529 0.537 0.393 0.652 0.465 0.444 0.322 0.754
CSF without AutoSummENG 0.466 0.459 0.333 0.680 0.502 0.452 0.335 0.802
CSF without NPowER 0.505 0.498 0.363 0.663 0.310 0.285 0.203 0.794
CSF without Synt Feat 0.396 0.388 0.267 0.705 0.377 0.312 0.236 0.834
tent scores which take into account large context may captivate some grammatical phenomena.
To evaluate our method, we have compared the correlation of the best model (built with selected features) and of baselines with manual Overall Re-sponsiveness.We have tested two methods of vali-dation of predictive models : cross valivali-dation with 10 folds and supplied test set. The results show that, in both languages, the correlation of the best model with Overall Responsiveness is low, while it is more importante then the correlation of base-lines. This may be due to the small set of the observations per language. We need a larger set of observations to determine the best combination of features and to have better correlation. More-over, we note that the correlation using cross-validation is more important than using supplied test set. The decrease of correlation between the cross-validation method and the supplied test set method needs to be studied further in future works. The main steps we plan to take in our future works, are the construction of predictive models
for more languages and the addition of other types of features such as entities based features, part-of-speech features, Co-reference Features, shallow features, etc.
References
Leo Breiman. 1996. Bagging predictors. Machine learning, 24:123–140.
John M. Conroy and Hoa T. Dang. 2008. Mind the gap: Dangers of divorcing evaluations of sum-mary content from linguistic quality. InProceedings of the22ndInternational Conference on Computa-tional Linguistics (Coling 2008), pages 145–152. H. Trang Dang and Owczarzak. Karolina. 2008.
Overview of the tac 2008 update summarization task. InIn TAC 2008 Workshop - Notebook papers and results, pages 10–23.
[image:7.595.70.532.272.438.2]Samira Ellouze, Maher Jaoua, and Lamia Hadrich Bel-guith. 2016. Automatic evaluation of a summary’s linguistic quality. In Proceedings of Natural Lan-guage Processing and Information Systems (NLDB). Lecture Notes in Computer Science, pages 392–400. Lijun Feng, Martin Jansche, Matt Huenerfauth, and Nomie Elhadad. 2010. A Comparison of Features for Automatic Readability Assessment. In Proceed-ings of the 23rd International Conference on Com-putational Linguistics (COLING 2010), pages 276– 284.
Jerome H. Friedman. 1999. Stochastic gradient boost-ing. Technical report, Stanford University.
George Giannakopoulos and Vangelis Karkaletsis. 2010. Summarization system evaluation variations based on n-gram graphs. InProceedings of the Third Text Analysis Conference, TAC 2010.
George Giannakopoulos and Vangelis Karkaletsis. 2013. Summary evaluation: Together we stand npower-ed. In Proceedings of 14th international conference on Computational Linguistics and Intel-ligent Text Processing - Volume 2, pages 436–450. George Giannakopoulos, Vangelis Karkaletsis, George
Vouros, and P. Stamatopoulos. 2008. Summariza-tion system evaluaSummariza-tion revisited: N-gram graphs.
ACM Transactions on Speech and Language Pro-cessing, 5(3):1–39.
George Giannakopoulos, Mahmoud El-Haj, Benot Favre, Marianna Litvak, Josef Steinberger, and Va-sudeva Varma. 2011. Tac 2011 multiling pilot overview. InProceedings of the Fourth Text Anal-ysis Conference.
George Giannakopoulos, Jeff Kubina, John M. Conroy, Josef Steinberger, Benot Favre, Mijail A. Kabadjov, Udo Kruschwitz, and Massimo Poesio. 2015. Mul-tiling 2015: MulMul-tilingual summarization of single and multi-documents, on-linefora, and call-center conversations. In Proceedings of the 16th Annual SIGdial Meeting on Discourse and Dialogue. George Giannakopoulos. 2013. Multi-document
mul-tilingual summarization and evaluation tracks in acl 2013 multiling workshop. In Proceedings of the MultiLing 2013 Workshop on Multilingual Multi-document Summarization.
Gregory Grefenstette, Nasredine Semmar, and Fa¨ıza Elkateb-Gara. 2005. Modifying a natural language processing system for european languages to treat arabic in information processing and information retrieval applications. In Proceedings of the ACL Workshop on Computational Approaches to Semitic Languages, pages 31–37.
Eduard Hovy, Chin-Yew Lin, Liang Zhou, and Junichi Fukumoto. 2006. Automated summarization eval-uation with basic elements. In Proceedings of the Fifth Conference on Language Resources and Eval-uation (LREC).
Rohit J. Kate, Xiaoqiang Luo, Siddharth Patwardhan, Martin Franz, Radu Florian, Raymond J. Mooney, Salim Roukos, and Chris Welty. 2010. Learning to predict readability using diverse linguistic features. InProceedings of the23rdInternational Conference on Computational Linguistics, pages 546–554. Maurice Kendall. 1938. A new measure of rank
corre-lation.Biometrika, 30:81–89.
Dan Klein and Christopher D. Manning. 2003. Ac-curate unlexicalized parsing. InProceedings of the 41st Annual Meeting on Association for Computa-tional Linguistics - Volume 1, pages 423–430. Ron Kohavi and George H. John. 1997. Wrappers
for feature subset selection. Artificial Intelligence, 97(1-2):273–324.
Ludmila I. Kuncheva. 2004. Combining Pattern Classifiers: Methods and Algorithms. Wiley-Interscience.
Chin-Yew Lin and Eduard Hovy. 2003. Auto-matic evaluation of summaries using n-gram co-occurrence statistics. In Proceedings of the 2003 Conference of the North American Chapter of the Association for Computational Linguistics on Hu-man Language Technology - Volume 1, pages 71–78. Annie Louis and Ani Nenkova. 2013. Automatically assessing machine summary content without a gold standard. Computational Linguistics, 39(2):267– 300, jun.
Karl Pearson. 1895. Mathematical contributions to the theory of evolution, ii: Skew variation in homoge-neous material. Philosophical Transactions of Royal Society London (A), 186:343–414.
Sarah E. Schwarm and Mari Ostendorf. 2005. Read-ing level assessment usRead-ing support vector machines and statistical language models. In Proceedings of the Annual Meeting of the Association for Computa-tional Linguistics, pages 523–530.
Charles Spearman. 1910. Correlation calculated from faulty data. British Journal of Psychology, 3:271– 295.
Stephen Tratz and Eduard Hovy. 2008. Bewte: ba-sic elements with transformations for evaluation. In Proceedings of Text Analysis Conference (TAC) Workshop.
Ian H. Witten, Eibe Frank, and Mark A. Hall. 2011.
Data Mining: Practical Machine Learning Tools and Techniques. Morgan Kaufmann Publishers Inc., San Francisco, CA, USA, 3rdedition.