Original Article
Optical coherence tomography and histologic
measurements of retinal and choroidal
thicknesses in guinea pig eyes
Tao Li, Xiaodong Zhou, Xiumei Luo, Bo Jiang
Department of Ophthalmology, Jinshan Hospital, Fudan University, 1508 Longhang Road, Shanghai, China Received November 21, 2015; Accepted February 3, 2016; Epub April 15, 2016; Published April 30, 2016
Abstract: Background: The purpose of this study was to evaluate optical coherence tomography and histologic measurements of retinal and choroidal thicknesses in guinea pig eyes, and assess the relationships between those thicknesses with spherical equivalent and axial length. Methods: Twelve tri-colored guinea pigs, aged from 5 to 6 weeks, were collected. Spherical equivalent (SE) was measured with a streak retinoscope. Axial length was deter-mined by A-scan ultrasonography. Retinal and choroidal thicknesses were measured by OCT and histology, respec-tively. Results: The Bland-Altman analysis showed that there were significant differences for retinal and choroidal thicknesses between the OCT and histology. Furthermore, choroidal thicknesses were correlated with SE and axial length, while there were no significant correlations between retinal thicknesses with SE and axial length. Retinal and choroidal thicknesses measured by OCT were positively correlated with histology. Conclusion: Retinal and choroidal thicknesses could be well measured from OCT images and histological sections with reasonable agreement. The degree of myopia and elongation of the globe are associated with thinning of choroidal thickness, while not with retinal thickness.
Keywords: Retinal thickness, choroidal thickness, OCT, histology
Introduction
Optical coherence tomography (OCT) is a nonin-vasive technology capable of producing high-resolution optical cross-sections of retina and choroid [1, 2]. Clinically, OCT is used in diagno-sis of retinal and choroidal diseases and to monitor structural changes of the retina and choroid, both post-treatment and during dis-ease progression [3-5]. Numerous studies have been conducted to evaluate the relationship between OCT and anatomic features in order to gain a better understanding and interpretation of OCT images [6-10]. In vitro reflectivity pro-files of retinal and choroidal structure could dif-fer from in vivo reflectivity profiles because the effects of fixation and perfusion of blood ves-sels may alter the optical properties of the reti-na and choroid. Furthermore, OCT instruments in different studies have different axial resolu-tions and more bands of reflectivity are appar-ent in the OCT signal from higher resolution instruments.
There is still debate regarding the precise rela-tionship between the OCT and the retinal thick-ness due to the subjective nature and the dif-ferences in design of the previous studies [4, 11]. Fourier-domain OCT has been established, enabling high-resolution (less than 5 μm) volu-metric images of the retina without eye move-ment artifacts [12]. The guinea pigs are a prom-ising alternative to other mammals for experi-mental myopia, as they are born with a well-developed visual system [13, 14]. The purpose of the present study was to compare Fourier-domain OCT and histologic measurements of retinal and choroidal thicknesses in guinea pig eyes, and evaluate the relationships between those thickness with spherical equivalent and axial length.
Methods Animals
in Thai town, Fengxian District, Shanghai City, China. Guinea pigs were reared at 25°C with a 12-12 h light-dark cycle. The animal research was approved by the Animal Care and Ethics Committee at Jinshan Hospital of Fudan Uni- versity, Shanghai, China. The treatment and care of the animals were conducted according to the ARVO Statement for the Use of Animals in Ophthalmic and Vision research.
Spherical equivalent and axial length
Biometric measures were performed in vivo to verify normal ocular development. Cycloplegia
[image:2.629.100.380.82.282.2]signal strengths of at least seven out of ten. We measured the thickness at the central point of the middle scan line located 3 mm away from the optical nerve head (Figure 1). The refractive power of each eye was compensated for by adjusting the focus knob to a value closest to the spherical value of the eye examined. Retinal thickness at the central point was deter-mined as the distance between the vitreoreti-nal interface and the boundary corresponding to the photoreceptor inner-outer segment junc-tion, using the Cirrus linear (Figure 2). Choroidal thickness was measured from the outer portion Figure 1. OCT image of a guinea pig eye. A: A single measuring point locating
3 mm away from optical nerve head. B: Optical nerve head.
Figure 2. OCT image of a guinea pig eye. The retinal and choroidal thickness-es at a single measuring point are 3000 μm away from optical nerve head. The retinal and choroidal thicknesses are 136 μm and 116 μm, respectively.
and dilation of the pupil was induced by 4 drops of tropi-camide 0.5%, and 30 minutes later spherical equivalent (SE) was measured with a streak retinoscope. Axial length was determined by A-scan ultraso-nography (10-MHz focused transducer; SUPER SW1000; Suoer electronic technology Co., Ltd., Tianjin, China). Fur- ther details of the biometric methodology have been des- cribed else where [13]. Ten repeated measurements we- re taken and the mean was recorded for analysis.
Optical coherence tomogra-phy
[image:2.629.100.384.331.522.2]of the hyperreflective line corresponding to the retinal pigment epithelium to the inner surface of the sclera at the central point, using the Cirrus linear (Figure 2). All measurements were made by the same examiner who was masked to the SE.
Histological processing
Full details of the histological processing proto-col have been previously described. Briefly, the eyes were enucleated and the posterior eyecup was immersion fixed in 2.5% glutaraldehyde and 1% paraformaldehyde in 0.1 M phosphate buffer, pH 7.2. Serial vertical semithin (1 μm) sections were cut on a microtome, stained with toluidine blue and micrographs were taken with an Olympus microscope. Retinal and choroidal thicknesses in micrometers were measured at ×400 magnification on a digital micrograph by manually identifying the position of the retinal and choroidal boundaries across the section, then measuring the distances between the boundaries (Figure 3).We measured the thick-ness at the same point located 3 mm away from the optical nerve head with OCT mea- surement.
Statistical analysis
SE was defined as spherical power plus half-negative cylinder power. All data are expressed
sured by OCT and histology; and (4) Axial length and choroidal thickness measured by OCT and histology. P < 0.05 was considered statistically significant.
Results
The mean SE refractive error (± SD) was + 0.44 ± 2.65 D and the mean axial length (± SD) was 8.31 ± 0.06 mm.The mean, SD and range of the retinal and choroidal thicknesses assessed by each modality are presented in Table 1. The Bland-Altman plots showed that the differenc-es of both parameters evenly spread around the mean difference without any specific trends (Figures 4 and 5). The range and 95% LoA were significant for retinal and choroidal thicknes- ses between the OCT and histology, showing in reasonable agreement. Retinal and choroidal thicknesses measured by OCT were positively correlated with histology (r2 = 0.47, P = 0.015,
and r2 = 0.77, P < 0.001; Figure 6A and 6B).
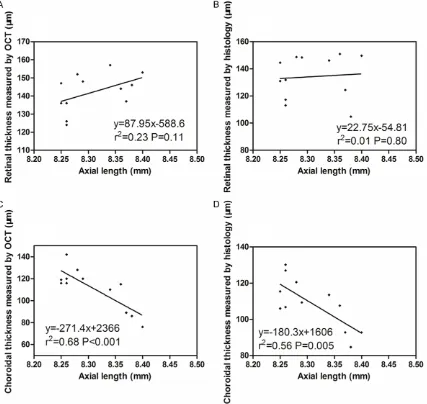
There were no significant correlations between SE and retinal thickness measured by OCT or histology (r2 = 0.24, P = 0.11, and r2 = 0.01, P =
0.79; Figure 7A and 7B). Furthermore, no sig-nificant correlations were found between axial length and retinal thickness measured by OCT or histology (r2 = 0.23, P = 0.11, and r2 = 0.01,
P = 0.80; Figure 8A and 8B). Choroidal thick-Figure 3. Histologic section of a guinea pig eye. The retinal and choroidal
thicknesses are the same tissue location measured in the OCT. The retinal and choroidal thicknesses are 91.08 μm and 73.62 μm, respectively. Scale bars, 50 μm.
[image:3.629.98.385.79.304.2]mea-nesses, whether measured by either OCT or histology were positively correlated with SE (r2
= 0.68, P = 0.001, and r2 = 0.58, P = 0.004;
Figure 7C and 7D), but negatively with axial length (r2 = 0.68, P < 0.001, and r2 = 0.56, P =
0.005; Figure 8C and 8D).
Discussion
The present study measured retinal and choroi-dal thicknesses from OCT images and histologi-cal sections. We verified that reasonable
agree-ment between OCT and histological thickness occurred using Bland-Altman plot analysis. In addition, we observed that choroidal thickness-es were significantly correlated with SE and axial length, in agreement with the finding of Marcus et al [15], which demonstrated a posi-tive correlation between choroid thickness and refractive error in guinea pigs. However, retinal thicknesses were not correlated with SE and axial length.
[image:4.629.253.527.90.441.2]OCT has been used in many experimental ani-mals (e.g., guinea pig [16], chicken [17], swine [9, 18], tree rat [19], mouse [8], and monkey [20, 21]). Anatomically, the optic disc of guinea pig is located in the temporal region of the fun-dus, without macula and fovea [16]. In this
Table 1. Characteristics of measurement data with statistical analysis (n = 12)
Modality Mean ± SD Minimum Maximum Mean difference ± SD
Retinal thickness OC 142.17 ± 10.46 124 157 7.96 ± 11.88
Histology 134.20 ± 16.22 104.74 150.93
Choroidal thickness OCT 111.42 ± 18.77 76 142 2.55 ± 9.46
[image:4.629.99.295.147.337.2]Histology 108.87 ± 13.83 84.66 130.18
Figure 4. Mean retinal thickness of OCT and histol-ogy (μm) versus difference.
Figure 5. Mean choroidal thickness of OCT and his-tology (μm) versus difference.
[image:4.629.99.293.388.540.2]study, we ensure that scan’s horizontal midline of OCT connected with the midline of optical nerve head, while the left end of scan line remains tangent to the right side of optical nerve head. With optical nerve head as physio-logical structure markers, this modality makes OCT can measure the same site of the retinal and choroidal thickness in guinea pigs with his-tological section.
Since Huang et al [6] firstly found that OCT reti-nal thickness corresponded to the retireti-nal
[image:5.629.99.533.80.501.2]not use Bland-Altman analysis. In this study, we calculated the retinal and choroidal thickness-es in a larger sample (n = 12). The Bland-Altman analysis showed that the retinal and choroidal thicknesses between the OCT and histology were in reasonable agreement. Furthermore, our results demonstrated that the thicknesses of retina and choroid directly measured by his-tology without calibration were significantly cor-related to OCT.
In the present study, the choroidal thickness was slightly thinner than the retinal thickness,
[image:6.629.104.531.82.486.2]they did not compared the OCT and histology values. Furthermore, our findings about the relationships between retinal and choroidal thicknesses with SE and axial length were also similar to some studies reported in human [25-27], suggesting similarity between guinea pig and human eyes.
One of the limitations of the current study is that only one location in the retina and choroid was measured in this study. Regional thickness differences have been reported in the retina of guinea pigs [19]. Further study will be warrant-ed to measure the retinal and choroidal thic- knesses at multiple locations. Furthermore, additional noise components, including inher-ent irregularity of histologic boundaries, subjec-tive judgment required in positioning histologic boundaries, would act to reduce the correla-tions between OCT and histology.
In conclusion, retinal and choroidal thickness-es could be well measured from OCT imagthickness-es and histological sections. Bland-Altman plot suggests they are in reasonable agreement. Furthermore, the degree of myopia and elonga-tion of the globe are associated with thinning of choroidal thickness, while not with retinal thickness.
Acknowledgements
This work was supported by Grant from Shang- hai Municipality Health Bureau Youth Project (2013-121) and Grant from Shanghai Munici- pality Science and Technology Commission Project (13ZR1405800).
Disclosure of conflict of interest
None.
Address correspondence to: Xiaodong Zhou, De- partment of Ophthalmology, Jinshan Hospital, Fudan University, 1508 Longhang Road, Shanghai, China. Tel: 021-34189990; Fax: 021-67226910; E-mail: xdzhou_2013@163.com
References
[1] Ahn SJ, Woo SJ, Park KH, Jung C, Hong JH, Han MK. Retinal and choroidal changes and visual outcome in central retinal artery occlusion: an optical coherence tomography study. Am J Ophthalmol 2015; 159: 667-76.
[2] Vincent SJ, Collins MJ, Read SA, Carney LG. Retinal and choroidal thickness in myopic
an-isometropia. Invest Ophthalmol Vis Sci 2013; 54: 2445-56.
[3] Zhao M, Zhang F, Chen Y, Dai H, Qu J, Dong C, Kang X, Liu Y, Yang L, Li Y, Zhou P, Pan CT, Zhang L, Liu P, Zhou H, Jiao X,Xiong Y, Tian R, Lu Y, Yu X, Li X. A 50% vs 30% dose of vertepor-fin (photodynamic therapy) for acute central serous chorioretinopathy: one-year results of a randomized clinical trial. JAMA Ophthalmol 2015; 133: 333-40.
[4] Menghini M, Lujan BJ, Zayit-Soudry S, Syed R, Porco TC, Bayabo K, Carroll J, Roorda A, Duncan JL. Correlation of outer nuclear layer thickness with cone density values in patients with retinitis pigmentosa and healthy subjects. Invest Ophthalmol Vis Sci 2015; 56: 372-81. [5] Yiu G, Chiu SJ, Petrou PA, Stinnett S, Sarin N,
Farsiu S, Chew EY, Wong WT, Toth CA. Re- lationship of central choroidal thickness with age-related macular degeneration status. Am J Ophthalmol 2015; 159: 617-26.
[6] Huang D, Swanson EA, Lin CP, Schuman JS, Stinson WG, Chang W, Hee MR, Flotte T, Gregory K, Puliafito CA, et al. Optical coher-ence tomography. Scicoher-ence 1991; 254: 1178-81.
[7] Chauhan DS, Marshall J. The interpretation of optical coherence tomography images of the retina. Invest Ophthalmol Vis Sci 1999; 40: 2332-42.
[8] Horio N, Kachi S, Hori K, Okamoto Y, Yamamoto E, Terasaki H, Miyake Y. Progressive change of optical coherence tomography scans in reti-nal degeneration slow mice. Arch Ophthalmol 2001; 119: 1329-32.
[9] Gloesmann M, Hermann B, Schubert C, Sattmann H, Ahnelt PK, Drexler W. Histologic correlation of pig retina radial stratification with ultrahigh-resolution optical coherence to-mography. Invest Ophthalmol Vis Sci 2003; 44: 1696-703.
[10] Anger EM, Unterhuber A, Hermann B, Sattmann H, Schubert C, Morgan JE, Cowey A, Ahnelt PK, Drexler W. Ultrahigh resolution optical coher-ence tomography of the monkey fovea. Iden- tification of retinal sublayers by correlation with semithin histology sections. Exp Eye Res 2004; 78: 1117-25.
[11] Costa RA, Skaf M, Melo LA Jr, Calucci D, Cardillo JA, Castro JC, Huang D, Wojtkowski M. Retinal assessment using optical coherence tomography. Prog Retin Eye Res 2006; 25: 325-53.
[12] Trichonas G, Kaiser PK. Optical coherence to-mography imaging of macular oedema. Br J Ophthalmol 2014; 98 Suppl 2: ii24-9.
non-in-vasive and effective model. Exp Eye Res 2006; 82: 628-36.
[14] Li T, Zhou XD, Chen Z, Zhou XT. Effects of Cyclopentolate on Form Deprivation Myopia in Guinea Pigs. Open J Ophthalmol 2015; 5: 10-18.
[15] Howlett MH, McFadden SA. Spectacle lens compensation in the pigmented guinea pig. Vision Res 2009; 49: 219-27.
[16] Zeng G, Bowrey HE, Fang J, Qi Y, McFadden SA. The development of eye shape and the origin of lower field myopia in the guinea pig eye. Vision Res 2013; 76: 77-88.
[17] Huang Y, Cideciyan AV, Papastergiou GI, Banin E, Semple-Rowland SL, Milam AH, Jacobson SG. Relation of optical coherence tomography to microanatomy in normal and rd chickens. Invest Ophthalmol Vis Sci 1998; 39: 2405-16. [18] Huang Y, Cideciyan AV, Papastergiou GI, Banin
E, Semple-Rowland SL, Milam AH, Jacobson SG. Optical coherence tomography (OCT) ab-normalities in rhodopsin mutant transgenic swine with retinal degeneration. Exp Eye Res 2000; 70: 247-51.
[19] Abbott CJ, Grunert U, Pianta MJ, McBrien NA. Retinal thinning in tree shrews with induced high myopia: optical coherence tomography and histological assessment. Vision Res 2011; 51: 376-85.
[20] Schuman JS, Pedut-Kloizman T, Pakter H, Wang N, Guedes V, Huang L, Pieroth L, Scott W, Hee MR, Fujimoto JG, Ishikawa H, Bilonick RA, Kagemann L, Wollstein G. Optical coherence tomography and histologic measurements of nerve fiber layer thickness in normal and glau-comatous monkey eyes. Invest Ophthalmol Vis Sci 2007; 48: 3645-54.
[21] Huang L, Schuman J, Wang N. [Comparison of nerve fiber layer thickness between optical co-herence tomography and histomorphometry in glaucomatous monkey eyes]. Zhonghua Yan Ke Za Zhi 2001; 37: 188-92.
[22] Abbott CJ, McBrien NA, Grunert U, Pianta MJ. Relationship of the optical coherence tomogra-phy signal to underlying retinal histology in the tree shrew (Tupaia belangeri). Invest Oph- thalmol Vis Sci 2009; 50: 414-23.
[23] Howlett MH, McFadden SA. Emmetropization and schematic eye models in developing pig-mented guinea pigs. Vision Res 2007; 47: 1178-90.
[24] Lu F, Zhou X, Jiang L, Fu Y, Lai X, Xie R, Qu J. Axial myopia induced by hyperopic defocus in guinea pigs: A detailed assessment on suscep-tibility and recovery. Exp Eye Res 2009; 89: 101-8.
[25] Wakitani Y, Sasoh M, Sugimoto M, Ito Y, Ido M, Uji Y. Macular thickness measurements in healthy subjects with different axial lengths using optical coherence tomography. Retina 2003; 23: 177-82.
[26] Ding X, Li J, Zeng J, Ma W, Liu R, Li T, Yu S, Tang S. Choroidal thickness in healthy Chinese sub-jects. Invest Ophthalmol Vis Sci 2011; 52: 9555-60.