Original Article
Whole-brain voxel-based analysis of diffusion tensor
imaging and its correlation with visual evoked
potential in patients with optic neuritis
Kai Wu1,2*, Xin Huang1,3*, Gang Tan2, Lei Ye1, An-Hua Wu2, Yu-Lin Zhong1, Nan Jiang1, Yi Shao1
1Department of Ophthalmology, The First Affiliated Hospital of Nanchang University, Nanchang 330006, Jiangxi,
People’s Republic of China; 2Department of Ophthalmology, The First Affiliated Hospital of University of South
China, Hengyang 421001, Hunan, People’s Republic of China; 3Department of Ophthalmology, The First People’s
Hospital of Jiujiang City, Jiujiang 332000, Jiangxi, People’s Republic of China. *Equal contributors.
Received May 19, 2016; Accepted August 9, 2016; Epub August 15, 2016; Published August 30, 2016
Abstract: This study was to investigate the fractional anisotropy (FA) and mean diffusion (MD) values of diffusion tensor imaging (DTI) in the whole-brain voxel-based analysis of optic neuritis (ON) patients and examine their rela-tionship with visual evoked potentials. A total of 12 (4 male, 8 female) patients with ON and 12 age-, sex-, and edu-cation-matched healthy controls (HCs) underwent magnetic resonance imaging (MRI). Imaging data were analyzed using two-sample t-tests to identify group differences in FA and MD values. Correlation analyses were performed to explore relationships between the FA and MD values of different brain regions and visual evoked potential (VEP) in subjects with ON. Compared with HCs, ON patients exhibited significantly decreased FA in the left cerebellum posterior lobe, left superior temporal gyrus, left extra-nuclear1, right middle frontal gyrus, and left middle frontal gyrus and increased FA in the right cerebellum_crus, right lentiform nucleus, bilateral anterior cingulum, left extra-nuclear2 and left precuneus. Meanwhile, increased MD was observed in the left inferior temporal gyrus, left supe-rior temporal gyrus, left hippocampus, left antesupe-rior cingulate/caudate, right supesupe-rior frontal gyrus, right precentral gyrus, and left inferior parietal lobule. VEP latency of the right eye in ON correlated positively with the FA values of the bilateral anterior cingulum (r = -0.583, P = 0.047) and negatively with the FA values of the left superior temporal gyrus (r = 0.653, P = 0.021). VEP amplitude of the right eye in ON subjects negatively correlated with the FA values of the left extra-nuclear2 (r = -0.592, P = 0.043). VEP latency of the left eye in ON correlated positively with the MD value of the left anterior cingulate/caudate (r = 0.707, P = 0.010) and negatively with MD values of the left inferior parietal lobule (r = 0.670, P = 0.017), while VEP amplitude of the left eye in ON showed negative correlation with MD values of the left inferior parietal lobule (r = -0.684, P = 0.014). These results suggest significant brain involvement in ON, which may reflect the underlying pathologic mechanism. Correlational results demonstrate that VEP in ON is closely associated with FA and MD in multiple brain regions.
Keywords: Optic neuritis, diffusion tensor imaging, fractional anisotropy, mean diffusion, visual evoked potential
Introduction
Optic neuritis (ON) is defined as inflammation of the optic nerve that leads to lesions of the optic nerve axons and retinal ganglion cell apoptosis. Patients with ON experience pain on eye movement in one eye and sudden vision loss; other symptoms include relative afferent pupillary defect (RAPD) and papillary edema. A previous survey reported an annual prevalence of 5 cases per 100,000 individuals in central Europe [1]. Optic neuritis is often the initial manifestation of multiple sclerosis (MS) [2].
The Optic Neuritis Treatment Trial (ONTT) des- cribed a patient with ON who showed significant improvements in color vision and contrast sen-sitivity within 6 months after corticosteroids treatment [3]. However, a subsequent study found no effect of corticosteroids on optic nerve atrophy [4].
demyelin-ation in axonal loss [5]. Notably, mfVEP ampli-tude reduction and latency delay have been observed after ON episodes [6]. In addition, VEP can be used to evaluate ON prognosis, and mfVEP amplitude improvement can contribute to functional recovery after acute ON [7]. Diffusion tensor imaging (DTI) is a widely used magnetic resonance imaging (MRI) modality that depicts water diffusion directionality as mean diffusivity (MD) and fractional anisotropy (FA) [8]. MD is a measure of the total amount of diffusion within a voxel and provides the overall magnitude of water diffusion. FA is a scalar value between zero and one and is cal-culated from the eigenvalues (λ1, λ2, λ3) of the diffusion tensor; it measures the overall direc-tionality of water diffusion and reflects the complexity of cytoskeleton architecture, which restricts the intra- and extracellular water movement [9]. The direction of water diffusion can indicate myelin sheath damage and tissue changes. For this reason, DTI has been applied to various diseases such as Alzheimer’s dis-ease [10], autism [11], and stroke [12].
DTI has been proposed as an assessment for ON because it can measure FA and MD within visual pathways. Previous studies showed reduced axial diffusivity in optic tracts and decreased FA in optic radiations of patients with ON [13]. Other evidence demonstrated that AD decreases during acute ON and corre-lates with axonal loss [14]. Some authors have reported significantly decreased FA in optic radiations in patients with ON and neuromyeli-tis optica (NMO) [15, 16]. While these results indicate that ON patients exhibit visual path-way, few studies have evaluated whole-brain changes in ON. Here, we performed whole-brain voxel-based analyses of DTI data from patients with ON and healthy controls (HCs) and examined how these findings correlated with VEP.
Materials and methods
Subjects
Twelve patients with ON (four male, eight fe- male) were recruited from the Ophthalmology Department of the First Affiliated Hospital of Nanchang University. The inclusion criteria for the acute ON group were: 1) acute vision loss with or without eye pain; 2) visual field
abnor-malities associated with nerve fiber damage; 3) patients with relative pupillary conduction block or abnormal VEP; 4) no clinical or labora-tory evidence of compression, ischemic, toxic, genetic, metabolic, or invasive optic neuropa-thy; 5) no acute vision loss due to retinal dis-ease, alternative eye disdis-ease, or nervous sys-tem disease; 6) no treatment with any drugs before resting-state functional MRI scanning; 7) no obvious abnormality in the brain paren-chyma on head MRI; 8) no history of congenital or acquired diseases such as psychiatric disor-ders, hypertension, diabetes mellitus, or coro-nary artery disease and no drug, alcohol, or tobacco addictions; 9) no organ transplanta-tion; and 10) moderate body shape and weight. Twelve age-, sex-, and education-matched HCs (four male, eight female) were also recruited for this study. All HCs met the following criteria: 1) no abnormalities in visual pathways or brain parenchyma on head MRI, 2) no ocular disease and corrected visual acuity >1.0, 3) normal ner-vous system with no headaches and no psychi-atric disease, and 4) no contraindications for MRI.
The study was authorized by the Ethics Committee of the first affiliated hospital of Nan Chang University. The study protocol and proce-dure were fully explained to each subject, and consent was obtained. The protocol followed the Declaration of Helsinki and conformed to the principles of medical ethics.
DTI acquisition
Each subject underwent spin echo single-shot echo planar imaging with the following param-eters: repetition time/echo time = 7200/104 ms, number of excitations = 2, matrix = 128 × 128, field of view = 230 × 230 mm, slice num-ber = 49, slice thickness = 2.5 mm, axial orien-tation, 64 nonlinear diffusion-weighting gradi-ent directions with b = 1000 s/mm2, and addi-tional image without diffusion weighting (b = 0 s/mm2).
Data processing
cor-rect eddy-current distortion; (3) binary brain masks of each participant from respective b0 images were obtained using the Brain Extract Tools (BET) functionality for brain extraction; (4) FMRIB’s diffusion tools (FDT), the tensor of each voxel within the brain mask was calculat-ed by a linear least-square fitting algorithm. (5) After diagonalization of the DTI, three eigenval-ues (λ1>λ2>λ3) were obtained. Diffusion-related parameter maps involving fractional anisotropy (FA) and mean diffusivity (MD) were derived from the following equations:
FA =
2 12 22 32 1 2 2 2 3 2 3 1 2
+ +
- + - +
-m m m
m m m m m m
^
h
^
h
^
h
MD = m1+ +m32 m3
FA reflects the extent of directionality in the water molecular motion; MD reflects the aver-age magnitude of its motion.
(6) Voxel-based analysis (VBA) of FA and MD was performed with Statistical Parametric Mapping (SPM8, http://www.fil.ion.ucl.ac.uk/ spm). VBA was implemented as follows: (7) b0 images were normalized to Montreal Neuro- logical Institute (MNI) space and resample to 2 × 2 × 2 mm voxels, then all subjects normalized b0 images were averaged. (8) The averaged b0 images were spatially smoothed by using an isotropic Gaussian filter with a full width at half maximum of 8 mm. Thus, a new template of b0 images was obtained in the MNI space. Subsequently, individual b0 images of both patients and healthy controls were registered to the new template, and corresponding trans-formation matrixes were also obtained. (9) Then, the FA and MD maps of each participant were normalized to MNI space using their respective transformation matrix and smoothed using an isotropic Gaussian filter with a full width at half maximum of 8 mm. (10) Finally, a paired t test was performed for smoothed FA and MD values obtained, respectively, between patients and healthy controls.
Statistical analysis
After the 2 sample t tests between patients and controls were performed, t value maps of FA and MD were obtained. The thresholds were set at P<0.01 (corrected for false discovery rate) with a minimum cluster size of 75 voxels.
Clinical data analysis
All patients underwent pattern-reversal VEP stimulation (RETLPORT electrophysiological instrument; Roland, Germany) in a dark room. Three active skin electrodes were placed on the scalp along the midline (over the inion) and on right and left lateral positions. VEP recording was performed at a 100-cm distance. All patients underwent monocular recording with the untested eye covered.
Using the stimulus mode with pattern-reversal VEP stimulation,the parameters were set as: stimulus frequency = 1.0 and 100 Hz, inter-phase = 500 ms, number of stimulations = 100, average screen brightness = 5 cd/m2, spatial frequency = 50 ms/s, and contrast ratio = 90%. Amplitude and latency VEP values were studied at different angular dimensions of the stimulus (120’, 60’, and 15’ for stimuli with small, medium, and large spatial frequencies, respectively). VEPs were characterized by a series of N75, P100, and N135 peaks, each characterized by a specific amplitude and latency.
Results
Demographics
Subject demographics are listed in Table 1. There were no obvious differences in weight (P = 0.741), age (P = 0.749), or height (P = 0.172) between the two groups. There was a signifi-cant difference between the ON and HC groups for best-corrected VA-Right (P<0.001).
FA and MD differences
Compared with the HC group, subjects with ON had significantly decreased FA in the left cere-bellum posterior lobe, left superior temporal gyrus, left extra-nuclear1, right middle frontal gyrus, and left middle frontal gyrus (Figure 1
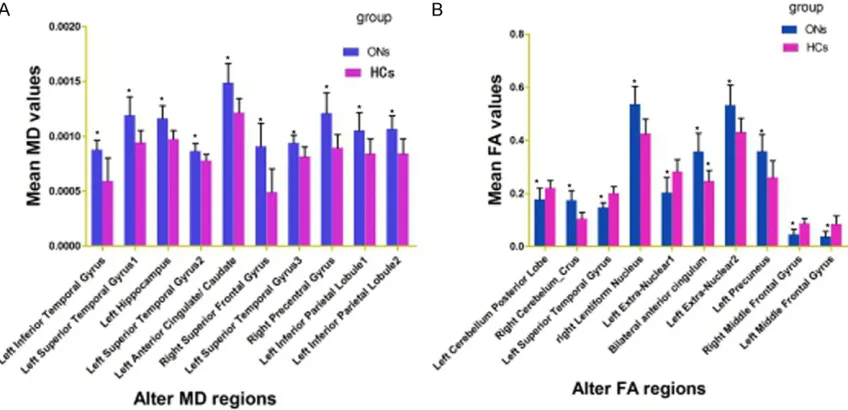
frontal gyrus, right precentral gyrus, left inferior parietal lobule (Figure 2 [red] and Table 3). The mean MD and FA values of both groups are shown in Figure 3A and 3B.
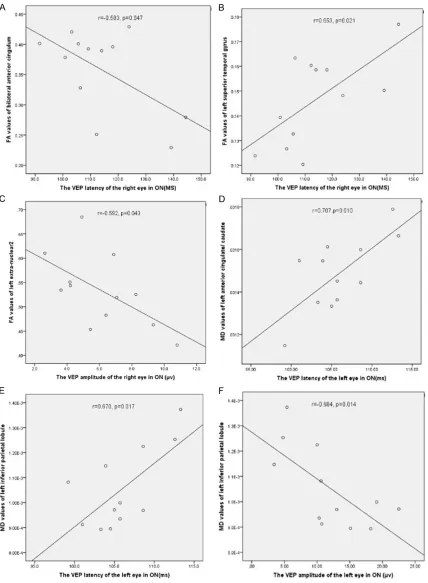
Correlation analysis
[image:4.612.92.529.86.256.2]The results of correlation analyses are graphi-cally represented in Figure 4. In the ON group,
Table 1. Participant characteristics
ON HC t p-Value
Sex (M/F) 4/8 4/8 N/A N/A
Handedness 12R 12R N/A N/A
Age (years) 44.08 ± 10.56 45.58 ± 11.37 -0.335 0.741
Weight (kg) 54.92 ± 7.48 59.00 ± 3.96 0.324 0.749
Height (cm) 159.25 ± 2.38 159.67 ± 6.67 -1.411 0.172
ON duration (days) 5.17 ± 1.64 N/A N/A N/A
Best-corrected VA - Right 0.24 ± 0.31 1.14 ± 0.24 -7.966 <0.001#
Best-corrected VA - Left 0.80 ± 0.51 1.12 ± 0.23 -2.003 0.058
Latency (ms) - Right of the VEP 114.03 ± 15.42 N/A N/A N/A
Amplitudes (μv)-Right of the VEP 6.14 ± 2.45 N/A N/A N/A
Latency (ms) - Left of the VEP 105.95 ± 4.23 N/A N/A N/A
Amplitudes (μv) - Left of the VEP 11.92 ± 5.95 N/A N/A N/A
Notes: Significant at #P<0.001, independent t-test. Abbreviations: HC, healthy control; N/A, not applicable; ON, optic neuritis;
VA, visual acuity; VEP, visual evoked potential.
[image:4.612.91.521.299.586.2]right-eye VEP latency in the ON group correlat-ed positively with bilateral anterior cingulum FA (r = -0.583, P = 0.047) and negatively with left superior temporal gyrus FA (r = 0.653, P =
0.021). The VEP amplitude of the right eye in ON exhibited a negative correlation with left extra-nuclear2 FA (r = -0.592, P = 0.043). Left-eye VEP latency in the ON group correlated positively with MD value of the left anterior cin-gulate/caudate MD (r = 0.707, P = 0.010) and negatively with left inferior parietal lobule MD (r = 0.670, P = 0.017), while left-eye VEP ampli-tude in ON showed a negative correlation with left inferior parietal lobule MD (r = -0.684, P =
0.014).
The details are presented in Figure 4.
Discussion
We previously reported that the spontaneous brain-activity of patients with optic neuritis by magnetic resonance images [17-19]. The goal of our study was to evaluate FA and MD values in the whole brains of subjects with ON using DTI. We found that ON patients had significant-ly decreased FA in the left cerebellum posterior lobe, left superior temporal gyrus, left extra-nuclear1, right middle frontal gyrus, and left middle frontal gyrus and increased FA in the
have implicated cerebellar in autism [22], schizophrenia [23], and ataxia [24]. Redondo and colleaguesreported Purkinje axonal spher-oids and Purkinje cell loss in the cerebellum of patients with MS [25]. In our previous studies have showed that significantly decreased amplitude of low-frequency fluctuation (ALFF) values in the posterior and anterior lobes of the right cerebellum and lower regional homogene-ity (ReHo) in the left cerebellum in the patients with ON [18, 19]. In support of these findings, we found that patients with ON had lower FA values in the left cerebellum posterior lobe. That is to say, ON may involve tissue abnormali-ties in cerebellum, which may reflect dysfunc-tion of cerebellum in ON.
[image:5.612.91.362.96.304.2]The default mode network (DMN) shows gre- ater activity when individuals are at rest [26] and plays an important role in maintaining cen-tral nervous system homeostasis [27]. DMN dysfunction has been described in multiple conditions such as schizophrenia [28], Alzh- eimer disease [29], and depression [30]. The DMN includes multiple brain regions including the medial prefrontal cortex, superior and infe-rior prefrontal cortices, anteinfe-rior cingulate cor-tex, and orbitofrontal cortex [31]. In our recent researches have showed that ON may involve dysfunction in the default-mode network using
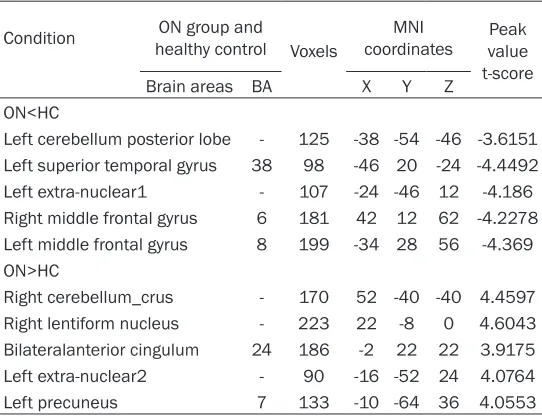
Table 2. Brain regions with significant between-group differ-ences in FA
Condition healthy controlON group and
Voxels
MNI
coordinates value Peak t-score
Brain areas BA X Y Z
ON<HC
Left cerebellum posterior lobe - 125 -38 -54 -46 -3.6151 Left superior temporal gyrus 38 98 -46 20 -24 -4.4492 Left extra-nuclear1 - 107 -24 -46 12 -4.186 Right middle frontal gyrus 6 181 42 12 62 -4.2278 Left middle frontal gyrus 8 199 -34 28 56 -4.369 ON>HC
Right cerebellum_crus - 170 52 -40 -40 4.4597 Right lentiform nucleus - 223 22 -8 0 4.6043 Bilateralanterior cingulum 24 186 -2 22 22 3.9175 Left extra-nuclear2 - 90 -16 -52 24 4.0764
Left precuneus 7 133 -10 -64 36 4.0553
Notes: The statistical thresholds were set at P<0.05 (corrected for false discovery rate) with a minimum cluster size of 75 voxels. Abbreviations: BA, Brodmann area; FA, fractional anisotropy; HCs, healthy controls; MNI, Montreal Neurological Institute; ON, optic neuritis.
right cerebellum_crus, right lenti-form nucleus, bilateral anterior cingulum, left extra-nuclear2 and left precuneus. Meanwhile, incre- ased MD was noted in the left inferior temporal gyrus, left supe-rior temporal gyrus, left hippo-campus, left anterior cingulate/ caudate, right superior frontal gyrus, right precentral gyrus, and left inferior parietal lobule. Fur- thermore, We observed that the changes of FA and MD values showed correlation with VEP out- comes.
ALFF and ReHo techniques [18, 19]. Interestingly, we found that patients with ON had lower FA in the left supe-rior temporal gyrus and bilat-eral middle frontal gyrus. We also observed increased MD in the left inferior temporal gyrus, left superior temporal gyrus, left hippocampus, left anterior cingulate/caudate, and right superior frontal gyrus. Collectively, the lower FA and higher MD in these brain regions indicate that ON may lead to DMN dam-age. Furthermore, we found that VEP latency of the right eye in ON correlated nega-tively with left superior tem-poral gyrus FA (r = 0.653, P = Figure 2. Overlay images demonstrating significantly greater MD in ON patients compared to HCs. The image shows the left inferior temporal gyrus, left superior temporal gyrus1, left hippocampus, left superior temporal gyrus2, left anterior cingulate/caudate, right superior frontal gyrus, left superior temporal gyrus3, right precentral gyrus, left in-ferior parietal lobule1, and left inin-ferior parietal lobule2. The red and blue areas denote regions with higher and lower MD, respectively. The statistical thresholds were set at P<0.01 (corrected for false discovery rate) with a minimum cluster size of 75 voxels. Abbreviations: HC, healthy control; MD, mean diffusion; ON, optic neuritis.
Table 3. Brain regions with significant between-group differences in MD
Condition healthy controlON group and
Voxels
MNI
coordinates Peak voxel t-score Brain
areas BA X Y Z
ON>HC
Left inferior temporal gyrus 20 366 -40 -16 -42 4.6858 Left superior temporal gyrus1 21 277 -44 8 -26 4.0646
Left hippocampus 81 -28 -14 -16 4.9201
Left superior temporal gyrus2 22 96 -54 -24 -2 4.0017 Left anterior cingulate/caudate 25,32 734 2 12 0 4.4833 Right superior frontal gyrus 10 476 4 72 8 5.3195 Left superior temporal gyrus3 22 205 -50 -46 12 4.13 Right precentral gyrus 6,43,13 267 52 -6 8 4.7676 Left inferior parietal lobule1 40 113 -50 -34 26 4.2027 Left inferior parietal lobule2 40 81 -38 -42 44 4.3365
[image:6.612.92.379.470.677.2]0.021). As we all know that, the prolonged VEP latency reflects the degree of optic nerve injury. We therefore conclude that decreased FA val-ues in the left superior temporal gyrus may relate to the severity of ON.
Extra-nuclear region contains major fibers link-ing the striatum and frontoparietal cortex, and structural alterations in this pathway [32]. Extra-nuclear dysfunction has been described in multiple conditions such as major depressive disorder [33], schizophrenia [34] and depres-sive [35]. In our study, we found that decreased FA values in the extra-nuclear1 (x = -24, y = -46, z = 12), That is, the ON may lead to the dyfunc-tion of extra-nuclear. However, we also observed that increased FA values in extra-nuclear2 (x = -16, y = -52, z = 24). The increased FA values in neighboring brain regions may reflect function-al reorganization to compensate for the dam-aged area. Furthermore, we found that VEP amplitude of the right eye in ON showed a nega-tive correlation with left extra-nuclear2 FA (r = -0.592, P = 0.043). The reduced VEP amplitude reflect the severity of nerve injury. We therefore come to conclusion that the increased FA val-ues in left extra-nuclear2 may reflect the sever-ity of ON.
Inferior parietal lobule (IPL) comprises the lat-eral bank of the intraparietal sulcus (lbIPS), angular gyrus (AG), and supramarginal gyrus (SMG) [36]. Meanwhile, the intraparietal sulcus
is associated with the processing of visual space information [37]. In our study, we found that decreased MD values in left inferior pari-etal lobule in ON. We come to conclusion that the ON may lead to the dysfunction of left infe-rior parietal lobule. Moreover, We also observed that VEP amplitude of the left eye in ON showed negative correlation with left inferior parietal lobule2 MD (r = -0.684, P = 0.014). The reduced VEP amplitude reflected the severity of nerve damage. Therefore, the increased MD values of the left inferior parietal lobule may related to the severity of ON.
Conclusion
In summary, we found that patients with ON had abnormal brain morphology changes, which showed correlations with the VEP results in ON. These findings provide important infor-mation for the understanding of the neural mechanisms underlying ON. However, there are some limitations to our study, such as the rela-tively small sample size, and the lack of com-parison between patients before and after treatment. In future studies we will use other techniques to explore changes in brain function in patients with ON.
Acknowledgements
[image:7.612.94.518.74.279.2]81100648, 81400372 and 81660158); Clini- cal Medicine Research Special-purpose Foun- dation of China (L2012052); Jiangxi Province Voyage Project (2014022); Natural Science Key Project of Jiangxi Province (20161ACB21017); Science and Technology Platform Construction Project of Jiangxi Province (2013116); Youth Science Foundation of Jiangxi Province (2015- 1BAB215016); Technology and Science Fou- ndation of Jiangxi Province (20151BBG70223); Jiangxi Province Education Department Sci- entific Research Foundation (GJJ14170); Hunan Province Education Department Outstanding Youth Science Foundation (15B210); Health Development Planning Commission Science Foundation of Jiangxi Province (20155154); Scholor Project of Ganjiang River (2015).
Disclosure of conflict of interest
None.
Address correspondence to: Yi Shao, Department of Ophthalmology, The First Affiliated Hospital of Nanchang University, No 17, Yongwaizheng Street, Donghu District, Nanchang 330006, Jiangxi, Peo- ple’s Republic of China. Tel: +086 791-88692520; Fax: +086 791-88692520; E-mail: freebee99@163. com
References
[1] Wilhelm H, Schabet M. The Diagnosis and Treatment of Optic Neuritis. Dtsch Arztebl Int 2015; 112: 616-625; quiz 626.
[2] Hojjati SM, Zarghami A, Hojjati SA, Baes M. Optic neuritis, the most common initial pre-senting manifestation of multiple sclerosis in northern Iran. Caspian J Intern Med 2015; 6: 151-155.
[3] Beck RW, Cleary PA, Anderson MM Jr, Keltner JL, Shults WT, Kaufman DI, Buckley EG, Corbett JJ, Kupersmith MJ, Miller NR, et al. A random-ized, controlled trial of corticosteroids in the treatment of acute optic neuritis. The Optic Neuritis Study Group. N Engl J Med 1992; 326: 581-588.
[4] Hickman SJ, Kapoor R, Jones SJ, Altmann DR, Plant GT, Miller DH. Corticosteroids do not pre-vent optic nerve atrophy following optic neuri-tis. J Neurol Neurosurg Psychiatry 2003; 74: 1139-1141.
[5] Klistorner A, Arvind H, Nguyen T, Garrick R, Paine M, Graham S, O’Day J, Grigg J, Billson F, Yiannikas C. Axonal loss and myelin in early ON loss in postacute optic neuritis. Ann Neurol 2008; 64: 325-331.
[6] Alshowaeir D, Yannikas C, Garrick R, Van Der Walt A, Graham SL, Fraser C, Klistorner A. Multifocal VEP assessment of optic neuritis evolution. Clin Neurophysiol 2015; 126: 1617-1623.
[7] Klistorner A, Arvind H, Garrick R, Graham SL, Paine M, Yiannikas C. Interrelationship of opti-cal coherence tomography and multifoopti-cal visu-al-evoked potentials after optic neuritis. Invest Ophthalmol Vis Sci 2010; 51: 2770-2777. [8] Beaulieu C. The basis of anisotropic water
dif-fusion in the nervous system - a technical re-view. NMR Biomed 2002; 15: 435-455. [9] Pierpaoli C, Basser PJ. Toward a quantitative
assessment of diffusion anisotropy. Magn Reson Med 1996; 36: 893-906.
[10] Hořínek D, Štěpán-Buksakowska I, Szabó N, Erickson BJ, Tóth E, Šulc V, Beneš V, Vrána J, Hort J, Nimsky C, Mohapl M, Roček M, Vécsei L, Kincses ZT. Difference in white matter micro-structure in differential diagnosis of normal pressure hydrocephalus and Alzheimer’s dis-ease. Clin Neurol Neurosurg 2016; 140: 52-59.
[11] Jou RJ, Jackowski AP, Papademetris X, Rajeevan N, Staib LH, Volkmar FR. Diffusion tensor imaging in autism spectrum disorders: preliminary evidence of abnormal neural con-nectivity. Aust N Z J Psychiatry 2011; 45: 153-162.
[12] Chaudhary N, Pandey AS, Gemmete JJ, Hua Y, Huang Y, Gu Y, Xi G. Diffusion tensor imaging in hemorrhagic stroke. Exp Neurol 2015; 272: 88-96.
[13] Raz N, Bick AS, Ben-Hur T, Levin N. Focal demy-elinative damage and neighboring white mat-ter integrity: an optic neuritis study. Mult Scler 2015; 21: 562-571.
[14] van der Walt A, Kolbe SC, Wang YE, Klistorner A, Shuey N, Ahmadi G, Paine M, Marriott M, Mitchell P, Egan GF, Butzkueven H, Kilpatrick TJ. Optic nerve diffusion tensor imaging after acute optic neuritis predicts axonal and visual outcomes. PLoS One 2013; 8: e83825. [15] Kolbe S, Bajraszewski C, Chapman C, Nguyen
[16] Kimura MC, Doring TM, Rueda FC, Tukamoto G, Gasparetto E. In vivo assessment of white matter damage in neuromyelitis optica: a diffu-sion tensor and diffudiffu-sion kurtosis MR imaging study. J Neurol Sci 2014; 345: 172-175. [17] Huang X, Zhang Q, Hu PH, Zhong YL, Zhang Y,
Wei R, Xu TT, Shao Y; Oculopathy fMRI Study Group. White and Gray Matter Volume Changes and Correlation with Visual Evoked Potential in Patients with Optic Neuritis: A Voxel-Based Morphometry Study. Med Sci Monit 2016; 22: 1115-23.
[18] Huang X, Cai FQ, Hu PH, Zhong YL, Zhang Y, Wei R, Pei CG, Zhou FQ, Shao Y. Disturbed spontaneous brain-activity pattern in patients with optic neuritis using amplitude of low-fre-quency fluctuation: a functional magnetic reso -nance imaging study. Neuropsychiatr Dis Treat 2015; 11: 3075-83.
[19] Shao Y, Cai FQ, Zhong YL, Huang X, Zhang Y, Hu PH, Pei CG, Zhou FQ, Zeng XJ. Altered intrin-sic regional spontaneous brain activity in pa-tients with optic neuritis: a resting-state func-tional magnetic resonance imaging study. Neuropsychiatr Dis Treat 2015; 11: 3065-73. [20] Stoodley CJ. The cerebellum and cognition:
evidence from functional imaging studies. Cerebellum 2012; 11; 352-365.
[21] Doron KW, Funk CM, Glickstein M. Fronto-cerebellar circuits and eye movement control: a diffusion imaging tractography study of hu-man cortico-pontine projections. Brain Res 2010; 1307: 63-71.
[22] Mosconi MW, Wang Z, Schmitt LM, Tsai P, Sweeney JA. The role of cerebellar circuitry al-terations in the pathophysiology of autism spectrum disorders. Front Neurosci 2015; 9: 296.
[23] Bernard JA, Mittal VA. Dysfunctional Activation of the Cerebellum in Schizophrenia: A Fun- ctional Neuroimaging Meta-Analysis. Clin Psychol Sci 2015; 3: 545-566.
[24] Kim WS, Jung SH, Oh MK, Min YS, Lim JY, Paik NJ. Effect of repetitive transcranial magnetic stimulation over the cerebellum on patients with ataxia after posterior circulation stroke: A pilot study. J Rehabil Med 2014; 46: 418-423. [25] Redondo J, Kemp K, Hares K, Rice C, Scolding
N, Wilkins A. Purkinje Cell Pathology and Loss in Multiple Sclerosis Cerebellum. Brain Pathol 2015; 25: 692-700.
[26] Raichle ME, MacLeod AM, Snyder AZ, Powers WJ, Gusnard DA, Shulman GL. A default mode of brain function. Proc Natl Acad Sci U S A 2001; 98: 676-682.
[27] Buckner RL, Andrews-Hanna JR, Schacter DL. The brain’s default network: anatomy, func-tion, and relevance to disease. Ann N Y Acad Sci 2008; 1124: 1-38.
[28] Pankow A, Deserno L, Walter M, Fydrich T, Bermpohl F, Schlagenhauf F, Heinz A. Reduced default mode network connectivity in schizo-phrenia patients. Schizophr Res 2015; 165: 90-93.
[29] Chang YT, Huang CW, Chang YH, Chen NC, Lin KJ, Yan TC, Chang WN, Chen SF, Lui CC, Lin PH, Chang CC. Amyloid burden in the hippocampus and default mode network: relationships with gray matter volume and cognitive performance in mild stage Alzheimer disease. Medicine (Baltimore) 2015; 94: e763.
[30] Shi H, Wang X, Yi J, Zhu X, Zhang X, Yang J, Yao S. Default mode network alterations during im-plicit emotional faces processing in first-epi -sode, treatment-naive major depression pa-tients. Front Psychol 2015; 6: 1198.
[31] Wu J, Dong D, Jackson T, Wang Y, Huang J, Chen H. The Neural Correlates of Optimistic and Depressive Tendencies of Self-Evaluations and Resting-State Default Mode Network. Front Hum Neurosci 2015; 9: 618.
[32] Su L, Cai Y, Xu Y, Dutt A, Shi S, Bramon E. Cerebral metabolism in major depressive dis-order: a voxel-based meta-analysis of positron emission tomography studies. BMC Psychiatry 2014; 14: 321.
[33] Lei W, Li N, Deng W, Li M, Huang C, Ma X, Wang Q, Guo W, Li Y, Jiang L, Zhou Y, Hu X, McAlonan GM, Li T. White matter alterations in first epi -sode treatment-naive patients with deficit schizophrenia: a combined VBM and DTI study. Sci Rep 2015; 5: 12994.
[34] Peng H, Ning Y, Zhang Y, Yang H, Zhang L, He Z, Li Z, Wang L, Lu S, Zhou J, Zhang Z, Li L. White-matter density abnormalities in depressive pa-tients with and without childhood neglect: a voxel-based morphometry (VBM) analysis. Neurosci Lett 2013; 550: 23-28.
[35] Kring AM, Barch DM. The motivation and pleasure dimension of negative symptoms: neural substrates and behavioral outputs. Eur Neuropsychopharmacol 2014; 24: 725-736. [36] Zhang S, Li CS. Functional clustering of the
hu-man inferior parietal lobule by whole-brain connectivity mapping of resting-state function-al magnetic resonance imaging signfunction-als. Brain Connect 2014; 4: 53-69.