warwick.ac.uk/lib-publications
Original citation:Bernhardt, Dan and Rastad, Mahdi. (2016) Collusion under risk aversion and fixed costs. The Journal of Industrial Economics, 64 (4). pp. 808-834.
Permanent WRAP URL:
http://wrap.warwick.ac.uk/76987
Copyright and reuse:
The Warwick Research Archive Portal (WRAP) makes this work by researchers of the University of Warwick available open access under the following conditions. Copyright © and all moral rights to the version of the paper presented here belong to the individual author(s) and/or other copyright owners. To the extent reasonable and practicable the material made available in WRAP has been checked for eligibility before being made available.
Copies of full items can be used for personal research or study, educational, or not-for profit purposes without prior permission or charge. Provided that the authors, title and full bibliographic details are credited, a hyperlink and/or URL is given for the original metadata page and the content is not changed in any way.
Publisher’s statement:
"This is the peer reviewed version of the following article: Bernhardt, Dan and Rastad, Mahdi. (2016) Collusion under risk aversion and fixed costs. The Journal of Industrial Economics, 64 (4). pp. 808-834. which has been published in final form at
http://doi.org/10.1111/joie.12111 . This article may be used for non-commercial purposes in accordance with Wiley Terms and Conditions for Self-Archiving."
A note on versions:
The version presented here may differ from the published version or, version of record, if you wish to cite this item you are advised to consult the publisher’s version. Please see the ‘permanent WRAP URL’ above for details on accessing the published version and note that access may require a subscription.
COLLUSION UNDER RISK AVERSION AND FIXED COSTS
∗Dan Bernhardt
†Mahdi Rastad
‡We analyze collusion under demand uncertainty by risk-averse cartels that care about the utility derived from profits. With sufficient risk aversion and non-trivial fixed operating costs, it becomes difficult for cartels to collusively restrict output both when demand is low and marginal dollars are highly-valued, and when demand is high and potential defection profits are high: output relative to monopoly levels becomes a U-shaped function of demand. Greater risk aversion or higher fixed operating costs make collusion more difficult to support in recessions, but easier to support in booms.
I. INTRODUCTION
IN THEIR PIONEERING ANALYSIS OF COLLUSION under demand uncertainty,
Rotem-berg and Saloner [1986] show that when demand is independently and identically distributed
over time, and firms observe demand before taking actions, collusion is harder to support
when demand is higher. The intuition is compelling: the period incentive to cheat on the
car-tel rises with demand, but expected continuation payoffs are unchanged. While this setting
is stark, Kandori [1991] shows that the essence of the Rotemberg and Saloner result extends
to serially-correlated demand—the key is that the period incentive to cheat on the cartel
is more sensitive to current market conditions than are continuation payoffs. Haltiwanger
and Harrington [1991] establish related results for deterministic cyclical demand—collusion
is hardest to support at the peak of a cycle.1 Bagwell and Staiger [1997] generalize these
results melding a Markov demand growth process on top of the i.i.d. transitory shocks.
∗We thank Odilon Camara ,Volker Nocke (the editor), two anonymous referees and seminar participants
at California Polytechnic State University for helpful comments.
†Department of Economics, University of Illinois, David Kinley Hall, Urbana, IL 61820, and University
of Warwick. E-mail: [email protected]
‡Department of Finance, Orfalea College of Business, California Polytechnic State University, San Luis
In contrast to this robust theoretical prediction, we have Scherer [1980]’s summary of
his empirical work: ‘Yet it is precisely when business conditions turn sour that price
cut-ting runs most rampant among oligopolistic firms with high fixed costs,’ Staiger and Wolak
[1992]’s assertion that ‘the conventional empirical wisdom [is] that tacit collusion tends to
break down when business conditions turn sour,’ and Aiginger et al. [1998]’s survey of 113
experts, which found that most believed that price wars are more likely when demand is low.
Empirical studies providing support for the premise that collusion is harder to support in
downturns include Porter [1985], Scherer and Ross [1990], Suslow [2005], and Ellison [1994].
This research primarily focuses on prices and price-cost margins; but with output
compe-tition, procyclical price-cost margins remain consistent with collusion being more difficult
to support when demand is high, making conclusions harder to draw. Still, even among
commodity cartels, there is evidence that collusion is difficult to support in downturns. For
example, Scherer [1980] provides examples of cartels in the rayon, steel and cement
indus-tries that experienced breakups in recessions. So, too, among country cartels—cartels where
production decisions are made by leaders who care about the utility citizens derive from the
profits earned—the two largest production wars in OPEC occurred in 1986 and 1997 when
demand was extremely low. In contrast to this literature, Rotemberg and Saloner [1986],
Domowitz et al. [1987], Chevalier and Scharfstein [1996], Borenstein and Shepard [1996],
Rosenbaum and Sukharomana [2001], and Mariuzzo and Walsh [2013] provide empirical
evidence consistent with cartels being likely to breakdown in booms.
One approach to trying to reconcile these empirical findings is to argue that, as is likely,
different factors are relevant in different markets. Thus, for example, Rotemberg and
Sa-loner’s mechanism may underlie why cartels sometimes breakdown in booms, but a
com-pletely different mechanism may underlie why cartels sometimes breakdown when demand
is low. For example, in the imperfect monitoring literature (e.g., Green and Porter [1984])
firms might see equilibrium prices, but not demand realizations or outputs, and low prices
trigger price wars because cartel members cannot distinguish whether they are due to low
observabil-ity of demand, the literature delivers a limited link between output and demand. Moreover,
among commodity cartels like OPEC, outputs are fairly well observed. Another approach is
to introduce capacity constraints for firms, which limit defection gains when demand is high,
reducing incentives to cheat, but also weaken the ability to punish in high demand states.
Staiger and Wolak [1992] add a capacity-building stage to the Rotemberg and Saloner model
and predict (seemingly contrary to the empirical evidence), that price wars are more likely
inintermediate demand states than in either low demand states or high demand states (see
Fabra [2006] for a related result in the Haltiwanger and Harrington [1991] cyclical demand
model, and Nocke [1999] for how excess capacity in bad times can bring instability to a cartel).
We take a different approach. We return to the insights implicit in the empirical
anal-ysis of Scherer [1980], and explore collusion by risk averse (CRRA or DARA preferences)
cartel members that face positive fixed operating costs. Because most commodity cartels
choose output levels rather than prices, we model output competition when defections from
cartel quotas are deterred by threats to revert to static Nash equilibrium output levels.2
We otherwise focus on the classical i.i.d. demand, constant marginal cost setting studied by
Rotemberg and Saloner. We measure the extent of collusion by the ratio of output relative
to monopoly levels that can be supported in different demand states—a higher ratio
indi-cates that collusion is more difficult to support. We show that our model can reconcile the
collective set of empirical findings: collusively restricting output toward monopoly levels can
be more difficult both when demand is unusually low andwhen it is unusually high.
Risk averse cartel members value a marginal dollar of profit by more when profits are
lower. This might lead one to conjecture that with power utility, cartels could find collusion
more difficult to support in low demand states. This conjecture is false: to overturn the
Rotemberg-Saloner result that higher demand always makes it more difficult for firms to
collusively restrain output, cartel members must not only be risk averse, but fixed operating
costs of production must be positive. Absent fixed costs, the extent of risk aversion just
scales the period incentive to cheat on the cartel, preserving monotonicity of the incentive
cartels that care about the utility citizens derive from the profits) amplify the asymmetric
valuation of a dollar in good times and bad, inducing cartel members with CRRA preferences
to behave as if they have decreasing absolute risk averse (DARA) preferences. This sharply
raises the incentive to cheat on the cartel when demand is especially low.
More provocatively, we establish that collusion is easiest to support when demand is
in-termediate, neither too low, nor too high. That is, risk aversion together with fixed operating
costs give rise to the opposite predictions of those in Staiger and Wolak [1992]. When demand
is especially low, the very high marginal valuation of an additional dollar of profit induced
by the fixed operating costs makes the incentive to cheat on the cartel very high; and when
demand is very high, decreasing risk aversion implies that the classical effect dominates—as
demand increases, there are more and more dollars to be gained from cheating on the cartel,
and with DARA preferences, the marginal utility of those dollars declines by less and less.
We further establish that although the incentive to cheat on the cartel is a U-shaped function
of the level of demand, the incentive rises more sharply in low demand states (as demand
gets worse) than in higher demand states (as demand gets better).
We then show that greater fixed operating costs or risk aversion make itharderto support
collusion when demand is low, buteasierto support collusion when demand is high. Greater
fixed costs or risk aversion raise the net continuation payoff from collusion by enhancing the
threatened Nash reversion punishment for cheating on the cartel. However, greater fixed
costs or risk aversion also raise the potential period utility gains from cheating on the
car-tel. The impact of higher operating costs on period incentives dominates when demand is
especially low, making collusion more difficult to support; but the higher net continuation
payoffs dominate when demand is especially high, making collusion easier to support.
Our central premise that cartel members are risk averse captures two types of scenarios.
First, risk-averse preferences may better describe the objective function of a firm. For
ex-ample, a firm may be run by a risk-averse manager, or a financially-constrained firm with
high debt obligations may value a marginal dollar in bad times by more because it may
not care about profits per se, but rather about the utility that (possibly a subset of) their
citizens derive from those profits. In addition to OPEC, country cartels have existed in many
manufacturing and commodity cartels (natural resources such as minerals, chemicals, raw
materials, metals, etc.; see Suslow [2005] for a list).
The literature has long argued that DARA utility functions better capture a firm’s
be-havior. Sandmo [1971], and Appelbaum and Katz [1986] are the first to study firm behavior
under uncertainty with risk averse preferences. Greenwald and Stiglitz [1990] propose
micro-foundations for DARA preferences. Spagnolo [1999] argues that non-linearities in the
cor-porate tax schedule, convexity of external financing costs, and managers’ capped monetary
incentives together with their fears of losing jobs or reputations give rise to strictly concave
firm objective functions. Nocke and Thanassoulis [2014] show how bad demand realizations
can cause a risk-neutral credit-constrained firm to under-invest in assets/collateral,
endoge-nously becoming risk-averse. Asplund [2002] highlights the impact of costly financial distress,
liquidity constraints, and non-diversified owners. Using the intuition that ‘firms give
rela-tively greater weight to realizations with low profits,’ Aspland looks at how the degree of risk
aversion affects competition intensity. He shows that with DARA preferences, ‘fixed costs
influence best-response strategies by increasing firms risk aversion.’ Spagnolo [1999, 2005]
shows that it is easier for firms to support collusive outcomes when they are risk averse.4
We next present the model and analysis. A conclusion follows. Proofs are in an appendix.
II. THE MODEL
Our framework features an infinitely repeated output game played by two agents 1 and 2 (e.g.,
risk-averse firms, or country members of OPEC) that sell a homogeneous good in a market
where demand evolves stochastically according to an i.i.d. process. Datetdemand is given by
Pt =θt−Qt, (1)
where θt is identically and independently distributed, with associated distribution function
loss of generality, we normalize the constant marginal costs of production to zero. The agents
also incur fixed operating costs each period of f ≥ 0, where f ≤ a2
9. In the appendix, we
extend the analysis toN >2 agents, and to more general demand and preference structures,
providing conditions under which our qualitative findings extend.5
In the classical Rotemberg and Saloner [1986] framework, the agents are risk-neutral firms
whose period payoffs equal their period profits, Ui(πi
t)) =πti. Thus, the marginal value that
a firm derives from a dollar of profit does not vary with the level of profit, and fixed operating
costs are irrelevant for a firm’s decision-making (assuming that exit is not a strategic
consid-eration). We depart from this setting to investigate collusion by risk-averse agents that face
positive fixed operating costs. Agentiderives period utility from profit πti ofUi(πit) = (πit)α,
where 0< α≤1. For simplicity, we assume that each period, a cartel member consumes its
period profits, i.e., there is no saving and borrowing. As a result, a cartel member values an
extra dollar of profit by more when profits are lower. Moreover, fixed operating costs enter
decision-making non-trivially, as they especially magnify the marginal value of an additional
dollar in bad times. Firms use a common discount factorβ ∈(0,1) to discount future payoffs.
Our assumption of output competition captures our real world motivating example of a
commodity cartel, in which cartel members choose outputs rather than prices. We focus on
the maximal period collusion profits that the cartel can support by threats to revert to the
non-cooperative static Nash equilibrium outputs forever if a cartel member ever deviates from
their collusive agreement. This assumption simplifies analysis. More generally, we establish
that our qualitative findings extend (in symmetric settings) as long as the punishment path is
not so harsh that monopoly profits are always sustainable. This means that we must preclude
punishments that would result in consumption levels that are ‘too close’ to the effective
sub-sistence level off. With output competition and linear demand, the assumption thatf < a92
ensures that the profits from Nash outputs always cover the period fixed operating costs.
After observing period demand, cartel members simultaneously choose outputs. Define
qC(θ) to be the collusive firm output supported along the equilibrium path when the demand
future, an agent that cheats on the cartel agreement will produce theqF(θ) that maximizes
period profit, and hence period utility, solving
max q(θ)
(θ−qC(θ)−q(θ))q(θ)−f ⇒qF(θ) = (θ−qC(θ))/2.
Let πC(θ) = (θ −2qC(θ))qC(θ)− f and πF(θ) = (θ −qC(θ))2/4 −f denote the
respec-tive period profits from cooperating and cheating on the cartel, and let qP(θ) = θ/3 be
the Nash output and πP(θ) = θ2/9−f be the associated Nash period profit. Finally, let
UC ≡ E[U(πC(θ))] be the expected period utility from cooperation along the equilibrium
path, and letUP ≡E[U(πP(θ))] be the expected period utility along the punishment path.
Then, for each given demand shock θ, incentive compatibility requires
(2) U(πC(θt)) +
β 1−β
UC ≥U(πF(θt)) +
β 1−β
UP.
Equation (2) can be re-arranged in terms of the ‘incentive to cheat’:
(3) U(πF(θt))−U(πC(θt))≤
β 1−β
(UC −UP)≡v.
That is, for a cartel production schedule to be incentive compatible, the net period
util-ity payoff from cheating when demand is θ, U(πF(θt))−U(πC(θt)), cannot exceed the net
expected payoff from future cooperation rather than punishment, v.
II.(i) Cartel’s Problem.
The cartel’s objective is to find the incentive compatible production schedule that maximizes
their joint utility on the equilibrium path,P∞
t=1β
t−1E[U(πC
i (θt)) +U(πCj (θt))]. With power
utility, we can write the cartel’s problem as
max q(θ) 2
Z b
a
(q(θ)(θ−2q(θ))−f)α dF(θ) (4)
s.t. ((θ−q(θ)) 2
4 −f)
α−((θ−2q(θ))q(θ)−f)α ≤
β 1−β
We measure a cartel’s ability to support collusion in demand stateθby the ratioqC(θ)/qm(θ)≥
1, i.e., by the ratio of output relative to monopoly levels. One can also motivate this measure
by the observation that the square of this ratio equals the ratio of consumer surplus under
the cartel vs. under monopoly. A higher ratio indicates that collusion is more difficult to
support. Most empirical researchers measure collusion using price-cost margins. If price-cost
margins fall with θ, then qC(θ)/qm(θ) also rises with θ. However, with output competition,
qC(θ)/qm(θ) can rise with θ, indicating a reduced ability of the cartel to support collusion
in higher demand states, even though price-cost margins rise uniformly with θ. Phrased
differently, with output competition, the procyclical price-cost margins found empirically do
notimply that collusion is easier to support in high demand states.
For the special case of linear utility, U(πi(θt)) = πi(θt), the cartel’s objective reduces to
the output-competition variant of Rotemberg and Saloner [1986]. In that setting, it
imme-diately follows that the incentive to cheat increases in θ, as with i.i.d. demand, expected
continuation payoffs do not vary withθ, but the current payoffs from cheating on the cartel
rise when the stakes are higher. As a result, qC(θ)/qm(θ) is constant when demand is low
enough that monopoly profits can be supported, and it is strictly increasing once demand is
high enough that threats to deviate to Nash outputs cannot support monopoly profits.
One might conjecture that risk-aversion alone, i.e., α < 1, would be enough to reverse
the result that increases in demand make it more difficult for the cartel to collusively restrict
output toward monopoly levels, i.e., to reverse the result thatqC(θ)/qm(θ) is non-decreasing
in θ. That is, one might conjecture that since the marginal utility derived from another
dollar of profit is higher when profits are lower, collusion might be more difficult to support
when demand is low and cartel members are sufficiently risk averse. This conjecture is false.
The following proposition establishes necessary conditions for it to be harder to support
collusion when demand is low than when it is high: not only must cartel members be risk
averse, α <1, but they must also have positive fixed costs of operation, f > 0.
monopoly levels rises with the level of demand, i.e., qC(θ)/qm(θ) is non-decreasing in θ.
Thus, both risk-aversionand positive fixed operating costs are necessary for
overproduc-tion not to rise with θ. Intuition for why more than risk aversion is required can be gleaned
from looking at those demand states θ where the net value of future cooperation v is high
enough that the IC constraint is slack. For suchθ, the cartel’s optimization problem
simpli-fies to a pointwise maximization of its objective. The associated first-order condition is
(q(θ)(θ−2q(θ))−f)α−1(θ−4q(θ)) = 0,
with solution qC(θ) = θ/4. The two agents jointly produce the monopoly output, θ/2, and
each earns half of the monopoly profits net of operating costs, θ2/8−f; and the associated
fink output is 3θ/8, which delivers profits of πF(θ) = 9θ2/64−f. To see how incentives to
cheat on the cartel hinge on the level of demand, the extent of risk aversion and the fixed
operating costs, define the (period) incentive to cheat on monopoly output as
h(θ;α, f) = U(πF(θ))−U(πC(θ)) =
9θ2 64 −f
α −
θ2 8 −f
α
. (5)
When there are no fixed costs, h(θ, α, f = 0) simplifies to
h(θ;α, f = 0) =
9θ2 64
α −
θ2 8
α
=
θ2 64
α
(9α−8α).
Thus, without fixed costs, the extent of risk aversion scales the incentive to cheat, preserving
monotonicity in θ. A similar result holds when monopoly output cannot be supported.
We now show that for the incentive to cheat on the cartel not to rise monotonically with
the level of demand, the impact of risk aversion must be higher in low demand states than
high, i.e., the preferences induced by the fixed operating costs must exhibit decreasing relative
risk aversion. With positive fixed operating costs, preferences effectively take a subsistence
utility form, and the associated Arrow-Pratt measure of relative risk-aversion, RRA(W) =
−W U00(W)/U0(W) = (1−α)W−fW , decreases inW if and only ifα <1andf > 0. Then, when
demand is low, the higher marginal valuation of an additional dollar of profit induced by the
and agents become more desperate for another marginal dollar of profit. In contrast, when
demand is much higher, the decreasing risk aversion implies that risk aversion matters less,
with the result that the standard effect dominates—as demand rises, there are more dollars to
be gained from cheating on the cartel. Putting these two observations together suggests that
the incentive to cheat on the cartel will be a U-shaped function of θ. We now formalize this
intuition and begin to address the question of exactly where the separation between good and
bad times occurs. The theorem shows that to deliver the U-shaped relationship, agents must
have intermediate levels of risk aversion: for the incentive to cheat on the cartel not to rise
monotonically withθ, for a given level of fixed costs, agents must be sufficiently risk averse;
and for the incentive not to fall monotonically with θ, they must not be too risk averse.
Proposition 2. There exist critical levels of risk aversion, α(f) and ¯α(f), indexed by the
fixed costs f, such that if and only if cartel members have intermediate levels of risk
aver-sion, α(f) < α < α¯(f) < 1, then h is a U-shaped function of θ, achieving a minimum at
ˆ
θ(α, f) ∈ (a, b). That is, h0(θ) <0 for θ < θˆ(α, f), and h0(θ) > 0 for θ > θˆ(α, f). Further,
α(f), α¯(f) and ˆθ(α, f) rise with the fixed costf, and ˆθ(α, f) increases in risk aversion (−α) .
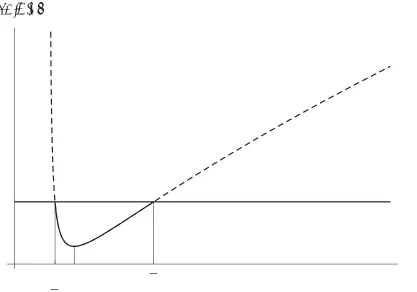
The proof shows that, as in Figure 1, there is a unique intermediate demand level ˆθ that
minimizes the incentive to cheat. As demand falls below ˆθ, the incentive to cheat rises due to
the high marginal valuation of another dollar of profit; and as demand rises above ˆθ, so too
does the incentive to cheat due to the greater profit that can be gained. The comparative
statics reveal that when agents are more risk averse or fixed costs are greater, demand does
not have to be as bad for the incentive to cheat to begin to rise as demand drops lower.
[Place Figure 1 about here.]
Monopoly outputs are supportable when the period benefit from cheating, h, is less than
the expected net value of future cooperation, v, which is independent of θ. When h is a
U-shaped function of θ, it directly follows that monopoly outputs can only be sustained for
support monopoly outputs in every state, nor so impatient that they can support monopoly
outputs in no state (see Figure 1). Corollary 1 formalizes the necessary conditions.
Corollary 1. There exist β, β¯ with 0 < β < β <¯ 1 such that if and only if β ∈ [β,β¯]
the cartel can support monopoly profits only if demand is neither too low nor too high: If
and only if β ∈[β,β¯], there existθ(β), θ¯(β) with a < θ(β) <θ¯(β)< b such that monopoly
profits can be supported if and only if θ ∈[θ(β),θ¯(β)].
We have identified two forces that can drive the cartel away from supporting monopoly
output levels: temptations rooting from the larger potential profit gain when times are
good, and desperateness for an extra dollar of profits when times are bad. But, which force
is stronger? In Proposition 3, we show that the ability to support collusion drops off more
quickly when demand falls below ˆθ than when it rises past ˆθ.
Proposition 3. The incentive to cheat on monopoly output rises more quickly as low
de-mand states become worse than as high dede-mand states improve: h(ˆθ−δ)> h(ˆθ+δ) for all
δ >0.
The intuition for Proposition 3 devolves from the increasing desperation to obtain
an-other dollar of profit when its marginal valuation is high that is implicit in Scherer [1980]’s
summary that ‘Yet it is precisely when business conditions turn sour that price cutting runs
most rampant among oligopolistic firms with high fixed costs.’ Proposition 3 goes beyond
Proposition 2. Proposition 2 showed that the incentive to cheat on monopoly output rises
not only when demand is larger, but also when market conditions turn sour. Proposition
3 documents an asymmetry in the incentive to cheat: monopoly can be supported in a
narrower range of bad states than good ones. Put differently, ˆθ is closer to θ than to ¯θ.
We now characterize output levels following demand realizations—both high and low—
that are sufficiently extreme that the cartel cannot support monopoly outputs. To prevent
agents from cheating, cartel output must be increased to a level that makes agents
indif-ferent between cheating and cooperation. More formally, at each θ ∈ [a, θ]S
compatible quotas, q(θ), solve
((θ−q(θ)) 2
4 −f)
α−((θ−2q(θ))q(θ)−f)α =
β 1−β
(UC−UP)≡v. (6)
Define the normalized production level z ≡q(θ)/θ: z is an index for overproduction relative
to monopoly output, as 4z = q(θ)/(θ/4) = q(θ)/qm(θ). When monopoly output can be
supported, there is no overproduction, so that z = 1/4; and when the cartel breaks down
and agents revert to Nash outputs, then z = 1/3. That is, outside the monopoly support
region, we have z ∈(1/4,1/3), and profits decrease in z.
We rewrite the left-hand side of equation (6) in terms of z and define H(z, θ) to be this
period incentive to cheat:
H(z, θ) =
θ2(1−z) 2
4 −f
α
− θ2(1−2z)z−fα
. (7)
When z = 1/4, then H(1/4, θ;α, f) reduces to the period incentive to cheat on monopoly
output,h(θ;α, f). As in Proposition 2, one can show thatH(z, θ) is a U-shaped function ofθ
for everyz ∈(1/4,1/3). Proposition 4 shows that when demand realizations make it more
at-tractive to cheat on the cartel, members must reduce this attraction by increasing output
rela-tive to the monopoly level, but that output increases become less and less effecrela-tive at reducing
this incentive. Further, collusion is harder to sustain both for more extreme low demand
re-alizations and for more extreme high demand rere-alizations, requiring greater overproduction:
Proposition 4. Outside the monopoly support region [θ,θ¯], the period incentive to cheat is
a continuously decreasing, convex function of output relative to monopoly levels: ∂H∂z(z,θ) <
0, and ∂2H∂z(z,θ2 ) > 0. Overproduction relative to monopoly output rises when demand
is further from the monopoly support region: ∂
q(θ) qm(θ)
/∂(θ − θ) > 0 for θ < θ, and
∂qqm(θ(θ))
/∂(θ−θ¯)>0 forθ >θ¯.6
One might conjecture that when fixed operating costs, f, are higher, or cartel members
are more risk averse (lowerα), it becomes more difficult to support collusion in every demand
state. The intuition underlying such a conjecture is that such changes raise the period
conjecture is incomplete. The conjecture that greater fixed costs or increased risk aversion
make collusion harder to support would follow directly if the net continuation payoffs from
collusion versus punishment did not rise. However, asf is increased (or agents become more
risk averse), the threat to punish cheating on the cartel by reverting to Nash equilibrium
outputs becomes harsher relative to the gain from a given level of cooperation. If, as a result,
v rises by enough with greater operating costs or risk aversion to offset the increased period
incentive to cheat on the cartel, then greater collusion may be facilitated.
We next characterize how the extent of risk aversion or fixed costs affect the ability to
support collusion in different demand states. We establish a single-crossing property
char-acterizing which states collusion is easier to support. We show that provided that increases
in operating costs f or in risk aversion (reductions in α) do not uniformly raise or lower
the incentive to cheat on the cartel, then greater fixed costs and greater risk aversion make
collusion harder to support when demand is low, but easier when demand is high.
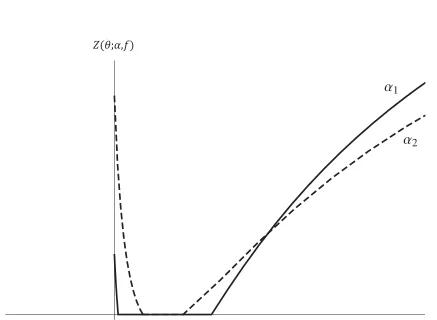
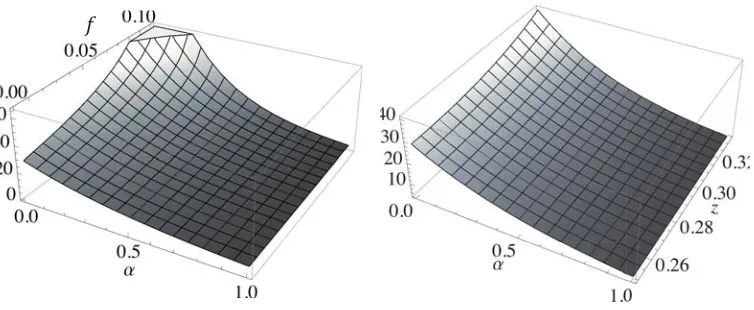
[Place Figure 2 about here.]
Proposition 5. Consider α2 < α1. Suppose there exists aθ∗ such that z1(θ∗) = z2(θ∗)> 14.
Then outside the monopoly support region, more risk averse agents find it harder to support
collusion in bad times, but easier in good times: For α2 < α1, for all θ < θ∗, if z2(θ)>1/4,
then z2(θ)> z1(θ); and for all θ > θ∗, if z1(θ)>1/4 then z2(θ)< z1(θ).
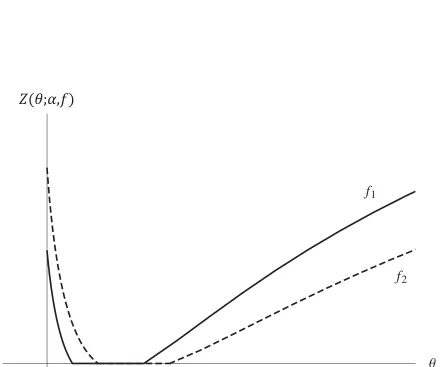
Proposition 6. Consider fixed operating costs,f2 > f1. Suppose there exists aθ∗ such that
z1(θ∗) =z2(θ∗)> 14. Then outside the monopoly support region, greater fixed costs make it
harder to support collusion in bad times, but easier in good times: Forf2 > f1, for allθ < θ∗,
if z2(θ)>1/4, thenz2(θ)> z1(θ); and for all θ > θ∗, if z1(θ)>1/4 thenz2(θ)< z1(θ).
[Place Figure 3 about here.]
The key to these proofs is to show that the impact of an increase inf or in risk aversion on
the period gain from cheating,H(z, θ) falls withθfor a fixedz=q(θ)/θ, i.e., that ∂2H∂f ∂θ(z,θ;f) <
A grid search of the parameter space in the neighborhood of the values used in
Fig-ures 2 and 3 indicates that when (a) demand is uniformly distributed, and (b) agents are
sufficiently risk averse with high enough operating costs that the monopoly support region
is interior, then continuation payoffs always rise with f or with risk aversion by amounts
that, consistent with Figures 2 and 3 and the two propositions, give rise to asymmetric
effects on the cartel’s ability to support collusion. That is, with uniform uncertainty, the
single-crossing property always holds. Numerically, we find that the ‘crossing point’ is
al-ways at a high demand state.7 That is, the effect of an increase in f or reduction in
α on the increased incentive to cheat dominates the impact on net continuation payoffs
for sufficiently low demand shocks where agents are especially desperate for another
dol-lar of profit. However, net continuation payoffs rise with increased operating costs and
increased risk aversion, and this effect dominates once demand is sufficiently high, making
collusion easier to sustain. These results reflect the induced decreasing relative risk aversion
in preferences—the effect of an increase in operating costs or risk aversion on the period
utility gain from cheating on a given level of collusion falls as demand, and hence profits,
rise.
[Place Figure 4 about here.]
II.(ii) Asymmetric Cartels.
Although we do not analyze it formally, Propositions 5 and 6 have suggestive implications
for how heterogeneous agents with different levels of fixed operating costs or risk aversion
should collude. For example, in practice, OPEC countries do not rely solely on oil
rev-enues, and higher non-oil revenues effectively imply lower fixed operating costs. From this
perspective, Saudi Arabia with $1,789 per capita in non-oil export revenues may effectively
has $127 per capita in non-oil export revenues.8 Then the propositions would suggest that
Saudi Arabia should have a lower share of output in low demand states (where high
op-erating cost cartel members find cheating more attractive), but a higher share of output
when demand is high (and high operating cost cartel members mind ceding share by less,
and are willing to do so in order to obtain greater shares in low demand states where they
care more about their shares). That is, high operating cost countries gain relatively more
utility from a marginal dollar when demand is low, and their incentive to cheat on the
car-tel in low demand states is higher. As a result, a carcar-tel that maximizes a weighted sum
of its members’ utilities will allocate relatively greater shares to high operating cost/more
risk-averse countries when demand is low, and relatively lower shares when demand is high.
Consequently, the output of a low operating cost/low non-oil budget deficit cartel member
should be more sensitive to the level of demand than the output of higher operating cost
cartel members. Thus, Saudi Arabia should be the swing producer, with a smaller share of
output in bad times, and a larger share in good times, so that its output would appear to
be the primary driver determining cartel outcomes, as the popular press regularly
empha-sizes.
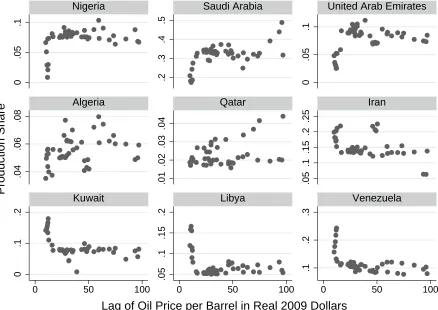
[Place Table I about here.]
Figure 4 offers evidence consistent with such a premise.9 Production shares are very
asymmetric, with four countries—Iran, Kuwait, Libya and Venezuela—consistently having
sharply higher shares when oil prices are very low; and three countries—Saudi Arabia, United
Arab Emirates and Nigeria—consistently having sharply lower production shares when oil
prices are very low, and higher shares when oil prices are at their highest.10 Table I
sum-marizes this figure by measuring the slope of the price-share relationship using regression
analysis. It shows that Saudi Arabia among the pro-cyclical producers and Venezuela among
the counter-cyclical producers have the highest (absolute) price sensitivity. On average, for
by 0.158%, whereas Venezuela increases its share by 0.085%. Obviously, conclusions about
why these patterns obtain are speculative in nature, and a full analysis is beyond the scope
of our paper. Nonetheless, the patterns are quite suggestive.
III. CONCLUSION
A robust prediction of the theoretical literature on collusion under demand uncertainty when
cartel members observe demand and can monitor each other’s actions is that collusion is more
difficult when demand is higher. In contrast to this theoretical prediction, most empirical
researchers have concluded that price wars are more common when demand is low; but a
few find cartels also break down in booms.
We provide a simple theory of collusion by risk averse agents that face positive fixed
op-erating costs that can reconcile these literatures by providing conditions under which (1) it is
most difficult to collusively restrict output when demand is especially low, but (2) it also
be-comes difficult to support collusion when demand is high. The literature has long advocated
that a firm’s objective is better described by risk aversion. Moreover, many effective cartels
are comprised of countries that may care about the utility derived by their risk-averse citizens
from those profits. As a result, the marginal value of a dollar of profit is greater when demand,
and hence profits, are lower; and this high marginal valuation is magnified by the large fixed
operating costs that Scherer [1980] cites as playing a vital role in making collusion difficult.
We show that for aggregate cartel output relative to monopoly levels to be a U-shaped
function of the level of demand, both ingredients are necessary—cartel members must be risk
averse, and operating costs must be positive, inducing DARA preferences. We further
estab-lish that when cartel members are more risk averse or fixed operating costs are higher, then
APPENDIX
Proof of Proposition 1.
When α = 1, it is immediate from Rotemberg and Saloner [1986] that q(θ)/qm(θ) is
non-decreasing inθ.
If f = 0, and the IC constraint does not bind, then qC(θ)/qm(θ) = 1. Now suppose that
the IC constraint binds, and let θ1 < θ2 be two arbitrary values of θ outside the monopoly
support region. Since qm(θ) = θ/4, to show that q(θ)/qm(θ) increases in θ we must show
that q(θ2)/θ2 > q(θ1)/θ1, where q(θi)/θi ≡ zi ∈ (1/4,1/3). To prove that z2 > z1, suppose
instead that z1 ≥z2. Rewrite the IC constraint in terms of zi when f = 0 as:
θ2i(1−zi) 2
4
α
− θi2(1−2zi)zi
α
=v.
Since v is independent of θ,
θ21(1−z1) 2
4
α
−θ21(1−2z1)z1
α
=θ22(1−z2) 2
4
α
−θ22(1−2z2)z2
α
.
Since θ1 < θ2, it follows that
(1−z1)2
4
α
−(1−2z1)z1
α
>
(1−z2)2
4
α
−(1−2z2)z2
α
.
Calling the four terms in this inequality from left to right as A, B, C and D, rewrite the
in-equality as: A−B > C −D. Under the assumption z1 > z2, and recalling that cooperation
profits decrease in z, i.e., (1−2z)z decreases in z > 1/4, we have B/D < 1. Therefore,
A−B > C −D implies that A−BB > C−DB > C−DB BD = C−DD . Therefore, AB > DC, i.e.,
(1−z1)
2 4 (1−2z1)z1
α
>
(1−z2)2 4 (1−2z2)z2
α
,
or equivalently, (1−z1)2 (1−2z1)z1 >
(1−z2)2
(1−2z2)z2 for z2 ≥ z1. But g(z) = (1−z)2
(1−2z)z is a decreasing function
Proof of Proposition 2.
The first-order condition is
h0(θ) =2αθ
9 64(
9θ2 64 −f)
α−1 −1 8(
θ2 8 −f)
α−1
= 0.
Solving yields
θ2 8 −f 9θ2
64 −f = (8
9) 1
1−α ≡k ⇒θˆ= 8
r
(1−k)f 8−9k .
Notice that k = (89)1−1α < 8
9 <1. Clearly, θ <θˆimplies that
θ2 8 −f 9θ2
64 −f <(8
9) 1
1−α ⇒9(9θ 2
64 −f)
α−1 <8(θ2 8 −f)
α−1.
Therefore,h0(θ)<0. A similar argument holds forθ >θˆ.
The requirement that a <θ < bˆ imposes bounds on the range of α. We require
a <θˆ= 8
s
(1−k(α))f 8−9k(α) < b.
Solving yields the upper and lower bounds:
¯
α(f) = 1 + log(9/8) log(89aa22−−6464ff)
and α(f) = 1 + log(9/8) log(89bb22−−6464ff)
.
Since α(x;f) = 1 + log(9/8)/log(98xx22−−6464ff) is a decreasing function of x, with a limit of zero
asx goes to infinity, ˆθ ∈(a, b) exists as long as α(f)< α <α¯(f).
Finally, differentiating α¯(f) (or similarly α(f)) and ˆθ(α, f) with respect to f and α
delivers the comparative statics results:
∂α¯(f)
∂f =
8a2log(9/8)
(9a2−64f)(a2−8f)log(1− a2 9a2−64f)
2 ≥0,
which is non-negative since f < a92; and
∂θˆ(α, f)
∂α =−
22αα−−119 1
1−αlog9 8
f
(α−1)22α3α−19 1 1−α −9
2 s
(9 8)
1 1−α−1
f
2α3α−191−1α−9
<0; ∂ ˆ θ(α, f)
∂f = 4 f v u u t 8 9
1−1α −1f
81−1α9 α α−1 −8
Proof of Corollary 1.
Let θ < θ¯ be the two roots of h(θ;α, f) = v when it has two roots for a ≤ θ ≤ b. Note
that v is independent of θ. Since h(θ;α, f) is a U-shaped function of θ (Proposition 2),
for intermediate values of θ where h(θ;α, f) < v the IC constraint (3) is slack. Therefore,
monopoly profits can be supported for θ ∈[θ,θ¯].
For h(θ;α, f) = v to have two roots, v can be neither too small nor too large. Since
v ≡1−ββ (UC−UP), there is one-to-one mapping betweenv and β11Thus, we must bound
β appropriately: β must exceed the β that solves
h(ˆθ;α, f) =
β
1−β
(UC −UP),
and be less than the ¯β that solves
Min{h(a;α, f), h(b;α, f)}=
¯
β 1−β¯
(UC −UP).
Hence, h(θ;α, f) = v has two roots forθ ∈[a, b] if and only if β ∈[β,β¯].
Proof of Proposition 3.
We must show that h(ˆθ−δ)> h(ˆθ+δ), i.e.,
9
64(ˆθ−δ) 2−f
α −
1
8(ˆθ−δ) 2−f
α
>
9
64(ˆθ+δ) 2−f
α −
1
8(ˆθ+δ) 2 −f
α
.
Letm1 = 18(ˆθ2+δ2)−f, and m2 = 649(ˆθ2+δ2)−f. Also let n1 = 81(2ˆθδ), andn2 = 649(2ˆθδ).
Now rewrite the inequality to be established as
(m1+n1)α−(m1−n1)α >(m2+n2)α−(m2−n2)α.
Given that m2 > m1 and n2 > n1, to prove the above inequality it suffices to show that the
cross-derivative ofL= (m+n)α−(m−n)αwith respect tomandnis negative, and we have:
∂2L
∂m∂n =−α(1−α) (m+n) α−2
Proof of Proposition 4.
∂H(z, θ)
∂z =
1 2αθ
2
2(4z−1)(θ2(1−2z)z−f)α−1−(1−z)(θ 2
4(1−z)
2−f)α−1
.
To show ∂H∂z(z,θ) is negative, equivalently we must prove:
1−z 2(4z−1) >
θ2 1
4(1−z) 2−f
θ2z(1−2z)−f
1−α
.
Since the cheat payoff, (1− z)2/4 always exceeds the cooperation payoff, z(1− 2z), the
right-hand side exceeds one. Therefore, it suffices to show that
1−z 2(4z−1) >
θ2 14(1−z)2−f θ2z(1−2z)−f.
Definef0 ≡f /θ2 and rearrange the above inequality as
1−z 2(4z−1)−
1
4(1−z) 2−f0
z(1−2z)−f0 = 1
2(3z−1)(z−1 + 6f 0)
2(4z−1)(z(1−2z)−f0) >
1
6(3z−1) 2
2(4z−1)(z(1−2z)−f0) >0,
for 1/4 ≤ z < 1/3. The next to the last inequality follows since the above expression
decreases in f0 and thus is minimized when f0 equals its upper bound of M ax(c/θ2) =
(a2/9)/a2 = 1/9, implying that 3(z−1 + 6f0)>(3z−1).
To prove convexity of H, we bound the second derivative of H/α strictly away from zero
(we divide by α because the derivative of H goes to zero as α goes to zero). We also write
H/α in terms off0 =f /θ2 ∈[0,1
9] to make the domain compact:
1
αH(z;α, f 0
) = 1 α
(1−z)2
4 −f
0
α
−((1−2z)z−f0)α
,
with associated second derivative
1 α
d2H dz2 =
1
4(1−α)
"
4(4z−1)2((1−2z)z−f0)α−2−(1−z)2
1
4(1−z) 2−
f0
α−2#
(8) +1 2 " 1
4(1−z) 2−f0
α−1
+ 16 ((1−2z)z−f0)α−1
#
The compact domain hasz ∈[1/4,1/3],α ∈[0,1] and f0 ∈[0,1/9]. Further, α1ddz2H2 is
contin-uous and twice differentiable on its domain, with derivatives bounded from below, so that in
an ball around any point (z, α, f0), α1ddz2H2 cannot drop too far below its value at (z, α, f
0).
Therefore, to establish convexity, it suffices to bound α1ddz2H2 strictly away from zero on an
appropriately fine grid. An exhaustive search on a grid with increments of 0.001 for z, α
and f0 reveals that it achieves a lower bound of 9/2 whenα = 1. See Figure 5.
[Place Figure 5 about here.]
We now establish that over-production relative to monopoly increases in θ−θ¯forθ >θ¯;
and in θ−θ, for θ < θ. First consider any θ2 > θ1 ∈ (¯θ, b]. To establish that q(θ)/qm(θ)
increases in (θ−θ¯), we show that z2 > z1. Suppose instead that z1 > z2. We have:
H(zi, θi) =
θi2(1−zi) 2
4 −f
α
−θi2(1−2zi)zi−f
α
=v for i= 1,2.
Consider the two functions H(., θ1) and H(., θ2). From Proposition 2 for θ > θ¯, h increases
inθ, so
h(θ2;α, f)> h(θ1;α, f)⇒H(1/4, θ2)> H(1/4, θ1).
Also from incentive compatibility,
H(z2, θ2) = H(z1, θ1) = v,
at the premised z1 > z2, and since H(z, θ) is decreasing in z for any θ, this implies
that H(z2, θ1) > H(z2, θ2). But if H(1/4, θ2) > H(1/4, θ1) and H(z2, θ2) < H(z2, θ1)
then by the intermediate value theorem there exists a z0 with 1/4 < z0 < z2 such that
H(z0, θ2) =H(z0, θ1), a contradiction of θ2 > θ1 and z0 <1/3.
An identical proof by contradiction establishes that if θ1 < θ2 < θ, then z1 > z2. That
is, z1 < z2 would imply H(z2, θ2) = H(z1, θ1) at z1 < z2 (by incentive compatibility), and
intermediate value theorem.
Proof of Proposition 5.
Let H1(z, θ) ≡ H(z, θ;α1, f) and H2(z, θ) ≡ H(z, θ;α2, f) for α1 > α2. We prove that if
there exists a θ such that z1(θ) = z2(θ), then it is unique. Call these values θ∗ and z∗. To
establish this single-crossing result, we prove that for a fixed z, H1 −H2 increases in θ by
showing that ∂H∂θ increases in α. Therefore, there exists a neighborhood of θ∗ and z∗, such
that for a fixed z, H1 is a steeper function of θ than H2.
When both IC constraints bind (i.e., Hi =vi for i= 1,2) then H1−H2 =v1−v2 does
not vary with θ, i.e., ∂H∂θ = ∂v∂θ = 0.
H(z, θ) =
θ2(1−z) 2
4 −f
α
− θ2(1−2z)z−fα=v ≡v(α, f), (9)
∂H
∂θ =
1
2θα (1−z) 2
θ2(1−z) 2
4 −f
α−1
−4z(1−2z) θ2(1−2z)z−fα−1
!
= 0.
DefiningγF ≡(1−z)2
θ2 (1−z4)2 −f
α−1
andγC ≡4z(1−2z) (θ2(1−2z)z−f)α−1, we must
haveγF =γC ≡γ. We now prove that ∂H∂θ increases in α, i.e., ∂
2H
∂θ∂α >0:
∂2H ∂θ∂α=
1 2θ
(1−z)2θ2(1−z)
2
4 −f
α−1
−4z(1−2z)θ2(1−2z)z−f
α−1
+α(1−z)2θ2(1−z)
2
4 −f
α−1
logθ2(1−z)
2
4 −f
−4z(1−2z)θ2(1−2z)z−f
α−1
logθ2(1−2z)z−f.
SubstitutingγF and γC, and using γF =γC ≡γ, rewrite this as:
∂2H
∂θ∂α = 1 2θ
γF−γC+α
γFlog
θ2(1−z)
2
4 −f
−γClog
θ2(1−2z)z−f
=1 2θαγ
logθ2(1−z)
2
4 −f
−logθ2(1−2z)z−f>0.
The inequality holds since (1−z4)2 > (1−2z)z for z ∈ [1/4,1/3). When monopoly output
cannot be supported in both environments, then ∂θ∂α∂2H > 0, implies that for θ > θ∗, we
need z1(θ) > z2(θ) to retrieve H1 = v1 and H2 = v2; and θ < θ∗ demands z1(θ) < z2(θ).
Proof of Proposition 6.
Let H1(z, θ) ≡ H(z, θ;α1, f) and H2(z, θ) ≡ H(z, θ;α2, f) for f1 < f2. We prove that if
there exists a θ such that z1(θ) = z2(θ), then it is unique. Call these values θ∗ and z∗. To
establish this single-crossing result, we prove that for a fixed z, H1 −H2 increases in θ by
showing that ∂H∂θ decreases in f. Therefore, there exists a neighborhood of θ∗ and z∗, such
that for a fixed z, H1 is a steeper function of θ than H2.
When both IC constraints bind then ∂H∂θ = ∂v∂θ = 0. We have
∂H
∂θ =
1
2θα (1−z) 2
θ2(1−z) 2
4 −f
α−1
−4z(1−2z) θ2(1−2z)z−fα−1
!
= 0.
We now prove that ∂H∂θ decreases in f, i.e., ∂θ∂f∂2H <0:
∂2H
∂θ∂f =
1
2α(1−α)θ (1−z) 2
θ2(1−z) 2
4 −f
α−2
−4z(1−2z) θ2(1−2z)z−fα−2
!
.
SubstitutingγF and γC, and using γF =γC ≡γ, rewrite this as:
∂2H
∂θ∂f =
1
2α(1−α)θ
γF
θ2 (1−z)2
4 −f
− γC
θ2(1−2z)z−f
!
= 1
2α(1−α)θγ
1
θ2 (1−z)2
4 −f
− 1
θ2(1−2z)z−f
!
<0.
The inequality holds since (1−z4)2 > (1−2z)z for z ∈ [1/4,1/3), and hence its reciprocal is
smaller. When monopoly output cannot be supported in both environments, then ∂θ∂f∂2H >0,
implies that for θ > θ∗ we need z1(θ)> z2(θ) to retrieve H1 =v1 and H2 =v2, andθ < θ∗
EXTENSIONS
N >2 Agents. With N > 2 agents, in in a symmetric cartel (qi
t = qt) date t demand
simplifies to Pt=θt−N qt. Cooperation, cheating and Nash profits become:
πC(θ) = (θ−N qC(θ))qC(θ)−c
πF(θ) = (θ−(N −1)qC(θ))2/4−c
πP(θ) = θ2/(N + 1)2−c.
When each firm produces one Nth of monopoly output, i.e., q
C(θ) = θ/(2N), each member
earns one Nth of monopoly profits net of operating costs, i.e., πC(θ) = θ2/(4N)−c, and
the associated fink output is (N4+1N )θ, resulting in fink profit N4+1N 2θ2 −c. Now we extend
Proposition 2 toN >2.
The incentive to cheat on monopoly output becomes:
h(θ;α, c) = U(πF(θ))−U(πC(θ)) =
(N + 1 4N )
2 θ2−c
α −
θ2 4N −c
α
, (10)
which we establish is a U-shaped function of θ. To see this, differentiate hwith respect to θ
and solve the resulting first-order condition for the interior minimizer:
θ2 4N −c (N4+1N )2θ2−c =
4N (1 +N)2
1−1α
≡kN ⇒θˆN = 4N
s
(1−kN)c 4N −kN(1 +N)2
.
Note that kN =
4N (1+N)2
1−1α
< (1+4NN)2 < 1. As when N = 2, the fact that θ2 4N−c (N+14N )2θ2−c increases in θ, implies that for θ <θˆN
θ2 4N −c (N4+1N )2θ2−c <
4N (1 +N)2
1−1α ⇒
N + 1 4N
2
N + 1 4N
2
θ2−c
!α−1
<4N
θ2 4N −c
α−1
,
or equivalently h0(θ)<0. A similar argument holds for θ >θˆN.
General Demand and Utility Functions. We now generalize the setting under which the
analogue of Proposition 2 holds, providing more general conditions under which the
πF(θ)> πC(θ), are increasing in θ, we drop the explicit dependence on θ and write πF(πC).
We assume that:
1. Net (gross minus fixed cost) fink profit is (a) a positive, increasing convex function of
net monopoly profit with πF(πC)> πC, πF0 (πC)>1 and (b) strictly positive when net
monopoly profit goes to zero, i.e., πF(0) >0.
2. The utility functionUis such that (a)−U00(x)/U0(x) is non-increasing inx(CARA/DARA),
where xis net profit, and (b) U0(0) =∞.
3. limπC→∞
dU(πF)
dπF
dπF(πC)
dπC >
dU(πC)
dπC .
When limπC→∞U
0(π
F)/U0(πC) = limπC→∞U
0(π
F/πC) (e.g., power utility over net profit),
assumption 3 can be replaced by −(U0)2/U00 >1.
We now show that the key result of proposition 2 extends with this structure. The
analogue of equation (5) becomes:
h(πC) = U(πF(πC))−U(πC). (11)
Differentiating yields
h0(πC) = U0(πF)πF0 (πC)−U0(πC)
= U0(πC)
U0(πF) U0(π
C)
πF0 (πC)−1
≡U0(πC)e(πC),
where we writeπF instead ofπF(πC). We now show thath(πC) is a U-shaped function ofπC
(and henceθ), wheneverπC ≡πC(θ) is sufficiently small, and ¯πC ≡πC(¯θ) is sufficiently large.
We use the intermediate value theorem to prove that there is a ˆπC such that e(ˆπC) = 0.
We first show that e(πC) is a continuous, strictly increasing function of πC. The sign of the
derivative ofe(πC) is given by the sign of
(U00(πF)(πF0 ) 2+U0
(πF)πF00)U 0
(πC)−U0(πF)πF0 U 00
(πC)
> πF0 (U00(πF)πF0 U 0(π
C)−U0(πF)U00(πC))
where the first inequality holds since πF is convex, and the second inequality holds since
πF0 >1 and U00(πF)/U0(πF)> U00(πC)/U0(πC), since−U00(x)/U0(x) is non-increasing inxby
assumption 2.
As πc →0, πF(0) > 0 implies U0(πF)/U0(πC) →0. Therefore, there exists πC >0 such
that e(πC)<0 for all πC < πC, and by assumption 3, π 0 F >
U0(πC)
U0(π
F) for πC sufficiently large. Thus, by the intermediate value theorem there exists a ˆπC at which e(ˆπC) = 0, and hence
h0(πC) = 0. Because e(πC) is increasing in πC we have h0(πC) < 0 for for πC < ˆπC and
h0(πC)>0 for πC >πˆC. Thus, h(πC) is a U-shaped function of πC, and hence θ.
REFERENCES
Aiginger, K., Mueller, D. C., Weiss, C., November 1998. 'Objectives, topics and methods in
industrial organization during the nineties: Results from a survey'. International Journal
of Industrial Organization 16 (6), pp. 799–830.
Appelbaum, E., Katz, E., 1986. 'Measures of Risk Aversion and Comparative Statics of
Industry Equilibrium'. The American Economic Review 76 (3), pp. 524–529.
Asplund, M., 2002. 'Risk-averse firms in oligopoly'. International Journal of Industrial
Organization 20 (7), pp. 995 – 1012.
Bagwell, K., Staiger, R., 1997. 'Collusion over the business cycle'. RAND Journal of
Economics 28 (1), pp. 82–106.
Borenstein, S., Shepard, A., 1996. 'Dynamic pricing in retail gasoline markets'. RAND
Journal of Economics 27 (3), pp. 429–451.
Buschena, D. E., Perloff, J. M., 1991. 'The Creation of Dominant Firm Market Power in
the Coconut Oil Export Market'. American Journal of Agricultural Economics 73 (4),
Busse, M., 2002. 'Firm financial condition and airline price wars'. Rand Journal of
Economics 33, pp. 298–318.
Chevalier, J., Scharfstein, D., 1996. 'Capital-Market Imperfections and Countercyclical
Markups: Theory and Evidence'.American Economic Review 86 (4), pp. 703–725.
Domowitz, I., Hubbard, R. G., Petersen, B. C., 1987. 'Oligopoly Supergames: Some
Empir-ical Evidence on Prices and Margins'.Journal of Industrial Economics35 (4), pp. 379–98.
Ellison, G., 1994. 'Theories of cartel stability and the joint executive committee'. RAND
Journal of Economics 25 (1), pp. 37–57.
Fabra, N., 2006. 'Collusion with capacity constraints over the business cycle'. International
Journal of Industrial Organization 24 (1), pp. 69 – 81.
Green, E., Porter, R., 1984. 'Noncooperative collusion under imperfect price information'.
Econometrica 52 (1), pp. 87–100.
Greenwald, B. C., Stiglitz, J. E., 1990. 'Asymmetric Information and the New Theory of
the Firm: Financial Constraints and Risk Behavior'. The American Economic Review
80 (2), pp. 160–165.
Haltiwanger, J., Harrington, J., 1991. 'The impact of cyclical demand movements on
collusive behavior'.RAND Journal of Economics 22 (1), pp. 89–106.
Kandori, M., 1991. 'Correlated demand shocks and price wars during booms'. Review of
Economic Studies 58, pp. 171–180.
Karp, L. S., Perloff, J. M., 1989. 'Dynamic Oligopoly in the Rice Export Market'. The
Review of Economics and Statistics 71 (3), pp. 462–470.
Karp, L. S., Perloff, J. M., 1993. 'A Dynamic Model of Oligopoly in the Coffee Export
Knittel, C. R., Lepore, J. J., 2010. 'Tacit collusion in the presence of cyclical demand and
endogenous capacity levels'. International Journal of Industrial Organization 28 (2), pp.
131–144.
Mariuzzo, F., Walsh, P. P., 2013. 'Commodity Market Dynamics and the Joint Executive
Committee, 18801886'. Review of Economics and Statistics95 (5), pp. 1722–1739.
Nocke, V., 1999. Cartel stability under capacity constraints: The traditional view restored.
Working Paper, Nuffield College, Oxford.
Nocke, V., Thanassoulis, J., 2014. 'Vertical Relations Under Credit Constraints'.Journal of
the European Economic Association 12 (2), pp. 337–367.
Porter, R., 1985. 'On the incidence and duration of price wars'. Journal of Industrial
Economics 33 (Jun 85), pp. 415–26.
Rosenbaum, D. I., Sukharomana, S., 2001. 'Oligopolistic pricing over the deterministic
mar-ket demand cycle: some evidence from the US Portland cement industry'. International
Journal of Industrial Organization 19 (6), pp. 863 – 884.
Rotemberg, J., Saloner, G., 1986. 'A supergame-theoretic model of price wars during
booms'. American Economic Review 76 (3), pp. 390–407.
Sandmo, A., 1971. 'On the Theory of the Competitive Firm Under Price Uncertainty'. The
American Economic Review 61 (1), pp. 65–73.
Scherer, F., Ross, D., 1990. Industrial Market Structure and Economic Performance.
Boston, Houghton Mifflin.
Scherer, F. M., 1980. Industrial Market Structure and Economic Performance, 2nd Edition.
Boston, Houghton Mifflin.
Spagnolo, G., 1999. 'On Interdependent Supergames: Multimarket Contact, Concavity, and
Spagnolo, G., 2005. 'Managerial incentives and collusive behavior'. European Economic
Review 49 (6), pp. 1501 – 1523.
Staiger, R. W., Wolak, F. A., 1992. 'Collusive Pricing with Capacity Constraints in the
Presence of Demand Uncertainty'.RAND Journal of Economics 23 (2), pp. 203–220.
Suslow, V. Y., 2005. 'Cartel contract duration: empirical evidence from inter-war
Notes
1This prediction need not hold if firms face capacity constraints (see Fabra [2006] which features exogenous
constraints or Knittel and Lepore [2010], which features endogenous constraints.)
2Papers that model international commodity markets as output competition include Karp and Perloff
[1989], Buschena and Perloff [1991], and Karp and Perloff [1993] which employ quantitative competition
structure with a homogenous good to estimate the degree of competitiveness in the markets for rice, coffee,
and coconut oil.
3Consistent with this, many large commodity providers in the middle 20thcentury were family-owned big
companies/oligarchists (e.g., Brazilian coffee farmers); and Busse [2002] provides evidence that price wars in
airline industry were unilaterally initiated by financially troubled firms.
4Spagnolo’s conclusion reflects the intertemporal income smoothing by firms that are averse to profit
variance. More risk aversion helps collusion because the collusion path is less volatile than the paths for
defection and punishment. In contrast, in our set up, risk aversion alters the marginal utility of period gains
from defection vs. collusion: higher risk aversion makes collusion harder to support in recessions (when the
difference in marginal utilities is highest) but easier in booms (when the net continuation payoff is highest).
5In particular, we need the net profits from cheating on the cartel to rise convexly with demand, and to
be strictly positive when net per firm monopoly profit goes to zero, together with CARA/DARA preferences
that have appropriate Inada assumptions. In sum, we need that the high marginal utility of a dollar to
domi-nate the small profit available from cheating in low demand states, and the convex, growing dollar gains from
cheating on the cartel to dominate the decreasing marginal utility of those dollars in high demand states.
6The proof establishes convexity ofH using an exhaustive grid search algorithm on the compact set of
parameters, establishing a lower bound on α1ddz2H2 of
9 2 >0.
7Not surprisingly, one can construct very asymmetric distributions such that on some parameter range,
8Data source: 2013 OPEC Statistical Bulletin and 2013 IMF World Economic Outlook
9The pattern is robust to including year-fixed effects to control for events in this period that can impact
all OPEC members such as the Iraq or Gulf war, the Iranian revolution, etc.
10We exclude Iraq’s share due to the impact of the war and the fact that Iraq did not fully participate in
OPEC’s production agreements in this period. We omit Indonesia because their oil output was so low that
they eventually became importers, and exited OPEC.
11We ignore the endogeneity ofqwith respect toβand its effect onUC. Asβrises there is an indirect effect
onvvia changes inUC. That is,UCis a function ofq(θ) at each stateθ, but its effect is reinforcing: (i) from
v≡1−ββ(UC−UP), we see that fixingqstate-by-state, increasingβraisesv, i.e.,dv/dβ >0 for fixedq’s,
and (ii) from the constrained optimization in (4), increasingv relaxes the IC constraint, weakly increasing
period payoffs, i.e.,dUC/dv≥0. It follows from (i) and (ii) thatdUC/dβ≥0. SinceUP =E[U(θ2/9−f)] is
independent ofqand therefore ofβ, the indirect effect ofβonvmust be reinforcing, i.e.,d(UC−UP)/dβ >0.
Venezuela Iran Kuwait Libya Qatar Algeria Nigeria UAE Saudi Oil Price -0.085*** -0.07*** -0.066*** -0.043** 0.01** 0.012* 0.025** 0.03** 0.158***
(0.00) (0.00) (0.00) (0.02) (0.01) (0.06) (0.03) (0.02) (0.00) Constant 15.119*** 17.899*** 11.299*** 8.888*** 1.905*** 5.079*** 6.291*** 6.561*** 25.02***
(0.00) (0.00) (0.00) (0.00) (0.00) (0.00) (0.00) (0.00) (0.00)
R2 0.29 0.24 0.23 0.13 0.14 0.08 0.11 0.11 0.36
[image:33.612.72.537.303.386.2]N 44 44 44 44 44 44 44 44 44
Θ
Θ
Θ
Θ
h
Θ
,
Α
,c
[image:34.612.104.521.222.514.2]h(
ߠ
;
ߙ
,
݂
)
a
1a
2q
z
q
;
a
,c
[image:35.612.79.516.181.501.2]ܼ(ߠ;ߙ,݂)
f
1f
2q
z
q
;
a
,c
[image:36.612.87.527.131.498.2]ܼ
(
ߠ
;
ߙ
,
݂
)
0
.05
.1
.2
.3
.4
.5
0
.05
.1
.04
.06
.08
.01
.02
.03
.04
.05
.1
.15
.2
.25
0
.1
.2
.05
.1
.15
.2
.1
.2
.3
0 50 100 0 50 100 0 50 100
Nigeria Saudi Arabia United Arab Emirates
Algeria Qatar Iran
Kuwait Libya Venezuela
Production Share
[image:37.612.87.525.206.516.2]Lag of Oil Price per Barrel in Real 2009 Dollars
݂