warwick.ac.uk/lib-publications
A Thesis Submitted for the Degree of PhD at the University of Warwick
Permanent WRAP URL:
http://wrap.warwick.ac.uk/90841
Copyright and reuse:
This thesis is made available online and is protected by original copyright.
Please scroll down to view the document itself.
Please refer to the repository record for this item for information to help you to cite it.
Our policy information is available from the repository home page.
Exploring patients’ experience of viewing their own 3D medical imaging results
during a clinical consultation
By Emma Elizabeth Phelps
A thesis submitted in fulfilment of the requirement for the degree of
Doctor of Philosophy in Health Sciences
Department of Health Sciences, Warwick Medical School
Table of Contents
List of tables, figures and boxes ... 1
Acknowledgements ... 5
Declaration ... 6
List of abbreviations ... 7
Abstract ... 8
Introduction ... 9
Preface ... 9
Overall aim ... 9
Objectives ... 9
Structure of the thesis ... 11
Part One ... 13
Chapter One: Background ... 13
1.1. Epistemological position ... 13
1.1.1. Interpretive epistemology ... 14
1.1.2. Post-positivism ... 18
1.2. An introduction to medical imaging ... 19
1.2.1. X-Ray ... 20
1.2.2. Computed Tomography (CT) ... 21
1.2.3. Magnetic Resonance Imaging (MRI) ... 23
1.2.4. Ultrasound ... 24
1.2.5. Endoscopic imaging ... 26
1.2.6. 3D imaging ... 27
1.3. Reflections on observations in a radiology department and outpatient clinics .... 31
1.3.1. Radiology department ... 31
1.3.2. Outpatient clinics ... 32
1.3.3. MDTs ... 33
1.4. Chapter Summary ... 33
Chapter Two: Review of relevant literature ... 34
2.1. Medical imaging and research on accuracy of image interpretation ... 35
2.1.1. Inattentional blindness ... 36
2.1.2. Low prevalence targets ... 37
2.1.3. Change blindness ... 38
2.1.4. Satisfaction of search ... 41
2.2. Medical imaging from a sociological perspective ... 45
2.2.1. Visualisation in society and medicine ... 45
2.2.2. The perception of medical images as truthful, authoritative and agentic .... 49
2.2.3. Concerns arising from the perception of medical images as truthful, authoritative and agentic ... 52
2.2.3.1. Overuse of imaging ... 52
2.2.3.2. Disregard for other forms of information ... 53
2.2.3.3. Passivity on part of the patient ... 54
2.2.3.4. Impairment of the clinician – patient relationship ... 55
2.2.3.5. Fragmentation of patients ... 56
2.2.3.6. Images as a powerful resource ... 57
2.3. The clinician – patient relationship ... 58
2.3.1. Models of clinician – patient interaction ... 58
2.3.2. Patient centred consultations ... 60
2.3.3. Trust in the clinician - patient relationship ... 62
2.3.4. Clinician – patient communication ... 64
2.3.5. Shared decision-making ... 68
2.3.6. Decision aids ... 70
2.3.7. Images in health care communication ... 71
2.4. Psychological theories of attention ... 75
2.4.1. Human attention ... 76
2.4.2. Cross modal attention ... 79
2.4.3. Examples of applied research questions tested in the laboratory ... 80
2.5. Chapter Summary ... 83
Part Two ... 85
Chapter Three: Understanding the experience of viewing a 3D image within a clinical consultation: an orthopaedic clinic case study ... 85
3.1. Background literature summary ... 85
3.1.1. Research questions ... 86
3.2. The case study clinic... 86
3.2.1. Clinic selection ... 88
3.3. Statement of methods and justification for the study design ... 88
3.3.1. Non-participant observation ... 89
3.3.2. Interviews ... 90
3.3.3. Video-recording ... 92
3.4.1. Recruitment and participants ... 93
3.4.2. Data collection ... 95
3.4.3. Ethical considerations ... 95
3.4.4. Data analysis ... 96
3.5. Results ... 97
3.5.1. Participant characteristics ... 97
3.5.1.1. Patient recruitment and characteristics ... 97
3.5.1.2. Clinician recruitment and characteristics ... 99
3.5.2. Outline of results ... 100
3.5.3. How are 3D images used within the clinic? ... 103
3.5.3.1. Images seen by recruited patients ... 105
3.5.4. The experience of viewing your own medical imaging results from patient, clinician and an observer’s perspective ... 106
3.5.4.1. Positive emotional impact ... 107
3.5.4.2. Improved patient understanding ... 108
3.5.4.3. A tool to aid clinician – patient communication ... 109
3.5.4.4. Influencing patients’ treatment decisions ... 110
3.5.4.5. Increasing patients’ confidence ... 112
3.5.4.6. The experience of patients who found little impact in viewing their image 112 3.5.4.7. Comparing patient, clinician and video-recording triads ... 113
3.5.5. Practical considerations of sharing images with patients ... 116
3.5.5.1. Copy of image ... 116
3.5.5.2. Comparator ... 116
3.5.5.3. Consultation time ... 117
3.5.5.4. Inability to see soft tissues ... 117
3.5.6. Trust and the perception of medical images as truthful, authoritative and agentic 118 3.5.6.1. 3D images as agents ... 118
3.5.6.2. 3D images as authoritative ... 119
3.5.6.3. 3D image as truth... 119
3.6. Discussion ... 120
3.6.1. Discussion of research findings ... 120
3.6.2. Study strengths and limitations ... 122
3.6.2.1. Reflection ... 123
3.8. Chapter Summary ... 124
Chapter Four: Exploring the content and integration of medical images in orthopaedic clinical consultations. ... 125
4.1. Background literature summary ... 125
4.1.1. Patient centred care ... 125
4.1.2. Communication in consultations about surgery ... 125
4.1.3. Methods of assessing patient-centredness ... 127
4.1.3.1. The Roter Interaction Analysis System ... 129
4.1.4. Summary ... 130
4.1.5. Research questions ... 130
4.2. Methods ... 130
4.2.1. Data analysis ... 131
4.2.1.1. Patient centredness ... 132
4.2.1.2. The use of the image within the consultation ... 132
4.2.1.3. Comparisons with the existing literature ... 133
4.2.1.4. Integration of qualitative data from the video-recordings with the RIAS coding 133 4.3. Results ... 133
4.3.1. Summary of results ... 133
4.3.2. Participant characteristics ... 134
4.3.3. Patient centredness ... 134
4.3.3.1. Verbal dominance ... 134
4.3.3.2. Biomedical and psychosocial content ... 136
4.3.3.3. Task focused and socio-emotional exchange ... 137
4.3.3.4. Comparing the content of doctor and patient utterances ... 138
4.3.4. Exploring the use of images within the consultations ... 141
4.3.5. Comparison with Levinson and Chaumeton’s (1999) study ... 147
4.3.6. Reliability of coding ... 148
4.4. Discussion ... 150
4.4.1. Discussion of research findings ... 150
4.4.2. Study strengths and limitations ... 154
4.5. Conclusions ... 155
4.6. Chapter Summary ... 156
Chapter Five: Exploring perspectives on 3D images and their potential for use in clinical consultations: findings from six focus groups... 157
5.1.1. Research questions ... 158
5.2. Statement of methods and justification for the study design ... 158
5.3. Methods ... 160
5.3.1. Data collection ... 160
5.3.2. Ethical considerations ... 162
5.3.3. Development of materials ... 162
5.3.4. Data analysis ... 162
5.4. Results ... 163
5.4.1. Participant characteristics ... 163
5.4.2. Summary of results ... 165
5.4.3. Comparing 2D and 3D images ... 167
5.4.4. Considering the impact of sharing images with patients from an individual perspective ... 168
5.4.4.1. A tool to aid clinician - patient communication ... 169
5.4.4.2. Aiding treatment decisions and changing behaviour ... 171
5.4.4.3. Participants’ own experiences of viewing their own medical images ... 172
5.4.5. Considering the impact of sharing images with patients from a wider perspective ... 173
5.4.5.1. Practical considerations ... 173
5.4.5.2. Ethical considerations ... 174
5.4.6. The impact of the image in different clinical contexts ... 176
5.4.6.1. Illness ... 176
5.4.6.2. Time ... 178
5.4.7. Perceptions of medical images as truthful, authoritative and agentic ... 179
5.5. Discussion ... 181
5.5.1. Study strengths and limitations ... 184
5.6. Conclusion ... 186
5.7. Chapter Summary ... 186
Chapter Six: Comparing the experience of viewing 3D CT images, 2D CT images and no image alongside a diagnosis. ... 187
6.1. Background ... 187
6.1.1. Research questions ... 188
6.1.2. Statement of methods and justification for the study design ... 190
6.1.3. Ethical considerations ... 193
6.1.4. Development of experimental materials ... 194
6.2.1. Methods ... 194
6.2.1.1. Recruitment and participants ... 194
6.2.1.2. Apparatus and stimuli ... 194
6.2.1.3. Procedure ... 196
6.2.1.4. Data analysis ... 197
6.2.2. Results ... 198
6.2.2.1. Participant characteristics ... 198
6.2.2.2. Parametric assumptions ... 200
6.2.2.3. Comparing the experience of viewing a 3D image, a 2D image and no image alongside a diagnosis. ... 202
6.2.2.4. Preference ... 206
6.2.2.5. Follow- up questionnaire results ... 207
6.2.2.6. Comparison between experimental results and follow up ... 211
6.3. Experiment two ... 214
6.3.1. Methods ... 214
6.3.1.1. Recruitment and participants ... 214
6.3.1.2. Apparatus and procedure ... 214
6.3.1.3. Data analysis ... 217
6.3.2. Results ... 219
6.3.2.1. Participant characteristics ... 219
6.3.2.2. Parametric assumptions ... 221
6.3.2.3. The interaction between image type and information type ... 221
6.3.2.4. The effect of image type on understanding, trust and accuracy ... 222
6.3.2.5. Does receiving detailed information about medical imaging production and interpretation influence trust and perceived accuracy? ... 224
6.3.2.6. Recall of the diagnoses... 225
6.3.2.7. Recall of images ... 226
6.3.2.8. Inattentional blindness ... 226
6.4. Combining experiment one and experiment two data ... 226
6.5. Discussion ... 227
6.5.1. Study strengths and limitations ... 229
6.6. Conclusions ... 231
6.7. Chapter Summary ... 231
Chapter Seven: Synthesis and conclusions ... 232
7.1. Summary and synthesis of research findings... 233
7.1.2. Considerations of sharing images with patients ... 236
7.1.3. 3D images as truthful, authoritative and agentic ... 237
7.1.4. Patient centredness within orthopaedic surgical consultations ... 238
7.2. Strengths and limitations of the research ... 239
7.2.1. Strengths ... 239
7.2.2. Limitations ... 241
7.2.3. Reflection on the challenges encountered during the research project ... 243
7.3. Evaluating the quality of qualitative research ... 244
7.4. Recommendation for future research ... 245
7.5. Implications for clinical practice ... 248
7.5.1. Implications for orthopaedic clinical consultations ... 248
7.5.2. Implications for clinical consultations in other specialities ... 249
7.5.3. Implications for radiology ... 250
7.6. Theoretical implications ... 251
7.7. Conclusions ... 251
References ... 253
Appendices ... 271
Appendix 1: Invitation letter ... 271
Appendix 2: Information sheet (patients)... 272
Appendix 3: Information sheet (clinicians) ... 274
Appendix 4: Consent form (patients) ... 276
Appendix 5: Consent form (clinicians) ... 277
Appendix 6: Observation template ... 278
Appendix 7: Patient interview guide ... 279
Appendix 8: Clinician interview guide ... 280
Appendix 9: Table to show themes by participant ... 282
Appendix 10: Example illustrate the process of data analysis ... 283
Appendix 11: Information sheet (focus groups) ... 286
Appendix 12: Consent form (focus groups) ... 288
Appendix 13: Focus group guide ... 289
Appendix 14: Table to show themes by focus groups ... 290
Appendix 15: Example to illustrate the process of data analysis ... 291
Appendix 16: Information sheet (experiment one) ... 294
Appendix 17: Consent form (experiment one) ... 295
Appendix 18: Example diagnosis script (experiments one and two) ... 296
Appendix 20: Debrief sheet (experiment one) ... 298
Appendix 21: Information sheet (experiment two) ... 299
Appendix 22: Consent form (experiment two) ... 300
Appendix 23: Detailed and basic information (experiment two) ... 301
Appendix 24: Example questionnaire (experiment two) ... 303
1
List of tables, figures and boxes
Tables
Table 1 Participant characteristics – patients……….. p.99
Table 2 Participant characteristics – clinicians………. p.100
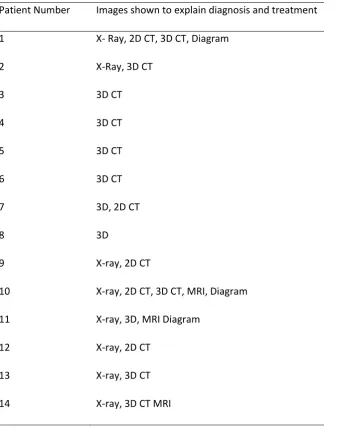
Table 3 Images shown to patients……… p.106
Table 4 Comparison of the three triads in which the clinician appears to underestimate
the impact of the image……… p.114
Table 5 Verbal dominance……… p.135
Table 6 Ratio of psychosocial to biomedical utterances for each consultation……….. p.137
Table 7 Ratio of doctor centred to patient centred utterances for each consultation……. p.138
Table 8 Comparing the biomedical and psychosocial content of doctor and patient
utterances……… p.139
Table 9 Verbal dominance during the discussion of the medical images……….. p.142
Table 10 Frequency of each image code within each consultation and percentage of
consultation discussing images……….. p.143
Table 11 Number of image related utterances and the RIAS codes they relate to……….. p.146
Table 12 Comparison of analysis with Levinson and Chaumeton (1999)………. p.148
Table 13 Reliability of coding………..……… p.150
Table 14 Participant characteristics – student focus groups……… p.164
Table 15 Participant characteristics – patient and public focus groups……… p.165
2
Table 17 Participant characteristics – Experiment One……… p.199
Table 18 Kurtosis, skewness and Kolmogorov – Smirnov test with Lilliefors correction for
the dependant variables – Experiment One………. p.201
Table 19 Results of repeated measures ANOVAs showing the overall difference in mean
ratings across the three image conditions……… p.203
Table 20 Results from individual t-tests for each significant independent variable………. p.206
Table 21 Results of repeated measures ANOVAs showing the overall difference in mean
ratings across the three image conditions, at follow up………. p.210
Table 22 Results from individual t-tests for each significant independent variable, at
follow up……….. p.211
Table 23 Comparison between experiment and follow up data……… p.213
Table 24 Participant characteristics – Experiment Two……….. p.220
Table 25 Kurtosis, skewness and Kolmogorov – Smirnov test with Lilliefors correction for
the dependant variables – Experiment Two………. p.221
Table 26 Results of repeated measures ANOVAs showing the overall difference in mean
ratings across the three image conditions……… p.223
Table 27 Results from individual t-tests for each significant independent variable………. p.224
Figures
Figure 1 Diagram of the four studies comprising this thesis……….. p.11
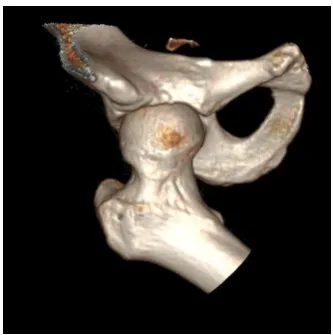
Figure 2 3D CT images of the hip from different angels………. p.27
3
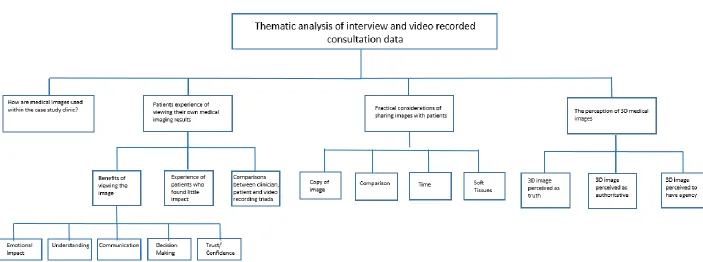
Figure 4 Diagram showing the four part of analysis………. p.102
Figure 5 3D CT image of the hemi-pelvis………..……… p.103
Figure 6 Coronal MRI of the hips and pelvis……….. p.103
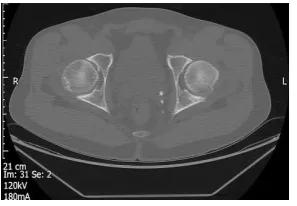
Figure 7 Axial CT image of the hips……….. p.104
Figure 8 X-ray of the hips and pelvis……… p.104
Figure 9 Diagram of the hip joint……… p.105
Figure 10 Diagram showing the four overall themes that emerged from the focus group
analysis……….. p.166
Figure 11 (a) Axial 2D CT image of the hips with SUFE, (b) coronal 2D CT image of the hips
with SUFE……… p.195
Figure 12 (a) Dorsal view of a 3D CT image of the hips with AN, (b) anterior view of a 3D
CT image of the hips with AN……… p.195
Figure 13 Mean ratings for each question in Experiment One depending on image
condition………. p.204
Figure 14 Mean ratings for each question in Experiment One depending on image
condition- follow-up……… p.209
Figure 15 3D image of the hips and pelvis with an image of monkey superimposed onto
the right femur……… p.217
Figure 16 Image of the monkey superimposed onto the 3D image of the hips…………..……… p.217
Figure 17 Mean understanding, perceived accuracy and trust scores for each image
4
Figure 18 Mean ratings by information type for each image condition……… p.225
Boxes
Box 1 An excerpt of a consultant explaining the image and diagnosis……….. p.144
Box 2 Discussion of medical images, where the clinician answers patients question
5
Acknowledgements
First, I am extremely grateful to the patients, clinicians and volunteers who participated in
this research and generously gave their time to share their experiences. I would like to thank the administrative staff and research nurses who assisted me with participant recruitment, the consultants who let me spend time observing their clinics and the staff in the radiology
department who introduced me to the different imaging techniques they use.
I would like to thank my supervisors, Professor Frances Griffiths, Dr Melina Kunar, Dr Richard Wellings and Professor Charles Hutchinson for their support, encouragement and guidance. I would also like to acknowledge Dr Harbinder Sandhu and Laura Vail for their guidance using
RIAS.
I would like to thank my family (especially Max, Claire, Scott and Bradley) and my fellow
students in the farmhouse for their love, support and patience during my studies.
6
Declaration
This thesis is submitted to the University of Warwick in support of my application for the
degree of Doctor of Philosophy. It has been composed by myself and has not been submitted in any previous application for any degree. The work presented (including data collection and data analysis) was carried out by the author.
Part of this thesis has been published by the author (reference below).
Phelps, E.E., Wellings, R., Griffiths, F., Hutchinson, C. and Kunar, M., 2016. Do medical images aid understanding and recall of medical information? An experimental study comparing the
7
List of abbreviations
2D Images Two-dimensional Medical Images
3D Images Three-dimensional Medical Images AN Avascular Necrosis
ANOVA Analysis of Variance
CAD Computer Aided Detection CT Computed Tomography
FAI Femoral Acetabular Impingement
FDA US Food and Drug Administration
IPDAS International Patient Decision Aids Standards MIPS Medical Interaction Process System
MDT Multidisciplinary Team Meeting
MOT Multiple Object Tracking MRI Magnetic Resonance Imaging
NICE National Institute of Health and Care Excellence NHS National Health Service
NMR Nuclear Magnetic Resonance
PET- CT Positron Emission Tomography – Computed Tomography RIAS Roter Interaction Analysis System
SUFE Slipped Upper Femoral Epiphysis
8
Abstract
Background: Patients can struggle to comprehend and recall medical information, hindering
their ability to participate in their own care. Research suggests that images may aid comprehension of medical information. Available for use in clinical practice, 3D medical images are relatively easy to interpret and could benefit lay people. However, little is known about patients’ experience of viewing them.
Aim: The aim was to understand the role of a patient’s own 3D image in a clinical
consultation. Four objectives were explored, to: (i) understand the impact for patients viewing their 3D image; (ii) understand how 3D images are incorporated into consultations; (iii) compare the experience of viewing 3D images, 2D images and no image alongside a diagnosis and (iv) understand whether informing participants of the occurrence of errors within image interpretation affects their trust in a diagnosis.
Methods: A multi-method approach was adopted. Fourteen patients and four clinicians from
a tertiary care orthopaedic outpatient clinic participated in semi-structured interviews and 10 clinical consultations were video-recorded. Additionally, 31 volunteers participated in focus groups and 252 volunteers participated in psychology laboratory experiments.
Results: Patients considered their 3D images to be evidence, describing them to be truthful
and authoritative. 3D images were used to explain diagnoses and treatments to patients during consultations. Participants showed better recall of the diagnosis when it was accompanied by 3D and 2D images compared to no image. Additionally, participants reported greater understanding and trust when the diagnosis was accompanied by 3D images compared to 2D images or no image. There was no significant difference in trust between participants who were informed of the potential for error within image interpretation and those who were not.
Conclusion: Patients trust 3D images, perceiving them to provide authoritative knowledge.
9
Introduction
__________________________________________________________________________
Preface
The nature of the ideal doctor- patient relationship has progressed from the paternalistic
model that was dominant thirty years ago (Kaba & Sooriakumaran, 2007). In many western countries, patients are increasingly encouraged to participate in their own care and make decisions about their treatment (Forster & Gabe, 2008). To achieve this, patients are
required to recall and comprehend the information they are given by healthcare professionals during their consultation (Selic et al., 2011). Their ability to do this can be impaired by a variety of factors including: the healthcare professional’s communication style (Wiener et al., 2013), their own educational level (McCarthy et al., 2012; Selic et al., 2011)
and by their levels of anxiety (Kessels, 2003; Shapiro et al., 1992). Strategies to improve patient understanding of medical information have been sought. The use of images (for example pictures, photographs and medical images) to accompany verbal or written medical
information is one strategy which has been adopted by some healthcare professionals. (Carlin et al., 2014; Gibbons et al., 2005; Houts et al., 2006; Shahab et al., 2007; Vilallonga et
al., 2012; Wiener et al., 2013).
Overall aim
The overall aim of this thesis was to understand the role of a patient’s own 3D image in a clinical consultation. A multi-method approach was used, comprising four separate studies.
Objectives
The research objectives are to:
10
consultations) and lay participants (volunteers who viewed 3D images while participating in focus groups). This objective aimed to learn:
a. Are there benefits for patients of viewing their own imaging results? b. Are there concerns about the practice of sharing images with patients? c. In which (if any) circumstances should images be shown to patients?
2) Understand how 3D images can be incorporated into patient centred consultations?
3) Compare the experience of viewing 3D images alongside a diagnosis to viewing 2D medical images (2D images) or no image alongside a diagnosis?
4) Understand whether informing participants of the occurrence of errors within image interpretation and the ability to manipulate medical images affects their trust in the diagnosis or how accurate they perceive the diagnosis to be.
Studies one and three will use qualitative methods to meet objective one. Study one will use
an orthopaedic outpatient clinic as a case study while study three will use lay participants to gain a wider perspective. Using predominantly quantitative methods, study two will seek to address the second research objective, again using data collected from an orthopaedic
outpatient clinic case study. Qualitative data will also be integrated with the quantitative results in study two to better understand the findings. Objectives three and four will be addressed through study four which will use lay participants as volunteers and adopt a
quantitative, experimental design. These research objectives will be broken down into research questions within the individual studies. The first three objectives were set out at the inception of the project. The fourth research objective was developed during the course of the project. This objective, as investigated in study four, was based upon the findings of
11
Structure of the thesis
This thesis has seven chapters presented in three parts. Part one (Chapters One and Two) presents the background to the thesis. Chapter One introduces the theoretical perspectives
that underpin the research and will introduce medical imaging to the reader. Chapter Two discusses relevant research literature to outline the rationale for the study. Part two (Chapters Three, Four, Five and Six) describes and discusses four research studies conducted for this research project. Each chapter in part two describes one research study and includes
background, method, results and discussion sections. Figure 1 demonstrates the relationship between the four studies comprising this thesis. Part three (Chapter Seven) syntheses the results of the four studies and discusses the relevance of the results to clinical practice.
[image:21.595.114.506.445.667.2]Chapter Seven also reflects on the strengths and limitations of the work undertaken for this thesis and indicates areas for future research. Research materials can be found in the Appendix at the end of the thesis.
Figure 1: A diagram to show how the four studies comprising this research project fit together.
Studies One and Two
• Orthopaedic Outpatient Case Study Clinic
• Interviews with patients and clinicians, non–participant observation and video-recorded consultations - analysed using thematic analysis
• Video-recorded consultations analysed using RIAS
• Data Collection: September 2014- June 2015
Study Three
• Focus Groups with public and patient groups
• Data Collection: April 2015 - June 2015
Study Four
• Two experiments with healthy volunteers
• Experiment 1 -Data Collection: October 2015 – December 2015
12
Studies one and two were conducted concurrently using the same orthopaedic outpatient clinic as a case study. Early analysis of interview data collected in study one revealed the
13
Part One
Chapter One: Background
__________________________________________________________________________
This chapter, comprising three sections, introduces the epistemological frameworks that underpin this research project. The reader will also be given an introduction to medical imaging which outlines different imaging techniques and their uses. This section will
conclude with reflections on the researcher’s time observing practices within a radiology department, multidisciplinary team meetings (MDT) and outpatient clinics.
1.1.
Epistemological position
This project comprising four separate studies draws on both qualitative and quantitative methods. Studies one and three adopt qualitative methodologies, specifically semi-
structured interviews, focus groups and observations, while studies two and four are primarily quantitative. Within study two, however, a mixed method approach will be included to integrate quantitative findings from study two with qualitative results from study
one. Due to differences in study design, two epistemological frameworks will underpin this thesis. For the qualitative aspects of the research (studies one and three), an interpretivist epistemology drawing upon elements of phenomenology will be taken, while the quantitative studies will be underpinned by a post-positivist standpoint. Epistemology, that
is the theory of knowledge, is concerned with what is knowledge and what can be known? These questions are crucial to social research and guide the methodologies adopted by researchers and their discussion of the results. Interpretive epistemology assumes that the
study of social objects and the social world differs from the study of the natural word and argues that this difference should be acknowledged through the application of different, appropriate theoretical perspectives and research methodologies (Bryman, 2012). Natural
14
generates rules and predictions that can be tested. In contrast, the application of predictions and rules to human behaviour is argued by interpretivists to be inappropriate as individuals
frequently deviate from expectation and are not governed by an ‘external force’ (Bryman, 2012 p.30). As a result of this, interpretivists seek to understand human behaviour and social reality rather than focusing on explaining it. A post-positivist approach, in contrast to
interpretivism, seeks to explain social reality but acknowledges that only a partially objective account of the world can be achieved. These two epistemologies were chosen (interpretivism and post-positivism) as the nature of knowledge generated by these approaches will most readily address the research questions. Interpretivism and post- positivism positions will now
be discussed in turn.
1.1.1. Interpretive epistemology
Interpretive epistemology seeks to understand individual accounts of the social world,
believing that there are multiple subjective realities constructed by the individuals that interact with and exist within it. These realities reflect individual experiences and an individual’s understanding of their experience. (Stayt, 2012) Interpretivists propose that within the social world a given phenomenon cannot be explained through one truth; instead,
there are multiple truths through which a phenomenon is understood. Interpretivists argue that it is inappropriate to apply rules and predictions to human behaviour as individuals often deviate from expectations. This is in contrast to a positivist position, which is frequently applied to the study of the natural world and focuses on generating rules and predictions to
explain rather than understand phenomena.
As this research sought to understand both patients’ individual experiences of viewing their own 3D images and healthy participants’ experiences of viewing medical images, an
15
experiences and allowed participants to describe their experiences and beliefs about medical
images in their own words (Neuman, 2003).
For patients recruited to study one, viewing their own individualised medical images was a personal experience, significant to them and it is unlikely that all patients would experience viewing their own images in the same way. For this reason, gaining subjective, individual
accounts is important.
Interpretivist epistemology is particularly valuable to exploratory research such as this study. At present, little is known about patients’ experiences of viewing their own 3D images. It would therefore be inappropriate to attempt to explain or predict patients’ responses using
quantitative methods. Quantitative methods are likely to ignore aspects of a patient’s experience not considered by the researcher and could hinder the researcher’s ability to understand the patients experience in depth. Gaining insight into the subjective experience of participants is an advantage of the methods associated with interpretative epistemology.
Concepts drawn from subjective accounts can be used to further study of the phenomena. For example, interpretative interviews could highlight common concerns that individuals may experience. These concerns could be further investigated through a deductive, possibly
quantitative study to gain greater knowledge of the frequency in which they occur and if they continue to occur in differing populations.
This research adopts a Heideggerian phenomenological perspective. Phenomenology,
established by Edmund Husserl (1859-1939), is interested in peoples understanding of their lives and their social interactions and the meanings that they attribute to them (Burke Draucker, 1999; Rapport, 2005). Heidegger furthered existing thought on phenomenology
16
Heidegger argues that much of everyday life does not require conscious awareness and is instead reliant upon practiced skills and knowledge of the world (Crotty, 1998). Through
knowledge of our social world and by using the skills learnt over time, actions are performed in everyday life without conscious awareness (Crotty, 1998). Heideggerian phenomenology focuses on being and the experience of being within the social world (Burke Draucker, 1999).
Individuals are required to adapt constantly to changes in their environment and may be required to find new meanings in their world (Burke Draucker, 1999).
Heideggerian phenomenology also argues that humans are inseparable from the social world as their experiences take place within it (Burke Draucker, 1999). Researchers are part of the
social world and have their own history and knowledge of it (Crotty, 1998). Therefore when studying the social world they are unable to detach themselves from it as they cannot detach themselves from their own experience or history (Ferguson, 2006). As a result of this,
Heideggerian phenomenology acknowledges the researcher’s presuppositions, with data collected using this approach reflecting the researcher’s interpretation of the participants’ interpretation (Inglis & Thorpe, 2012). The goal of Heideggerian phenomenology is to produce an understanding of the phenomena based upon a convergence of ideas. This
includes placing the participants’ interpretation of their experience within the context of existing literature within the field and the preconceptions and knowledge of the researcher
(Inglis & Thorpe, 2012).
A Heideggerian phenomenological approach was selected for this study. This was because the notion of being, particularly in a changing world, is important to the lives of patients. Patients often experience some degree of change because of their symptoms or diagnosis. Their world and their role within it could change considerably because of their condition and
17
unknown. The emphasis on being and historicity is important to this study as the meaning that participants reveal is likely to reflect a snapshot of their reality and reflect their
interpretation of their situation at a unique but also significant time. Furthermore, the acknowledgement by Heideggerian phenomenology that individuals, including researchers, are unable to separate themselves from their social world is important. Within this study,
the researcher’s past experience could result in preconceptions. These experiences, for example, include previous research experience addressing health behaviour; personal experience of health services; academic study; knowledge of the existing research literature within the area and extensive observations in a radiology department and outpatient clinics.
These experiences all contribute to preconceptions and ideas that may influence the interpretation of the data.
Reflection on the researcher’s own bias is an important aspect of Heideggerian
phenomenology. While conducting the research the researcher is continuing to participate in the social world and is interacting with participants. The researcher is also unable to remove themselves from their history and experience while analysing data. Transparency and reflexivity within the research process are ways in which the challenges associated with
bias introduced by the researcher can be managed (Burke Draucker, 1999).
Phenomenology, along with most other theoretical perspectives and methodologies underpinned by interpretive epistemology, focuses on individuality and subjective
understandings of a phenomena rather than seeking generalisable findings and conclusions. Researchers should not seek to draw conclusions that they can generalise to other populations but instead use the data to examine common meanings that individuals attribute to the phenomena they encounter. These meanings can be used as a guide for
18
what they think they are measuring and if they measured it again would they generate the same results? (Bryman, 2012). Validity and reliability are inappropriate criteria to evaluate
qualitative work, underpinned by interpretivist epistemology. Therefore, alternative tools have been proposed (Bryman, 2012). Yardley’s (2000) criteria include consideration of four factors: sensitivity to context, commitment and rigour, transparency and coherence, and
impact and importance (Yardley, 2000). These criteria will be discussed in relation to the qualitative findings of this research project in Chapter Seven.
1.1.2. Post-positivism
Post positivism rose to prominence in the 1970s, challenging some of the criticism faced by
the positivist epistemological paradigm (O'Reilly & Kiyimba, 2015). Post-positivism, in a sense, begins to bridge the gap between positivist and interpretivist epistemologies and is appropriate for use with qualitative as well as quantitative research methods (Clark, 1998).
Positivism and post-positivism favour empirical methods including the manipulation of variables, experimental designs and statistical analysis where the researcher and the object of study tend to be detached (Corbetta, 2003). Post-positivism, however, does not consider the researcher and their perceptions to be completely detached, recognising the
researcher’s personal involvement and the interpretative nature of research processes (Corbetta, 2003).
Similar to positivism, post-positivism proposes that there is one singular reality – a world that
exists independently of our awareness of it. However, unlike positivism, post-positivism claims that the whole reality or the truth can never really be captured (Kennedy & Lingard, 2006). Through research, the truth can be approached but not proven. The existence of
19
Post-positivists emphasise the notion of falsification and the provisional nature of scientific theory (O'Reilly & Kiyimba, 2015). They highlight that research has been proven false,
demonstrating that the results from empirical research cannot be an absolute truth (O'Reilly & Kiyimba, 2015). Post-positivists argue that data cannot positively confirm a theory. Instead, researchers should seek to falsify hypotheses, with post-positivists claiming that if a
hypothesis withstands multiple attempts at falsification then the results can be interpreted with confidence (O'Reilly & Kiyimba, 2015).
A post-positivist approach was deemed most appropriate for studies two and four. Studies two and four sought to test hypotheses about the content of orthopaedic clinical
consultations and the experience of viewing medical images in a simulated clinical consultation, respectively. Study four sought to falsify the null hypotheses, acknowledging that the alternative hypothesis cannot be proven nor an absolute truth discovered. This epistemological position was also favoured due to its recognition of the researcher’s
interpretation within the research process. For example, in designing the studies, collecting, and analysing the data, the researcher may be influenced by their existing knowledge.
1.2.
An introduction to medical imaging
Since the discovery of X-rays by Wilhelm Rontgen in November 1895, Radiology has become
one of the most valuable tools for diagnosing disease or injury and planning and evaluating treatments (Porter, 1997). Vast technological and IT developments have led to increasingly advanced methods of imaging including: Computerised Tomography (CT); Magnetic
Resonance Imaging (MRI) and Positron Emission Tomography- Computerised Tomography (PET-CT) (McRobbie et al., 2007). From these developments the potential to generate 3D images creating an extremely detailed representation of the human body, depicting organs, bones, tissue and vessels and how they intertwine and relate to one another has emerged
20
modalities: X-ray, CT, MRI, Ultrasound and Endoscopic imaging; along with their uses before introducing 3D images.
1.2.1. X-Ray
Rontgen’s accidental discovery of X-rays occurred whilst he was testing cathode rays in a darkened room. He observed that the cardboard tube containing the cathode ray projected a faint green colour onto his fluorescent screen, which could pass through a variety of
materials and was only completely barred by lead. When experimenting to see whether the rays could pass through lead he saw the shadow of his hand with his bones visible on the
screen (Porter, 1997).
The introduction of X-rays was met with eagerness and interest, with the potential for use within medicine quickly explored (Porter, 1997). The first clinical radiograph was taken in January 1896, just a few months after Rontgen’s discovery (Porter, 1997). X-rays were initially used to look at bones and diagnose fractures but their utility soon increased and they
quickly became tools for diagnosing gallstones and locating foreign bodies (Porter, 1997). Today, their use is still widespread with over 22.6 million X-ray examinations taken in the United Kingdom in the year 2012- 2013 (Office for National Statistics, 2013). Their use today
includes examining bone growth, fractures and breaks; identifying osteoporosis by inspecting the thinning and weakening of bones; identifying bone infections and bone cancers as well as aiding diagnosis of heart and lung conditions (National Health Service,
2013b).
Traditional X-rays using X-ray sensitive films produce only 2D images. X-rays capture internal structures by measuring density. These measurements are then mapped to create an image
21
body they are passing through. A camera records the absorption rate of all the photons that pass all the way through the body (National Health Service, 2013b). Hard materials such as
bones absorb photons well in comparison to soft tissues that do not absorb X-ray photons well. These soft materials appear black or grey on the image generated from the X-ray data whilst denser materials appear white (National Health Service, 2013b).
1.2.2. Computed Tomography (CT)
In 1971, the first CT scan used in clinical practice was taken to image the brain (Duffin, 2000). A CT scanner, developed in the late 1960s by Sir Godfrey Hounsfield, is a machine that is used to create a detailed representation of a specific area of the body by taking numerous X-rays
of different cross sections (McRobbie et al., 2007). The individual X-ray images are often referred to as slices of the body, which when stacked together can provided an extremely detailed picture. Advances in technology have allowed the option of extremely thin slices
measuring 2mm (Banerjee, 2006). This can aid detection of abnormalities that are exceptionally small or are in locations that could be easily hidden in a larger slice. The CT scanners offer higher contrast and greater detail, particularly of structures within the body such as bones, blood vessels and tumours, than any existing forms of imaging (National
Health Service, 2013c). CT, widely used today, is a fundamental tool for the diagnosis of many conditions (National Health Service, 2013c).
CT scans are used routinely to examine and detect a range of abnormalities. CT scans are
frequently used to examine the head and brain, abdomen, bones and vascular system. They are also used extensively within oncology (National Health Service, 2013c). Head scans are used to examine the brain for bleeding or swelling; to check for suspected tumours and to study the brain after a stroke (National Health Service, 2013c). Abdominal CT scans can be
22
abdominal CT scans are used to look for internal bleeding or injury after a trauma. Bone CT scans allow examination of injuries or disease to the bones, particularly the spine, whilst
vascular CT scans aid the assessment of blood flow within the body (National Health Service, 2013c). Within oncology, CT scans are used for diagnosis, treatment planning and evaluation and follow up (National Cancer Institute, 2013). Within diagnosis, CT scans are used to detect
the growth of abnormal cells; to diagnose the presence of a tumour and to provide information that aids the staging of tumours. CT scans used to aid treatments within oncology can guide where to perform interventions such as biopsies; guide local treatments, such as cryotherapy, and can inform surgical planning and radiation therapy. CT scans are
also used to evaluate treatments by monitoring whether the cancer has responded to treatment and within patient follow up they are used to detect the recurrence of tumours. Additionally, CT scans have been found to be effective in screening for certain cancers
including lung and colorectal cancers (National Cancer Institute, 2013).
CT exams tend to be short, usually lasting between the length of a breath hold and no longer than ten minutes, depending on the areas of the body being studied (National Health Service, 2013c). This is imperative for trauma patients who are often unable to lie in a scanner for a
greater period without needing medical attention or have injuries so severe that information must be generated extremely quickly. This can also be of benefit to other patients as well, as the majority of medical imaging tests require the patient to remain as still as possible to prevent the images from becoming blurred. This can be uncomfortable or difficult for
pro-longed periods.
Both X-rays and CT use small amounts of ionising radiation. Exposure to radiation can cause damage to cells and slightly increase cancer risk (National Health Service, 2013a). People are
23
expose patients to more radiation than the majority of other imaging tests. The amount of radiation varies depending on the type of test required. A whole body scan, for example,
exposes the body to an amount of radiation that is equivalent to four and a half years of background radiation (National Health Service, 2013a). Due to the exposure of radiation from the X-rays, pregnant women and children are only referred for CT scans in extreme
cases. This is because children are at increased risk of radiation build up and because radiation could cause harm to the foetus (National Health Service, 2013a). Before being referred for a CT scan, the referring clinician will considered the potential benefits in relation to the possible risk and the staff within the X-ray department will review the request.
Although the exposure to radiation does pose some risk to patients, the benefits of being able to detect and diagnose a condition in symptomatic patients will usually outweigh this greatly (National Health Service, 2013a).
1.2.3. Magnetic Resonance Imaging (MRI)
MRI is frequently portrayed as the “gold standard” imaging technique, fundamental for truthful diagnosis (Joyce, 2008). It provides greater contrast between tissues than other
imaging methods such as X-ray and ultrasound (McRobbie et al., 2007)
MRI creates images that reflect the activity of hydrogen atoms within the body, which are altered by using magnetic fields and radio waves. Radio waves are transmitted through the body and are absorbed by the nuclei of hydrogen atoms. This causes them to rotate and align
with the magnetic field. The new positions of the atoms are recorded along with their relaxation time - the time taken for the atoms to realign to their original positions (National Health Service, 2013d). As they realign the atoms release a radio signal of their own. A large proportion of tissues within the body are made up of at least 70% water (McRobbie et al..,
24
altered too. MRI is therefore a very sensitive method of detecting diseased tissues
(McRobbie et al., 2007).
Nuclear Magnetic Resonance (NMR), as MRI was previously labelled, emerged in the 1930s. Isidor Rabi observed and explained how the different atoms rotated when subjected to magnetic fields (Bharath, 2009). NMR was initially used within chemistry to examine the structures of different molecules but was soon applied to medical diagnosis after Raymond
Vahan Damadian observed that non-cancerous and cancerous tissues can be identified based on their relaxation times (Joyce, 2008). The technique was introduced into clinical practice in the 1970s with the first full body scan taken in 1977 (Bharath, 2009). Soon after, the name
was changed from NMR to MRI. This was due to the strong negative connotations of the word ‘nuclear’ that made the public wary of the technique (Joyce, 2008).
MRI is used to examine the brain and the spinal cord; the heart and blood vessels; internal organs; bones and joints and the unborn foetus in pregnancy (National Health Service,
2013d). MRI can be used to study the entire body or to focus on an extremely specific area. The use of MRI is continuing to expand. Not only is MRI a widely used tool for diagnosis, it is becoming increasingly used: in surgical planning; to guide interventions and to plan and
monitor treatments such as radiotherapy and chemotherapy (National Health Service, 2013d). The value of MRI as an alternative to autopsy is also being explored as the utility of the technology is furthered.
1.2.4. Ultrasound
In the 1950s ultrasound was developed for use within medicine. It was based on Sound Navigation and Ranging (SONAR) techniques used during World War Two for navigation,
25
safe, non-invasive method of imaging. This is due to the use of sound waves as opposed to ionising radiation (McRobbie et al., 2007). Ultrasound images can be presented in real-time
and can demonstrate movement such as blood flow (McRobbie et al., 2007).
Ultrasound has a variety of uses including examination of the kidney, liver, abdomen and heart. Ultrasound of the heart can be used to study blood flow and examine the structure of the heart’s vessels and chambers (National Health Service, 2014b). Ultrasound is also used
during procedures as it can produce real -time images, allowing the clinician performing the procedure to see, through the ultrasound image, the results of their actions and the location of their instruments within the patient. Ultrasound can be used to guide minimally invasive
procedures. One example is ultrasound guided lung biopsy, where a small sample of cells is taken from a tumour for further examination under microscope (Cancer Research UK, 2014). During this procedure, a needle is inserted through the skin and muscle in the chest to the
lung and a small sample of cells removed with a syringe. Ultrasound images are used to ensure the location of the tip of the needle is accurate and inserted into the tumour (Cancer Research UK, 2014). Ultrasound of the foetus during pregnancy (foetal ultrasound as referred to from here on) is offered routinely, with most women offered two scans (National Health
Service, 2014b). The first is offered between eight and 14 weeks, and is a dating scan used to confirm and date the pregnancy, giving expectant mothers an estimated due date. The second routine scan during pregnancy is usually offered between 18 and 21 weeks and is used to check for structural abnormalities with particular focus on monitoring the
development of the head and spine (National Health Service, 2014b). Routinely, 2D ultrasound images are used but 3D and 4D foetal ultrasound images are available privately (Birmingham Women's NHS Foundation Trust, 2014; Imperial College Healthcare NHS Trust,
26
In addition to the medical reasons for foetal ultrasound scans, they also have social use. During the second routine scan, expectant parents can ask to find out the sex of their baby,
depending on its position in womb (National Health Service, 2014b). Foetal ultrasound scans are also argued to promote bonding between the expectant parents and the foetus, with many hospitals giving expectant parents the opportunity to take home a copy of their
ultrasound images (Ji et al., 2005; Roberts, 2012). Support and concerns regarding the use of ultrasound as a tool to promote bonding will be discussed further in Chapter Two, Section Two.
1.2.5. Endoscopic imaging
The imaging techniques described above are all generally non-invasive, with images generated from numerical data. Endoscopic images, on the other hand, are images of inside the human body taken with a camera (National Health Service, 2014c). An endoscope, a thin
and flexible tube with a light source and camera at one end, can be used to aid diagnosis and laparoscopic surgery (National Health Service, 2014c). The endoscope is inserted into the body through either the mouth, anus or through a small incision. Endoscopy can be used to examine a range of organs within the body including: the womb, referred to as hysteroscopy;
the joints, referred to as arthroscopy and the large intestine, referred to as colonoscopy (National Health Service, 2014c). During the procedure, tissues can be removed. For example, polyps - precancerous or benign growths - can be removed from the large intestine during colonoscopy (National Institute for Health and Care Excellence, 2005). Endoscopy can
also be used help perform laparoscopic surgery such as an appendectomy. This allows large incisions to be avoided and reduces scarring and recovery times (National Health Service,
27 1.2.6. 3D imaging
Digitalisation has enabled the development of 3D images. Machines now have the ability to
take hundreds and potentially thousands of images during one examination. Images, which were previously immutable once recorded, can now be changed and enhanced. They can be presented in colour and motion and can be manipulated to create 3D displays. 3D images
are created by using the digital data of the image to, in a sense build up many 2D grey scale images. Identifying organs and normal structures in 2D grey scale images tend to be difficult for lay people without specialist radiology training. To the untrained eye, the properties of abnormalities often appear to closely resemble the properties of normal tissues (Harvard
Medical School, 2014). 3D images, on the other hand, are more easily interpreted and could therefore be of benefit to both lay people and clinicians who have not specialised in radiology. They enable the viewer to visualise the relationships between different structures
more easily and can be rotated to view the area of interest from different angles (as shown through the 3D CT images of a hip in Figure 2) This allows the viewer to gain a clearer picture of the desired area (Brigham and Women's Hospital, 2014a).
28
3D images can be built up in a variety of ways to include different amounts of information. For example, the tissues surrounding an organ or blood vessels can be removed to allow the
structure of interest to be more easily visualised (Harvard Medical School, 2014). This is demonstrated in Figure 3 below; with the image to the left displaying the heart and the image to the right displaying the coronary arties with the heart tissues removed.
Figure 3: Still images from 3D video clips of the heart and blood vessels
3D images are availably publically, both online and through the media, and have potential for a wide range of use within medicine. 3D can be utilised within diagnostic radiology to aid the detection of abnormalities. When interpreting 2D images, radiologists scroll through stacks of 2D images, creating an internal 3D representation within their mind. 3D images can
be used alongside 2D stacks of images. Rotation of 3D images for example can allow a suspicious tissue and the structures that surround it to be examined from more than one angle. Visualisation of the surrounding tissues and the relationship between a suspicious
tissue and surrounding tissues can help decision-making.
In addition to these uses, 3D images are being implemented within screening. 3D mammography, known as digital breast tomosynthesis, has recently been introduced at the Brigham and Women’s hospital in Boston (Brigham and Women's Hospital, 2014b). The
29
3D mammography may improve cancer detection by approximately 10% compared to 2D mammography and may reduce the number of callbacks by 30-40% (Brigham and Women's
Hospital, 2014b). Virtual (CT) colonoscopy, using 3D CT images to create a detailed representation of the colon, has been approved by the National Institute for Health and Care Excellence (NICE) as an alternative to conventional colonoscopy or barium enema (National
Institute for Health and Care Excellence, 2005). Colonoscopy, barium enema and virtual colonoscopy, are used to detect abnormalities such as polyps and cancer in symptomatic patients or asymptomatic patients who are considered to be at high risk of colorectal cancer. They can also be used to screen asymptomatic patients with average risk of developing
colorectal cancer (National Institute for Health and Care Excellence, 2005). Virtual colonoscopy may be preferable to some patients as sedation is not required and the procedure is more comfortable and quicker (Bupa, 2014). A virtual colonoscopy is less
invasive than a conventional colonoscopy as the images are created using digital data from CT scans. The digital data can be presented as still images or as a fly-through ‘stereoscopic’ video clip, similarly to the images gained through conventional colonoscopy (National
Institute for Health and Care Excellence, 2005).
Subtle changes in size, shape and volume of an abnormality can be visualised clearly using 3D images (Harvard Medical School, 2014). This can be used to monitor disease progression and evaluate treatment effectiveness. An example of this could be to compare tumours
before and during chemotherapy to see if the tumour is responding to the treatment.
They can also be used to aid treatment or surgical planning, particularly neurosurgery (Harvard Medical School, 2014). Surgeons can use 3D images to see the exact location of the abnormality in relation to surrounding blood vessels. Relationships can be more clearly
30
where applicable surgeons can use the 3D images to plan the approach they will use, bearing in mind the location of blood vessels and other structures. It is expected that the increasing
use of minimally invasive procedures will be accompanied by a growing demand from surgeons for 3D images (Harvard Medical School, 2014).
There are however, some limitations to 3D image production. For hard tissues (i.e. bones), 3D images are relatively easy to produce. For soft tissues (such as blood vessels) on the other
hand, contrast (i.e. a dye) may be required to produce 3D images. Additionally, if different tissues have similar density it can be difficult to separate them.
Not all 3D images will be useful for clinical decision-making but they may be useful to other
audiences. At the University of Monash in Australia, the use of 3D images within medical education is currently being explored (Hare, 2013). It has been suggested that they could be used to teach anatomy and can be printed with a 3D printer to make anatomical structures. 3D printing of anatomical structures has developed to allow printing of a structure that
includes tendons and tissues as well as bones (Hare, 2013). The development of 3D printed structures could bring several advantages. Firstly, they are relatively cheap to produce and could be beneficial to universities and hospitals in remote areas or developing countries
(Hare, 2013). They could also be beneficial in some Asian countries where the use of human tissue is frowned upon (Hare, 2013). A further advantage of 3D printed anatomical structures is their availability. Students could have much more time with the printed structures than
they would get with a human specimen and several structures based on the same imaging data can be produced. Finally, there are fewer ethical issues associated with 3D printed structures than the use of cadavers (Hare, 2013).
31
specialist radiology training (Harvard Medical School, 2014). They are also helpful as radiologists and referring clinicians cannot always communicate face to face. The
accompaniment of a 3D image, along with the radiologist’s written interpretation of the 2D images, may help the clinician to better see and understand the interpretation. 3D images can also be used to communicate information to patients. They are used during orthopaedic
outpatient consultations at University Hospital Coventry and Warwickshire (UHCW) (R. Wellings, personal communication, November 12 2013). Within Orthopaedics, along with several other specialities, the demand for 3D images is increasing. 3D images enable
orthopaedic clinicians to better visualise fractures or bones that could cause impingement.
One hip clinic at UHCW uses 3D images to discuss diagnosis and treatment with patients (as observed by E. Phelps, December 20 2013). Patients attending this clinic often suffer from Femoral Acetabular Impingement (FAI) or hip dysplasia.
1.3.
Reflections on observations in a radiology department and outpatient
clinics
I undertook observations in a large teaching hospital at the start of this research project.
Having only limited experience of the NHS from a patient’s perspective, these observations allowed me to access everyday practices within a radiology department and outpatient clinics that I would not have otherwise been aware. These observations, therefore, were
valuable in informing the study design. This section will highlight practices that I considered most noteworthy during the observations.
1.3.1. Radiology department
Within the radiology department, half a day was spent observing the following imaging
modalities: X-rays, CTs, MRIs, Ultrasounds and PET-CTs. Half a day was also spent observing image interpretation and learning how to generate 3D images from the digital data from CT
32
One thing most notable to me was how still patients were required to lie during their scans, particularly during CT and MRI scans. Stillness was required to produce clear images and was
a challenge for some patients. On two occasions, language was a barrier to patients’ understanding of the instructions for their scan. For example during a CT scan, patients were required to breathe in and out when instructed to by a radiographer, who gave instructions
via a microphone from the next room. One patient was unable to understand these instructions, which made the scan difficult. Similarly, during an x-ray of the knee a patient whose first language was not English found it difficult to understand the position their knee should be in for the scan. While observing ultrasound guided biopsies, I noticed an additional
challenge for clinicians. This was the only scan I observed where patients, the clinician and the image were all present together with the patient and clinician both able to see the image during the procedure. The clinician therefore had to be aware of how they responded to
what they saw on the image so not to cause any distress to the patient. During all other imaging modalities that I observed, patients did not see their image or speak to a radiologist who could interpret their image.
1.3.2. Outpatient clinics
Several outpatient clinics were observed, specifically a cardiology clinic, a colorectal cancer clinic, and three orthopaedic clinics (a hip clinic, a knee clinic and a shoulder and elbow clinic). The focus of these observations was communication between patient and clinician, which I found to vary across the clinics. In some clinics, issues with communication were observed.
For example, in two clinics, clinicians appeared to avoid answering difficult questions asked by patients. In contrast, clinicians consulting with patients in the hip clinic spoke slowly and clearly and explained everything to patients throughout the consultation (for example
33
images with patients as computers, which images are usually viewed on, were separate to the cubicles in which the patients met the clinician. However, some patients in this clinic
were shown a model of the knee. In one clinic (the colorectal cancer clinic) diagrams were shown to patients, in two clinics (the cardiology and shoulder and elbow clinics) patients were shown 2D images and in one clinic (the hip clinic) patients were shown 2D and/or 3D
images. Consultations in the colorectal cancer clinic were much shorter than consultations in the other four clinics. During one clinic session (typically half a day) for example, two clinicians had a list of approximately thirty patients to see between them. This is in contrast to the hip clinic, in which two clinicians had a list of twelve patients to see between them.
The consultations in the colorectal cancer clinic typically felt more rushed. More time was made available, however, for bad news consultations within the clinic.
1.3.3. MDTs
I observed two colorectal cancer MDTs and multiple MDTs with the hip clinic. This gave me a better understanding of how diagnosis and treatment plans are reached. Clinicians presented a background including information from their patient history and physical examinations about each patient to the rest of the team before medical images were viewed
and discussed.
1.4.
Chapter Summary
This chapter has outlined the epistemological position underpinning this research; introduced a selection of medical imaging techniques and provided the researcher’s