warwick.ac.uk/lib-publications
A Thesis Submitted for the Degree of PhD at the University of Warwick
Permanent WRAP URL:
http://wrap.warwick.ac.uk/90717
Copyright and reuse:
This thesis is made available online and is protected by original copyright.
Please scroll down to view the document itself.
Please refer to the repository record for this item for information to help you to cite it.
Our policy information is available from the repository home page.
Quantifying the touch feel perception:
Tribological Aspects
by
Hui Niu
Thesis
Submitted to the University of Warwick
in partial fulfilment of the requirements
for admission to the degree of
Doctor of Philosophy
School of Engineering,
University of Warwick
Supervisor
Dr. Xianping Liu
School of Engineering, University
of Warwick, U.K.
Examiners
Dr. Marc Masen (external)
Faculty of Engineering, Department of Mechanical Engineering,
Imper-ial College London, U.K.
Dr. Ken Mao (internal)
School of Engineering, University
of Warwick, U.K.
Contents
List of Figures viii
List of Tables xv
Acknowledgements xvii
List of Publications Arising from this Research xix
Declarations xx
Abstract xxi
1 Introduction 1
1.1 Background . . . 1
1.2 The objective and the outline of the thesis . . . 5
1.2.1 The objective of the thesis. . . 5
1.2.2 Outlines of the thesis. . . 5
1.3 Contributions . . . 7
2 Literature Review 9 2.1 Human skin friction mechanism . . . 9
2.2 Artificial finger . . . 14
2.3 Friction theory and measurement . . . 17
2.4 Relationship analysis between friction and surface physical parameters 21 2.5 Correlation study between touch-feel perception and surface properties 23 2.6 Summary . . . 26
3 Instrument Design 28 3.1 Introduction. . . 28
3.2 Design of friction test rig . . . 29
3.2.1 Construction of the multilayer artificial fingertip . . . 30
3.2.2 Fingerprint imprint on the artificial finger . . . 32
3.2.3 Friction test rig . . . 33
3.3 Calibration and testing of the friction measurement apparatus. . . . 36
3.3.1 Calibration of the flexure . . . 36
3.3.2 Calibration of the capacitive sensor and the load cell . . . 36
3.3.3 Testing the friction measurement apparatus . . . 37
3.4 Friction measurement of metal samples. . . 44
3.4.1 Topography measurements . . . 44
3.4.2 Friction measurement results and analysis . . . 47
3.4.3 Influence of material roughness . . . 54
3.4.4 Influence of the fingerprint . . . 56
3.4.5 Influence of normal force. . . 56
3.4.6 Influence of stroking/sliding speed . . . 61
3.5 Conclusion . . . 62
4 Measurement and Theoretical Analysis of Contact Area 64 4.1 Introduction. . . 64
4.2 Contact Mechanics theories . . . 65
4.2.1 Human skin friction coefficient . . . 65
4.2.2 Hertz contact model . . . 67
4.2.3 Johnson-Kendall-Roberts (JKR) contact model . . . 69
4.2.4 Greenwood-Williamson contact theory . . . 71
4.2.5 Kotwal-Bhushan contact theory for non-Gaussian surfaces . . 73
4.2.6 Persson contact theory. . . 74
4.3 Measuring the Young’s modulus of the artificial fingertip . . . 77
4.3.1 Theory of micro-indentation. . . 78
4.3.2 Nano-indentation . . . 80
4.3.3 Nano-indentation results with different indenters . . . 85
4.4 Contact area measurement. . . 88
4.4.1 Instrument Design . . . 88
4.4.2 Methodology . . . 90
4.5 Results and Analysis . . . 91
4.5.1 Measurement Results . . . 91
4.5.2 Hertz contact theory, JKR contact theory and finite element modelling . . . 93
4.6 Conclusion . . . 98
5 Friction and Young’s Modulus Measurement of Thermoplastic
Ma-terials 99
5.1 Introduction. . . 100
5.2 Surface topography measurement of thermoplastic Materials . . . . 102
5.2.1 Coated polymer samples . . . 102
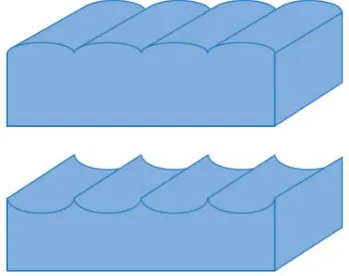
5.2.2 Patterned polymer samples . . . 103
5.2.3 Summary . . . 108
5.3 Nano-indentation of the Thermoplastic Materials . . . 108
5.3.1 Nano-indentation of coating polymer samples . . . 110
5.3.2 Nano-indentation of patterned polymer samples. . . 115
5.3.3 Comparison with TPM measurements . . . 115
5.4 Friction measurement of thermoplastic materials . . . 116
5.4.1 Friction measurement of coated polymer samples . . . 117
5.4.2 Friction measurement of patterned polymer samples . . . 118
5.5 Conclusion . . . 122
6 Relationship between Friction and Surface Parameters 125 6.1 Spearman’s Rank correlation analysis . . . 126
6.1.1 Correlation analysis for the metal samples . . . 126
6.1.2 Correlation analysis for the polymer samples . . . 128
6.2 Surface height distributions . . . 130
6.3 The relationships between the friction coefficient, Sq and Sm . . . . 130
6.3.1 Theoretical deduction of the relationships . . . 133
6.3.2 Correlation of theory and experiment for aluminium and steel samples . . . 135
6.3.3 Correlation of theory and experiment for thermoplastic Samples137 6.4 The influence of Young’s modulus to contact area and friction coeffi-cient analysis . . . 139
6.4.1 Simulation of the Greenwood-Williamson Model . . . 139
6.4.2 The correlation analysis results . . . 142
6.5 The relationship analysis between friction,Ssk and Sku . . . 143
6.5.1 The theoretical analysis . . . 144
6.5.2 The real contact area analysis. . . 147
6.6 The relationship between surface friction and the surface slope (Rda, Sdq)147 6.7 Conclusion . . . 150
7 Modelling Touch-feel Perception 153
7.1 Introduction. . . 154
7.2 Touch-feel perception ranking measurement . . . 155
7.3 Literature review on correlation methods . . . 156
7.3.1 Linear regression and partial correlation . . . 156
7.3.2 Kendall’s W test, Wilcoxon signed-rank test and Spearman’s rank correlation analysis . . . 157
7.3.3 Factor Analysis and PCA . . . 158
7.3.4 Summary . . . 160
7.4 Rank ordered logit modelling Analysis . . . 160
7.5 Analysis of the touch-feel perception data . . . 162
7.5.1 Smooth/rough . . . 163
7.5.2 Soft/hard . . . 165
7.5.3 Cool/warm . . . 166
7.5.4 Slippery/sticky . . . 168
7.5.5 Like/dislike . . . 169
7.6 Conclusions . . . 170
8 Conclusion 172 8.1 Conclusion . . . 172
8.1.1 The friction test apparatus with an artificial fingertip for touch-feel studies . . . 172
8.1.2 The theoretical modelling for the contact between the artificial fingertip and the surfaces . . . 174
8.1.3 The thermoplastic materials properties identification . . . 174
8.1.4 Correlation analysis for touch-feel perception . . . 175
8.2 Research limitations . . . 175
8.2.1 Limitations of instrumentation . . . 176
8.2.2 Case study limitations . . . 176
References 178 A Appendices 193 A.1 Design of the friction measurement apparatus . . . 193
A.2 Stiffness estimation of the flexure in the friction apparatus . . . 198
A.2.1 Theoretical calculation . . . 198
A.2.2 Experimental calculation . . . 201
A.3 Contact area measurement experiments . . . 201
A.4 Surface topography measured by Bruker . . . 204
A.4.1 Metal Samples . . . 204
A.4.2 Thermoplastic Samples . . . 211
A.5 The height distribution of different surfaces . . . 215
A.6 Touch-feel ranking raw data . . . 224
A.7 Rank ordered logit model outputs. . . 228
A.7.1 Smooth/rough . . . 229
A.7.2 Soft/hard . . . 231
A.7.3 Cool/warm . . . 233
A.7.4 Slippery/sticky . . . 235
A.7.5 Like/dislike . . . 237
A.8 MATLAB program code to simulate a Greenwood-Williamson contact model . . . 239
List of Figures
1.1 Surface textures can vary widely while their Ra values are similar
when using stylus profilometers . . . 3
2.1 The tactile perception process with finger touching . . . 10
2.2 Mechanism of tactile evaluation . . . 11
2.3 The view of arm skin friction measuring unit of Egawa et al. . . 12
2.4 Measurement of skin frictional properties by Tang et al. . . 13
2.5 Configurations for (a) straight and (b) curved friction experiments in Cottenden et al. . . 14
2.6 Skin tribometer developed in Pailler-Mattei et al. . . 14
2.7 The multilayered artificial fingertip designed by Han and Kawamura 15 2.8 The comparison between a human finger and a robotic finger . . . . 16
2.9 The pure silicone artificial fingertip used in Shao et al. . . 17
2.10 Finger friction measurement on printing paper from Skedung et al. . 19
2.11 The orientation of the index finger and the counter-surface in the tribological experiments . . . 20
2.12 Schematic of soft metrology friction test system in Gee et al. . . 20
2.13 Correlation coefficient between coefficient of friction and roughness parameters under (a)dry and (b)lubricated conditions. White and black bars represent positive and negative correlations, respectively . 23 3.1 Exploded view of the whole apparatus in SolidWorks from below . . 30
3.2 Unexploded view of the apparatus in SolidWorks . . . 31
3.3 FE model of the fingertip . . . 31
3.4 The multi-layer artificial fingertip (a) side view (b) top view with a diameter of 15 mm . . . 32
3.5 The press used to imprint the fingerprint on the artificial fingertip . 33 3.6 Photo of the friction test apparatus with labelled parts. . . 34
3.7 The notch hinge structure . . . 35
3.8 Capacitive sensor, load cell and the sample holder . . . 36
3.9 FEA analysis and experimental calibration of the flexure . . . 37
3.10 Calibration of the load cell and the capacitive sensor . . . 38
3.11 Software panel . . . 38
3.12 One of the measurement taken during SNR analysis . . . 39
3.13 Power spectral density (PSD) of sensor outputs when there is no operation . . . 40
3.14 Power spectral density (PSD) of sensor outputs during measurement under normal load and friction . . . 40
3.15 Stick-slip effect check during friction measurement . . . 42
3.16 Bias measurement ofAM0.4 . . . 43
3.17 2D and 3D surface metrology instrument. . . 44
3.18 The Bruker scanning results of one of the steels samples (IDS2) . . 45
3.19 The Bruker scanning results of one of the milled aluminium samples (ID AM3) . . . 45
3.20 Roughness measurements of steel obtained using ContourGT-K (blue) and Form Talysurf (red) . . . 46
3.21 Roughness measurements of milled aluminium obtained using ContourGT-K (blue) and Form Talysurf (red) . . . 46
3.22 Roughness measurements of turned aluminium obtained using ContourGT-K (blue) and Form Talysurf (red) . . . 47
3.23 Friction coefficient measurements comparing human fingertip and artificial fingertips applied on (a and b) aluminium and (c) steel samples at various stroking speed and loading forces . . . 51
3.24 Comparison of friction coefficients against sliding speed of steel samples measured using the artificial finger and the roller rig with silicone cover 55 3.25 Friction coefficients of the ground steel samples againstRqat different sliding speeds with fixed contact force OF 1 N . . . 55
3.26 The influence of fingerprint texture on the artificial fingertip friction 57 3.27 Friction coefficients of the milled aluminium samples at different contact forces with fixed sliding speeds of (a) 5 mm s−1and (b) 8 mm s−1 58 3.28 Friction coefficients of the turned aluminium samples at different contact forces with fixed sliding speeds of (a) 5 mm s−1and (b) 8 mm s−1 59 3.29 Friction coefficients of the ground steel samples at different contact forces with fixed sliding speeds of (a) 5 mm s−1 and (b) 8 mm s−1 . . 60
3.30 Friction coefficients of the ground steel samples at different sliding
speeds with fixed contact forces of (a) 0.5 N and (b) 1 N . . . 61
4.1 Partial contact and full contact depends on the surface micro-geometry and loading conditions . . . 66
4.3 A rubber block (dotted area) in adhesive contact with a hard rough substrate (dashed area). . . 75
4.4 Effective Young’s modulus as a function of length scale for dry and hydrated skin . . . 77
4.5 Measurement of the Young’s modulus measurement of the artificial fingertip . . . 80
4.6 (a) The indenter and specimen surface at full load and unload for a conical tip (b) Load versus displacement for elastic-plastic loading followed by elastic unloading . . . 81
4.7 Geometry and compliance curve of loading for a spherical tip . . . . 81
4.8 The shape of indenters . . . 82
4.9 Various components of a nano-indentation test cycle . . . 84
4.10 The nano-indentation setup and the Berkovich tip used . . . 85
4.11 The Young’s modulus measurement of the artificial fingertip (Pmax= 75 mN) . . . 86
4.12 The Young’s modulus measurement results by applying different max-imum loads . . . 87
4.13 The indentation results for the artificial fingertip . . . 88
4.14 Schematic Diagram of the instrument . . . 89
4.15 Contact measurement instrument . . . 89
4.16 Contact measurement instrument . . . 90
4.17 Schematic diagram of TTM module . . . 91
4.18 Artificial finger surface metrology under the Bruker microscope . . . 92
4.19 Contact area measurement results for 50 g and 100 g weights. . . 92
4.20 Analysis of the contact mechanism using the Abaqus software . . . . 95
4.21 The FEM displacement-loading analysis on the artificial finger . . . 96
4.22 Comparison between theory, simulation and experiment results of the relationship between contact radius and normal force . . . 97
5.1 Gold sputter coating machine . . . 102
5.2 Surface topography of s44by Bruker ContourGT-K and its SEM photo103 5.3 Surface topography of s58measured by Bruker ContourGT-K and its SEM photo . . . 103
5.4 Surface topography of s83measured by Bruker ContourGT-K and
its SEM photo . . . 104
5.5 Surface topography of s97measured by Bruker ContourGT-K and its SEM photo . . . 104
5.6 Observations of Fine polymer patterned surface morphology by mi-croscope at same illumination condition . . . 105
5.7 Observations of coarse polymer patterned surface morphology by microscope at same illumination condition . . . 106
5.8 Surface texture of 4N127under Bruker . . . 106
5.9 Surface texture of 4N111under Bruker . . . 107
5.10 Surface texture of smoother4N127 under Bruker . . . 107
5.11 Roughness measurements of coated TPE samples comparison using ContourGT-K (blue) and Form Talysurf (red) . . . 108
5.12 Roughness measurements of patterned TPE samples using ContourGT-K (blue) and Form Talysurf (red) . . . 108
5.13 Roughness measurements of normal patterned (blue) and sanded (red) TPE samples comparison measured by ContourGT-K . . . 110
5.14 The cross-section (moulded in resin) taken by microscope . . . 111
5.15 Before and after the nano-indentation of s44 . . . 112
5.16 Before and after the nano-indentation of s58 . . . 112
5.17 Before and after the nano-indentation of s83 . . . 113
5.18 Before and after the nano-indentation of s97 . . . 113
5.19 Before and after the nano-indentation of s97R . . . 113
5.20 The nano-indentation results of s58,s83ands97when the maximum load was 500 mN . . . 114
5.21 Mechanical properties of the TPE samples . . . 115
5.22 Comparison with TPM measurement . . . 116
5.23 Polymer coating friction measurement under different conditions . . 117
5.24 Friction coefficient measurements comparing human fingertip and artificial fingertips applied on patterned TPE samples at various stroking speed and loading forces . . . 118 5.25 Comparison between P4 material patterned samples and sanded samples120 5.26 Comparison between P5 material patterned samples and sanded samples121 5.27 Comparison between 1N111patterned samples and sanded samples . 121
6.1 Spearman’s correlations (absolute) between material properties and friction coefficients measured by human and artificial finger for metal
samples . . . 127
6.2 Spearman’s correlations between material properties and friction coef-ficients measured by human and artificial finger . . . 129
6.3 The surface height distribution of milled aluminium sample AM1 . . . 131
6.4 The surface height distribution of turned aluminium sample AT1 . . 131
6.5 The surface height distribution of grinded steel sample S3 . . . 132
6.6 The surface height distribution of coated TPE sample s58 . . . 132
6.7 Definition of Spacing of surfaces. . . 133
6.8 Steel Samples . . . 136
6.9 Milled aluminium Samples . . . 136
6.10 Turned aluminium Samples . . . 136
6.11 Thermoplastic patterned samples . . . 138
6.12 Thermoplastic coating samples . . . 138
6.13 AM1 rough approach and its contact results . . . 140
6.14 AM6 rough approach and its contact results . . . 141
6.15 Contact area results when the normal force was 0.98 N . . . 142
6.16 Surfaces with various skewness and kurtosis values . . . 143
6.17 The influence of skewness to surface height probability distribution . 145 6.18 The influence of kurtosis to surface height probability distribution . 146 6.19 Influence of Sk andSku on the normalised real contact area . . . 147
6.20 Analysis of surface texture as two components. Hatched areas repres-ent volumes of rubber in which about 80 percrepres-ent of hysteretic energy is dissipated . . . 149
6.21 The relationships between Rda and friction coefficient for the steel samples . . . 149
6.22 The relationships between Rda and friction coefficient for the alu-minium samples. . . 150
6.23 The relationships betweenRda and friction coefficient for the thermo-plastic patterned and coated samples . . . 151
7.1 Comparison of the tactile sensorial rankings and sensitive physical parameters . . . 157
7.2 Biplot of the loadings of characteristic variables and the scores of the samples (Yue Z., 2010) . . . 159
7.3 Visualising the correlation between touch-feel perception of ‘smooth/rough’
ranking with surface roughness parameters Sz andSq . . . 164
7.4 Visualising the correlation between touch-feel perception of ‘cool/warm’ ranking with surface parameter Rda . . . 167
7.5 Visualising the correlation between touch-feel perception of ‘like/dis-like’ ranking with in vivo friction coefficient µin-vivo . . . 169
A.1 The structure of flexure . . . 196
A.2 The whole structure of the friction apparatus (1) . . . 196
A.3 The whole structure of the friction apparatus (2) . . . 197
A.4 The whole structure of the friction apparatus (3) . . . 197
A.5 The whole structure of the friction apparatus (4) . . . 197
A.6 Flexure system . . . 198
A.7 The instrument . . . 199
A.8 Notch hinge . . . 199
A.9 The artificial fingertip without the glass plate . . . 202
A.10 Contact area measurement with glass plate resting on the fingertip (no added weights) . . . 202
A.11 The contact area with 50 g weight . . . 203
A.12 The contact area with 100 g weight . . . 203
A.13 The contact area with 200 g weight . . . 203
A.14 The contact area with 300 g weight . . . 204
A.15 The surface texture of AM1. . . 204
A.16 The surface texture of AM2. . . 205
A.17 The surface texture of AM3. . . 205
A.18 The surface texture of AM4. . . 206
A.19 The surface texture of AM5. . . 206
A.20 The surface texture of AM6. . . 207
A.21 The surface texture of AT1. . . 207
A.22 The surface texture of AT2. . . 208
A.23 The surface texture of AT3. . . 208
A.24 The surface texture of AT4. . . 209
A.25 The surface texture of AT5. . . 209
A.26 The surface texture of AT6. . . 210
A.27 The surface texture of S1 . . . 211
A.28 The surface texture of S2 . . . 211
A.29 The surface texture of S3 . . . 212
A.30 The surface texture of S4 . . . 212
A.31 The surface texture of S5 . . . 213
A.32 The surface texture of s44. . . 213
A.33 The surface texture of s58. . . 214
A.34 The surface texture of s83. . . 214
A.35 The surface texture of s97. . . 215
A.36 The surface texture of 4N127 . . . 215
A.37 The surface texture of sanded4N127 . . . 216
A.38 The surface texture of 4N111 . . . 216
A.39 The surface texture of sanded4N111 . . . 217
A.40 The surface texture of 1N111 . . . 217
A.41 The surface texture of sanded1N111 . . . 218
A.42 The surface texture of 5N127 . . . 218
A.43 The surface texture of sanded5N127 . . . 219
A.44 The surface texture of 5N111 . . . 219
A.45 The surface texture of sanded5N111 . . . 220
A.46 The surface height distributions of the milled aluminium samples . . 221
A.47 The surface height distributions of the turned aluminium samples. . 222
A.48 The surface height distributions of the grinded steel samples. . . 223
A.49 The surface height distributions of coated polymer samples . . . 224
List of Tables
3.1 Mechanical properties of the fingertip model in shao˙2010 . . . 30 3.2 Fingerprint surface topographical and mechanical parameters
meas-ured by Form Talysurf surface profilmeter . . . 33 3.3 Surface texture parameters of the Aluminium samples measured by
Bruker . . . 47 3.4 Surface texture parameters of the Aluminium samples measured by
Taylor Hobson . . . 48 3.5 Surface texture parameters of the steel samples measured by Bruker 48 3.6 Surface texture parameters of the steel samples measured by Taylor
Hobson . . . 48 3.7 Coefficient of determination r2 between artificial finger and human
finger friction measurements . . . 53 3.8 Root mean squared errors between artificial finger and human finger
friction measurements . . . 53 3.9 Friction coefficients of aluminium samples . . . 58 3.10 Friction coefficients of steel samples. . . 59
4.1 Young’s modulus measurement results on the multilayer artificial finger and its constituent materials . . . 80 4.2 Surface parameters of the artificial finger (units in µm). . . 92 4.3 Contact radii and deformation depth under different weights (normal
forces) (Experiment) . . . 93 4.4 Contact radii under different normal forces (JKR simulation) . . . . 94 4.5 Contact radii under different normal forces (FEM Simulation) . . . . 95
5.1 Description of soft-feel coated and patterned TPE and copolymer samples . . . 101 5.2 Surface topography parameters of polymer coated and patterned samples109
5.3 Correlation between artificial finger and human finger in friction measurement . . . 119 5.4 Friction measurement results of thermoplastic samples at 2 mm s−1
sliding speed (artificial finger only) . . . 123 5.5 Friction measurement results of thermoplastic samples at 5 mm s−1
sliding speed (artificial finger only) . . . 123 5.6 Friction measurement results of thermoplastic samples at 8 mm s−1
sliding speed (artificial finger only) . . . 124
6.1 Coefficient of determination (r2) for the relationship curve fitting . . 135
6.2 Contact area simulation of various materials with different Young’s moduli . . . 142
7.1 Surface topographical, mechanical, and friction parameters with stat-istically significant correlation with ‘smooth/rough’ ranking data . . 163 7.2 The combined parameters correlation with ‘smooth/rough’ Ranking 165 7.3 Surface topographical, mechanical, and friction parameters with
stat-istically significant correlation with ‘soft/hard’ ranking data . . . 166 7.4 Surface topographical, mechanical, and friction parameters with
stat-istically significant correlation with ·cool/warm’ ranking . . . 167 7.5 The combined parameters correlation with ‘cool/warm’ Ranking . . 168 7.6 Surface topographical, mechanical, and friction parameters with
stat-istically significant correlation with ·slippery/sticky’ Ranking . . . . 168 7.7 The combined parameters correlation with ‘slippery/sticky’ Ranking 169 7.8 The highest correlated parameters with ‘like/dislike’ Ranking . . . . 170
A.1 Flexure stiffness measurement . . . 201 A.2 Smooth/rough touch-feel perception raw ranking data on TPE samples225 A.3 Soft/hard touch-feel perception raw ranking data on TPE samples . 225 A.4 Cool/warm touch-feel perception raw ranking data on TPE samples 226 A.5 Slippery/sticky touch-feel perception raw ranking data on TPE samples226 A.6 Like/dislike touch-feel perception raw ranking data on TPE samples 227
Acknowledgements
This thesis is dedicated to my Family, Friends and especially my Father, who always
lives within my heart, who teaches his princess that, wherever there is a dream,
pursuit it with courage!
My sincerest gratitude goes to Professor Xianping Liu, for being more than
great mentors me as a good friend. This endeavour would not have been possible
without the technical guidance and emotional support by my supervisor, especially
when I become a mother. In addition to the important technical advice and directions,
thank you very much for your selfless support and encouragement during times of
difficulty, both inside and outside of work. Many thanks go to quite a few people
in the School of Engineering, especially to lab technician Mr. Dave Robinson and
Mr. Martin Davis. Their kindness was heartfelt and their technical support was
invaluable for experiment ideas and design. I would also like to thank Professor Derek
Chetwynd and Professor Yanling Tian for their general support and references. Many
thanks for Dr. Lei Wang and Dr. Yuan Xue, who offered me a lot of helpful advice.
A big thanks to my big family for their endless encouragement and selfless
devotion to my well-being and happiness. I am very grateful to God for bringing
me the best gift of my life—my lovely little son Rui. He is our angel who brings
unending love and joy to everyone in my family. He carries on with him my thoughts
of my father and the love to whom, is now fully devoted to Rui. Thanks to my
mother and my uncle, whom I admire as the kindest people in the world; who would
at times of difficulty sacrifice everything to offer me assistance, care, spoiling and
love. Thanks to my mother-in-law and father-in-law for their generous help with
looking after my son, despite having to travel from afar. I would also like to thank
my friends from the community, in no particular order: Zhongnan Wang, Dan Zhou,
Zhengyu Zhou and family, Yuqing Zheng, Han Zhao, Xinyao Zhu, Zedong Hu, Yan
Zhang, Modupe and Xiaojing Lin.
I am also very grateful for the financial support from the China Scholarship
Council and numerous opportunities from the University of Warwick.
Last but not least,the author would like to express her deepest gratitude to
my loving husband Roland Hin Kwan Wong, who love me the most second only to
my mother; who would stay by my side no matter rich or poor, happy or sad, and is
a perfect match as my soulmate.
List of publications arising from this
research
Hui Niu, Xianping Liu, Quantifying touch-feel perception on some treated thermoplastic materials, 3rd International Conference on BioTribology, London, September 11st-14th, 2016;
Hui Niu, Xianping Liu and Hin Kwan Wong. Friction measurement apparatus for touch-feel perception studies; 3M International Confenernce, Changchun, China, October 5th-9th, 2015;
Hui Niu, Xianping Liu and Hin Kwan Wong. Quantifying touch-feel percep-tion: Tribological Aspects on a new artificial finger design. The international conference on Multiscale Materials Modelling 2014, San Fancisco Bay Area, USA, October 6-10,2014;
Hui Niu, Quantifying touch-feel perception, Surface Science Symposium, June 3rd, University of Warwick, Coventry, UK;
Declarations
This thesis was submitted to the University of Warwick in partial fulfilment of the requirements for the Doctor of Philosophy. The work presented here is my own, except where specifically stated otherwise. The work was performed both in the School of Engineering at the University of Warwick under the supervision of Dr. Xianping Liu.
Abstract
Kansei or affective engineering is the discipline of designing products to be psychophysically more appealing to the human mind and senses. Touch-feel percep-tion of the materials used in consumer products ranging from portable electronics, furniture to automotive interiors plays an important role in the attractiveness of a product. Touch-feel perception is a qualitative measure and is an extrinsic property of the material. To better assist designers and material scientists to optimise aspects of a material for touch-feel perception, it is important to find a link between the qualitative touch-feel attributes with quantitative intrinsic properties of the mater-ials. There is ongoing research in trying to decipher the links between touch-feel perception expressed through semantic psychophysical descriptor words, to physical parameters of the material sample such as the surface topographical, mechanical and tribological attributes. The objective of this work is to fill the current knowledge gap between micro-surface physical properties and customer’s perceptual response to surface tactile sensory information as well as their affective preference through theory, correlation models and experimentation.
A conceptual framework of surface tactile evaluation system can be divided into three parts: measurement of the surface physical characteristics, sensory evalu-ation and correlevalu-ation analysis. To this end, the thesis documents the development of a friction measurement apparatus including an artificial finger to estimate the friction of a material against human skin in an accurate and repeatable manner. Secondly, correlation analyses were performed on the skin-against-material friction and the tribological factors, including the material surface parameters (e.g. roughness) and physical characteristics (e.g. hardness) of various metal and thermoplastic materials. Finally, the human touch-feel perception was assessed through a questionnaire and the results were modelled to obtain a link between the tribological factors and touch-feel perception.
Generally, human beings feel a surface by stroking or sliding one’s finger, which experiences friction. It is challenging to objectively describe the friction experienced by a human finger with respect to surfaces being stroked, as different surfaces and different working conditions can all influence the results. In order to understand the interaction between different surfaces and the friction experienced by a human finger, one has to minimise the variation due to human fingertips and
touch conditions across experiments, such as fingertip humidity, temperature and elastic properties. To achieve this, a friction measurement apparatus incorporating an artificial fingertip has been developed. The artificial fingertip is made of multi-layered materials to mimic the structure, shape, softness and friction properties of a real human fingertip. The friction test apparatus consists of the artificial fingertip, a linear flexure mechanism and a reciprocal linear stage. It is capable of measuring the contact force and friction force simultaneously to give an estimate of the friction coefficient of the material-under-test. Twelve aluminium samples and five steel samples of different surface finishes were tested under different contact forces and stroking speeds. Comparisons were made between the friction results measured in vivo by a human fingertip and those by the artificial fingertip. The results have shown that for the material samples investigated, measurements from the artificial finger achieved a high correlation with results from real human fingers (r2= 0.8∼0.98) for
surface ground steel and milled aluminium. Therefore the artificial finger can be used to mimic the friction characteristics of a real human fingertip and more importantly to measure the skin-against-material friction accurately and in a repeatable way.
In addition, in order to better understand the contact mechanism between the artificial finger and the surface, a suitable theoretical model which incorporates how the contact force relates to the contact area is essential. To enable the modelling of the contact mechanism, the Young’s modulus of the artificial fingertip has to be identified, as it is an essential input parameter for all contact theory models as well as FEM. The artificial finger was measured by using micro- and nano-indentation with Berkovich/spherical-tipped indenters. The contact area measurement was conducted by loading a custom-built glass plate on the artificial fingertip and observing the contact area under an optical microscope. Hertz theory was used to model the fingertip and predictions were compared against finite element analysis. The results support the fact that the Hertz contact theory is valid for modelling the contact mechanism of the artificial finger. Thermoplastic elastomers (TPE) and copolymers of elastomer are commonly used in manufacturing car interiors to give the surface a less harsh and more pleasing feel. Ongoing research has been trying to decipher the links between touch-feel perception expressed through semantic psychophysical descriptor words, to physical parameters of the material sample such as the surface topographical, mechanical and tribological properties. A series of five patterned and five coated TPE surfaces provided by an automotive manufacturer were characterized-topographical parameters of the samples by a surface profiler and mechanical/tribological parameters by a nanoindenter. The friction characteristics of these specimens were measured by the friction test apparatus and the artificial finger. The results showed that the artificial finger is representative of a human finger in its friction-sensing capability.
In the second part of the thesis, the relationship between the skin-against-material friction coefficient and the surface topography parameters Rq and Sm were deduced according to Hertz contact theory. The theory gives good agreement with experimental results. In addition, the relationship between the friction coefficient and the other mechanical parameters such as the Young’s modulus, skewness, kurtosis, surface slope were investigated through correlation analysis. Finally, 54 people of
different age and gender were asked to rank the specimens in terms of 5 pairs of psychophysical descriptors, such as ‘rough/smooth’, ‘cold/warm’, ‘slippery/sticky’, ‘soft/hard’ and ‘like/dislike’. A rank-ordered logit model was deployed to correlate the human touch feel perception rankings and the thermoplastic samples, and the results were compared with correlation methods used in previous work. The results indicated the specific parameters which are correlated with human touch-feel perception and also their relative contributions.The results form a good guideline for material scientists and designers to, for example, build more touch-desirable car interior materials and consumer packaging.
Chapter
1
Introduction
T
actile perception is a fast developing subject that attracted great attention. Customer-oriented affective design, which takes account of their feelings and preferences are of great importance for the commercial success. This interest is driven by a range of factors: the development of a sense of touch in robotics, haptic perception for virtual reality and remote sensing, as well as the desire to improve the tactile aesthetics in “touch intensive” consumer products such as phones, touch-pads, paper, fabrics and conditioners [1].People make a judgement about whether they like a touch sensation or not for products selection. It is crucial for industries such as automotive, textile, cosmetics and telecommunication to identify a way of quantifying the touch feel perception and introducing it as a key design factor [2]. In today’s markets, consumers regularly take functionality, usability and safety for granted and look for an emotional connection with a product, especially in the automotive industry where the customer will spend a large amount of time inside their vehicle.
1.1
Background
1.1. Background
as pleasantness and comfort [3]. Hence, there has been growing interest in quantifying and modelling touch friction perception recently [4–12].
Skin friction has a direct effect on touch-feel perception. It is influenced by many factors such as skin moisture, age and temperature [13]. Because an artificial finger is more or less immune to skin moisture, ageing and temperature effects, an artificial finger can measure surface properties with much higher repeatability. However, to be able to sense touch in a similar way to that of a human finger, the artificial finger should be designed such that it is anthropomorphic, i.e. to have physical properties resembling a human finger. An artificial finger with touch sensing capability offers several applications, for example, telepresence can be enhanced with robot hands transmitting touch-feel information remotely to the haptic actuators at operator’s end. A robot that is more human-like would need to understand what make something ‘nice’ to touch—it has been found that a target surface that is less rough than a fingertip is more pleasant to touch or stroke [14]. Artificial fingers can also be used to validate advanced haptic devices and models such as that of [15] and [16] in an automated manner. Previous research involving quantifying the perception of touch feeling had been conducted, for example, on car interior components using the tribological probe microscope (TPM) [17–19]. The TPM however, could not replicate the same measurement conditions a human finger experiences, e.g. the stroking motion, and did not have the same mechanical properties of a human fingertip.
Moreover, we can design better touch-desirable components or materials if the correlation between human touch-feel and the physical properties of the contact surfaces can be understood. Commercially, products are increasingly focused on ergonomics and there is increasing demand for surface materials with desirable touch-feel properties [20]. Correlation and regression analyses were carried out on materials used in confectionery packaging to identify the relationships between the people’s touch feel responses and the physical measurements of thirty-seven tactile textures; the results showed that touch perception is often associated with more than one physical property [7]. The artificial finger friction sensing capability is correlated against typical surface topography parameters to see which parameters are linked to friction coefficients for various materials. These parameters are then correlated against subjective touch-feel perception on two of the fundamental (lowest-level, see Nagano, Okamoto and Yamada [21]) psychophysical semantic touch-feel descriptors: ‘rough/smooth’ and ‘slippery/sticky’.
1.1. Background
contrasting surfaces, reducing sheen, and enhancing colour depth [22]. As far as car interior surfaces are concerned, the market requires an innovative design of functionality, aesthetics and ergonomics. Specifically, a proper tactile design of polymer surface finishing is essential to achieve such design in terms of cost, safety, comfort and attractiveness [23]. As an cost-effective routine, paint finishes and coating of soft polymers such as thermoplastic elastomers (TPE) and copolymers of elastomer are commonly used in manufacturing car interiors to give the surfaces a less harsh and more pleasing feel. Over-moulding of TPE is also widely applied in manufacturing control knobs and switches to achieve so-called ‘soft-touch’ feel.
However, to guide the tactile design of ‘soft-touch’ polymer surface, the data-base of their physical properties and perceived tactile sceneries should be established and then the potential links could be explored. The physical softness of a material is often measured by Vickers hardness and stiffness (elastic modulus). But the sensorial ‘softness’ or ‘soft-touch’ is a combination of sensations derived from the contact interaction with a surface. Inevitably, such interactions are influenced by both skin features and a range of surface properties such as topography, hardness and friction resistance. In contrast, the sensation of ‘soft-touch’ is subjectively evaluated or quantified by a procedure of psychophysical test.
[image:27.595.211.386.432.570.2]©2011 Bruker Corporation, reprinted with permission from Cohen et al. [24, Fig. 2]
Figure 1.1: Surface textures can vary widely while their Ra values are similar when
using stylus profilometers
Traditionally, surface texture is measured with a stylus, also known as contact profilometer. While stylus profilometers are indeed useful, the resulting surface parameters are of 2D nature—measured by striding a line over the surface. The measured 2D parameters are conventionally denoted by the letterR, such asRa, Rz
1.1. Background
For example, a surface with mostly sharp spikes, deep pits, or general isotropy may all yield the same average roughness value (see Fig.1.1). Parameters relating to the maximum and minimum profile height ar highly sensitive to the location and length of the measurement site. Moreover, the stylus tool itself can contribute error to the measurement—Shaft alignment of the stylus is critical, as its orientation with respect to the shaft will affect the measured roughness. Even if the stylus scan begins with the stylus translating parallel to the shaft, the tip can sometimes get caught in a groove and bumped off-axis. Also, with soft materials deformation may occur and this affects the accuracy of the results.
International Standards Organization [25] developed a set of comprehensive 3D surface parameters, called S-parameters, for quantitative 3D metrology [26,27]. Material surfaces can be measured and characterised by instruments such as surface profilometers or microscopes. Apart from 2D/3D raw data of the surface profile, software of the profilometers often output statistics of the profiles called surface topography parameters. They are denoted by capital S for statistics related to 3D profiles, opposed to the conventional capitalR for 2D profiles. This thesis uses the following common parameters: Average roughness Sa, root mean square roughness
Sq, maximum valley depthSv and mean spacing between peaks Sm are parameters
that provide hybrid roughness and spatial information of 3D surfaces. Skewness Ssk
is a measure of the asymmetry of the amplitude density curve and Kurtosis Sku is
the measure of the peakiness of the amplitude density curve; they are, respectively, the third moments and fourth moment of the surface topography. Root mean square surface slopeSdq and arithmetic mean slopeRda quantify the gradient of the surface
topography.
1.2. The objective and the outline of the thesis
contact with well-defined regular patterned surface shows that the determining parameter is the ratio of the asperity size to the inter-asperity distance [30]. However, until now there is no clear picture on how the surface topography of a material can affect human fingertip friction.
1.2
The objective and the outline of the thesis
1.2.1 The objective of the thesis
The mechanoreceptors in the skin are more sensitive to dynamical stimuli such as stroking the finger on a surface [31]. As such, friction mechanisms directly influence the stimuli on the mechanoreceptors. It follows that an important part of touch-feel perception is to quantify the friction coefficient experimented by a human finger. To address this a friction measurement apparatus was developed. The idea is for such an apparatus to be useful in the industry to simulate and quantify the friction interaction between a human fingertip and a material sample to aid affective engineering design.
This thesis introduces an artificial finger specifically developed to have prop-erties close to that of a human finger, both structurally and the way it strokes and applies a load to the surface. The objective is to enable the artificial finer to experience friction in a similar way to that of a human finger, by linking human touch-feel perception to the different surface physical/topographical parameters.
1.2.2 Outlines of the thesis
The thesis is split into 7 chapters.
Chapter 2presents a literature review following topics in the order of appear-ance in the thesis. It summarises the latest research work on artificial fingertips and friction measurement apparatuses for tribological studies, and in particular, their advantages and disadvantages. Furthermore, the relationships between surface property parameters and their friction coefficient highlighted by existing literature are examined. Correlation studies between touch-feel perception and surface properties in the literature are also discussed.
1.2. The objective and the outline of the thesis
In the second part of the chapter, 12 aluminium samples and 5 steel samples were measured by the friction test apparatus under different normal forces and different stroking speeds. The influence of normal loads and sliding speeds on the friction measurement results were investigated. Comparisons were made with the human fingertip measurement results and an old silicone rubber roller design previously used in the research group.
To aid understanding of the experiment results, the theoretical contact mech-anism between the artificial fingertip and the contacted samples should be invest-igated. Chapter 4 gives a formal definition of human skin friction coefficient, and the various contact theory models in the literature were discussed, including 1) The classic Hertz contact model for solid contact between two elastic bodies; 2) The Johnson-Kendall-Roberts (JKR) model for a contact with adhesion mechanisms 3) Greenwood-William model for a contact between a sphere and a rough surface with Gaussian-distributed asperities; 4) Kotwal-Bhushan contact theory which relaxes the Gaussian assumption. The value of Young’s modulus of the artificial fingertip plays a key role in the theoretical modelling analysis, therefore different indentation methods were applied to measure its value. The resulting Young’s modulus was applied a FEM analysis of the artificial fingertip. An experiment on the contact mechanism of the artificial fingertip was carried out, using a specially designed instrument simulating a contact with a controlled load. The contact area and deformation depth were measured using a Bruker 3D microscope. The results suggested that the contact could be suitably modelled using the Hertz contact theory.
Touch-feel perception of materials in car interiors is a topic of great interest to car manufacturers. Chapter 5 presents a study of five coated thermoplastic samples and ten patterned thermoplastic samples that are commonly used in the manufacturing of car interiors. Surface topography, materials mechanical properties and their friction coefficient were measured using different instruments. Comparisons were made with results from the tribological probe microscope (TPM) [17–19].
Chapter 6 documents correlation analyses performed using data obtained from Chapter5. Fifty-seven people of different age and gender were asked to rank the TPE samples using the 5 pairs of psychophysical descriptors. Then, Spearman’s rank method was used to identify which material property parameters were correlated with measured friction coefficients. The various relationships between surface friction measurements with various parameters that were found to be possibly correlated, including 1) Sa,Sm; 2) Young’s modulus; 3) Rsk,Rku; and 4)Rda were analysed in
more detail both theoretically and experimentally.
1.3. Contributions
mechanical properties and surface friction coefficients, Chapter7 looks at the rela-tionships between friction coefficients measured by a human/artificial finger and the physical parameters. Firstly, theoretical modelling using the Hertz and Greenwood-William contact theory is presented. Secondly, experiment was performed where 54 people of different gender and age were asked to touch the material samples and rank them using 5 different psychophysical descriptor pairs, namely 1) ‘rough/smooth’, 2) ‘soft/hard’, 3) ‘cool/warm’, 4) ‘slippery/sticky’ and 5) ‘like/dislike’ [32]. Several correlation methods already applied in previous work were summarised and their strength and weakness were discussed. The rank-ordered logit modelling technique was used to develop a model for the correlation between the touch-feel perception and the material surface topographical parameters, mechanical properties and friction coefficients.
1.3
Contributions
The thesis introduces a new anthropomorphic artificial finger that has properties close to that of a human finger, both structurally and mechanically. The artificial finger is integrated with a linear stage mechanism to form parts of a friction measurement apparatus. The linear stage allows the artificial finger to simulate the way human finger strokes and applies a load onto a surface. The friction measurement apparatus avoids the uncertainty of human finger-based in-vivo testing due to natural variations between subjects such as skin temperature, humidity and loading forces.
Finite element method (FEM) has been carried out to analyse the contact mechanism of the artificial finger. The contact mechanism was also looked at using theory-based models from the literature. A compact contact area measurement device was developed in order to validate the model and theory experimentally.
Based on the theoretical modelling results and friction measurement results, further relationships between friction coefficients and surface physical property parameters have been investigated according to Hertz contact theory. The results provide a guideline for better surfaces design in industries. Thermoplastic materials have been widely applied in car interiors. While people have a degree of personal taste regarding the materials in a car interior, if the physical property parameters such as surface topography, surface hardness and surface friction characteristics can be determined accurately, their identified correlations with human touch perception can nevertheless give a quantifiable direction for the designers to pursuit from.
1.3. Contributions
properties by nano-indentation and surface friction by the newly developed friction test rig. In addition, correlations between these physical characteristics with the touch-feel perception obtained from a survey were sought.
Chapter
2
Literature Review
T
he objective of this thesis is to investigate the relationship between human touch feel perception and different materials, so this chapter reviews the literature following the research cue. Normally human touch-feel perception is evoked by stroking fingers over a surface, which is largely affected by friction. Because of this, human skin friction mechanism is reviewed first in this chapter. Secondly, an overview of the history of the artificial finger is presented. Thirdly, the literature on the relationship between surface friction and their physical parameters such as surface topography, surface mechanical properties were reviewed according to the contact theory based on different surface textures. Lastly, correlation studies in the literature on touch-feel perception and materials physical property including their friction characteristics are summarised.2.1
Human skin friction mechanism
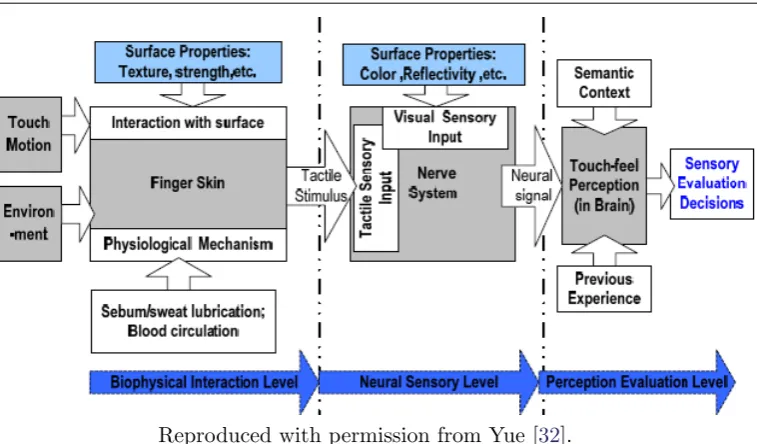
As described in [33], the sensory evaluation is defined as “a scientific discipline used to evoke, measure, analyse and interpret reactions to those characteristics of food and other materials as they are perceived by the sensation of sight, smell, taste, touch and hearing.” Tactile evaluation specifically refers to perception through touch, which can only be considered when human skin in contact or stroking over the surface of an object. To be more specifically, tactile perception is realised by stroking, tapping or pinching the surface with a tip of a finger, which illustrated in Fig. 2.1of [32].
2.1. Human skin friction mechanism
[image:34.595.117.496.107.329.2]Reproduced with permission from Yue [32].
Figure 2.1: The tactile perception process with finger touching
In the physical interaction level, a human finger interacts with the sample surface by reciprocating stroking or sliding motion. It established the physical interfacial interaction between the finger skin epidermis layer and the surface. This interaction is determined by the strain/stress or thermal state of the dermis layer of the skin, changes of which are picked up as tactile stimuli by numerous mechanic-receptors or thermo-receptors at the neural sensory level [34]. At the final psychological evaluation level, the psychological judgements are made by the tactile stimuli transferred. By combining and comparing to the memory of a previous experience, the affective judgement is expressed [35].
Tribology is defined as the ‘science and technology of interacting surfaces in relative motion’ [36]. The sliding friction of human finger to the contacted surface is highly complex due to deformation of the finger under pressure and lateral movement [1,13,37]. In addition, the surface topography, the frictional force between finger and surface and the mechanical vibration introduced by sliding will also affect the friction results [9,38,39]. A schematic of fingertip subsurface structure is shown in [40]. The blood circulation, sebum/sweat lubrication both have effects on the sliding friction results [41]. The human touch perception related to surfaces roughness, softness and warmth which would influence the strain, strain rate and temperature receptors [34]. In this case, a new artificial finger design becomes a trend for touch feel perception research.
2.1. Human skin friction mechanism
which combines rigidity with light weight. It connects with the muscles in the forearm by ligaments fixed on the bone. Secondly, collagen fibres link the skin with the bone tip. The collagen fibres in the subcutaneous tissues constitute the intermediate layer of the fingertip. Large deformation occurs in this composite material during sliding. The last medium is the human skin, which is the cover of the human fingertip. It is crucial to understand the friction properties of human skin. The touch-feel perception can be displayed in Fig. 2.2.
[image:35.595.203.396.250.506.2]Reproduced with permission from Wiertlewski [42].
Figure 2.2: Mechanism of tactile evaluation. Mechanoreceptors location (top left), afferent responses (top right), and mechanical interaction during tactual exploration (bottom).
2.1. Human skin friction mechanism
stratum corneum was measured with a CM825 Corneometer, the transepidermal water loss with a Tewameter TM210, the viscoelastic properties of the skin with a Cutometer SEM575 and the skin surface pattern by observing the negative replica made with silicon rubber. The results showed that friction coefficient of the skin was not influenced by load but by skin moisture. The mean deviation was influenced by the pattern and the viscosity of the skin. On the contrary, Koudine et al. [44] argued that for skin, Amontons’ Law stipulating the invariance of friction coefficient with load does not hold. The experiment results also showed that friction coefficient depends on the load applied to the finger pad.
[image:36.595.198.396.268.472.2]©2002 John Wiley and Sons, reprinted with permission.
Figure 2.3: The view of arm skin friction measuring unit of Egawa et al. [43]
Tang et al. [45] conducted tests on forearm skin with the UMT Series Micro-Tribometer, shown in Fig.2.4, to assess the influence of sliding speed and the normal load of the measurement probe on the skin friction measurement. The probe was a polypropylene sphere of 10 mm in diameter attached to a suspension system. The forearm was kept immobile while the probe was pressed onto the skin with a normal load maintained constant by a servo feedback loop. As the normal load was increased from 0.1 N to 0.9 N, the probe was moved linearly for 12 mm at a constant speed of 1 mm s−1. Then, the sliding speed was increased from 0.5 mm s−1 to 4 mm s−1
2.1. Human skin friction mechanism
skin surface is determined by adhesion, probably due to the molecular bonding of surface atoms in both contacting surfaces as well as the deformation during the mutual mechanical interaction of the asperities of the rigid probe surface into the soft skin surface. Meanwhile, sliding speed also influences the friction behaviour of human skin. When the sliding speed increases, friction coefficient increases and the “stick-slip” phenomenon becomes more pronounced. As the sliding speed increases, hysteric friction increases with more energy lost in elastic hysteresis [45], i.e. the energy dissipated due to material internal friction.
©2008 Elsevier, reprinted with permission.
Figure 2.4: Measurement of skin frictional properties by Tang et al. [45]
In[46], how the epidermal hydration affects the friction between human skin and textiles was investigated. Eleven males and eleven females rubbed their forearm against textile samples on a force plate using defined normal loads and friction measurements. The results showed there is a highly positive linear correlation between skin moisture and friction coefficient. No correlation was observed between moisture and elasticity, nor between elasticity and friction.
Another study on the effect of hydration on friction coefficient involved a method for measuring the friction coefficient between non-woven materials and the curved surface of the volar forearm. The measurement was tested on normal (dry) and over-hydrated volar forearms of five female volunteers [47, 48]. Straight and curved friction experiments had been carried out. The instruments are shown in Fig.2.5. For the three non-woven polymer fibre material tested, the friction coefficient results varied in the ranges of about 0.3 to 0.5 when the skin of the participant’s forearm was dry and 0.9 to 1.3 when the skin was wet.
2.2. Artificial finger
[image:38.595.204.397.415.506.2]©2008 SAGE Publications, reprinted with permission.
Figure 2.5: Configurations for (a) straight and (b) curved friction experiments in Cottenden et al. [47]
a structural model of the fingertip incorporating its anatomical structure and the nonlinear and time-dependent properties of soft tissue. It proposed that surface deflection most occurs in the soft tissue of human fingertips. Researchers also think stratum corneum contributes a friction adhesion component which influences the overall skin friction behaviour. By realising in vivo tribological test with a tribometer (indentation and friction), the results showed principally an increase of the adhesion force between the probe and skin surface and a decrease of the lateral stiffness in absence of the stratum corneum [50] (removed in vivo by successive tape-stripping).
©2007 Elsevier, reprinted with permission.
Figure 2.6: Skin tribometer developed in Pailler-Mattei et al. [50]
However, in-vivo friction measurements are very much influenced by the environment and test conditions. The friction coefficient changes between subjects and with factors such as age and skin temperature [13]. For instrumentation and experiment design, there is a need to look into the literature to identify these confounding factors.
2.2
Artificial finger
2.2. Artificial finger
the use of elastic materials was to enhance the gripping power of robotic hands or be compatible with various tactile sensors, rather than to emulate human friction sensing [52–54]. An early attempt for to develop an anthropomorphic artificial fingertip is shown in Fig.2.7 [55, 56]. The artificial finger was comprised of cover, filler and bone parts. The cover part was made of silicone rubber with a thickness of 1 mm; the filler part contained silicone rubber and silicone gel, and the bone was made of aluminium. The stiffness values of the artificial fingertip in unloading and loading condition have been analysed. The friction results show lower friction coefficients and larger normal forces compared to those of a human finger. The analysis and measurement of the softness of finger joint provided important guidelines for the future design of artificial fingers.
[image:39.595.223.379.311.457.2]©1999 IEEE
Figure 2.7: The multilayered artificial fingertip designed by Han and Kawamura [55]
2.2. Artificial finger
[image:40.595.206.385.116.309.2]©1992 IEEE Reproduced with permission from Shimoga and Goldenberg [53].
Figure 2.8: The comparison between a human finger and a robotic finger
of an object with a built-in thermistor.
An artificial fingertip with a viscoelastic core, skin with fingerprint surface has been constructed in Shao, Childs and Henson [5] and is shown in Fig. 2.9. Its objective was to mimic the structure, the shape, softness and friction properties of human fingertips. Their pure silicone artificial fingertip had different friction characteristics compared to a real fingertip—the pure silicone used was softer and deformed more under friction. However, when the softness of the artificial fingertip was made closer to real human fingertips, the frictional properties also became more similar to human fingertips. Based on [5], a multi-layered artificial finger construction with the softness of the fingertip as close to that of a human is desirable. The softness can be characterised by the surface mechanical parameters such as Young’s modulus and Vickers hardness. To facilitate choosing the right material, these parameters should be known. Young’s moduli of various part of human fingers (including plate, bone, soft tissue, epidermis and dermis) are provided in Shao et al. [59].
A multilayered 2D finite element (FE) fingertip model was created using the commercial software Abaqus by Shao et al. [59]. The results show that fingertip’s epidermal ridges have little effect on stress distribution within the fingertip in static loading but significantly increase oscillations when sliding over a textured surface. In the case of sliding contacts, the existence or absence of epidermal ridges strongly affects the models’ behaviours. FE modelling was able to give insights as to how microstructures on the skin may aid tactile perception.
2.3. Friction theory and measurement
[image:41.595.165.399.110.371.2]©2009 Elsevier, reprinted with permission.
Figure 2.9: The pure silicone artificial fingertip used in Shao, Childs and Henson [5]
artificial finger to better replicate the human finger friction characteristics. Firstly, the shape, size and the structure should resemble a human finger. Secondly, the ‘softness’ characterised by Young’s modulus and Vickers hardness is important—the artificial fingertip should have a multilayer composite structure and suitable materials should be chosen with similar Young’s modulus and hardness of each layer. To this end, a new artificial fingertip has been designed and documented in this thesis, details of which are shown in Chapter3.
If the developed artificial fingertip can represent the real human fingertip friction, accurate friction coefficients can be obtained to link the touch feel perception. The next step is to understand the contact mechanism between the fingertip and the touched surface. In addition, better friction measurement instruments are reviewed.
2.3
Friction theory and measurement
2.3. Friction theory and measurement
displacement of the hemispherical fingertip and the orientation angle of a contact planar object. The elastic potential energy has a local minimum in the model.
In [61], it has been shown that for ‘tactile friction’, the friction coefficient cannot be considered a property of the skin alone, but depends on the whole system; it required a full understanding of the contact mechanics and the behaviour of human skin.
The friction force during contact between human skin and a counter surface is a combination of forces due to both adhesion and deformation [62–64].
Ff,adh =π∗τ0∗(
3R 4E∗)
2/3∗N2/3 (2.1)
Ff,def = 0.17∗βve∗(
1 R2∗E∗)
1/3∗N4/3 (2.2)
µ= Ff
N (2.3)
whereFf,i represents the respective friction forces, τ0 is the shear strength of the
interface,R is the reduced radius of the two contact bodies,βve is the visco-elastic
hysteresis loss fraction, N is the applied normal load andE∗ is the reduced Young’s modulus. In the skin contact case,E∗ depends solely on the properties of the skin. By combining the equations above, the adhesion friction coefficient reduces with the increasing normal loadN, while the deformation friction coefficient increases with increasing load [44]. More details are summarised in Chapter4.
µ∝Cadh∗N−1/3+Cdef∗N1/3 (2.4)
Once an artificial finger has been designed, the next task is to measure the friction between the artificial fingertip and contacted surfaces. Generally speaking, the load force applied by people when they feel a surface is not larger than 2 newton [3,65]. Because of this, a sensitive and accurate setup to measure the frictional force and the normal force is required. The friction measurement apparatus can either be custom-built or uses commercially available bespoke solutions; this section reviews a few of the setup used in the literature.
2.3. Friction theory and measurement
sided adhesive tape. However, only paper samples were tested. A new measurement apparatus suitable for other material samples such as those used in car interiors is essential for the aim of this thesis.
[image:43.595.201.394.168.316.2]©2001 Elsevier, reprinted with permission.
Figure 2.10: Finger friction measurement on printing paper from Skedung et al. [11]
Another paper describes the design, construction, and use of a multi-sensory measurement system for tactile sensation that can be used to evaluate the feel of different packaging materials [6]. This paper has demonstrated a new approach to quantifying touch perception of different surfaces using a multi-sensory measurement system. The experiments were conducted by sliding or pressing an artificial fingertip with embedded sensors against the surfaces of different samples which were fixed on a force table. The roughness, friction coefficients, compliance, and rate of change in the temperature were obtained. Forty volunteers were asked to touch and rate the samples by filling in questionnaires about how they felt. A multi-regression analysis was performed to examine the relationship and strong correlations were found between subject’s feelings and the physical measurements. Although the types of samples may have limited the application, the results show very promising correlations between tactile perception and the measured surface parameters.
[66] detailed a set-up based on a balanced loading arm supported on a variable velocity stage, where a human finger pad would rub against a small selection of solid materials with a range of sliding velocities (from 1 mm s−1 to 100 mm s−1) at a
fixed normal load (0.2 N). The measurement apparatus is shown in Fig.2.11. The frictional force was measured using a strain-gauged double cantilever transducer. The friction coefficients measured were in the range from 0.2 for filter paper to 4 for smooth glass.
2.3. Friction theory and measurement
Figure 2.11: The orientation of the index finger and the counter-surface in the tribological experiments
shown in Fig.2.12. The normal load was applied in experiments between about 2 N to 20 N. It was found that human finger resulted in higher friction coefficient than using a rubber probe or a steel probe.
©2005 Elsevier, reprinted with permission.
Figure 2.12: Schematic diagram of soft metrology friction test system in [61]
2.4. Relationship analysis between friction and surface physical parameters
measured. The resolution of the force measurements is 25 mN in the normal direction and 12.5 mN in the tangential direction.
2.4
Relationship analysis between friction and surface
physical parameters
Since the objective of the thesis is to link the human touch-feel perception and the various surface physical parameters of the material, and that friction is the most direct property a human finger experiences, the relationship between friction and surface physical parameters need to be identified.
Surface topographical parameter Ra gives an overall summary of height
variations, however, it does not give any information on waviness and it is insensitive to small height changes. Rq gives more information about height variations, but
it still does not give a satisfactory description of the surface roughness. Rskis the
skewness and is sensitive to deep valleys and high peaks. Zero skewness reflects in symmetrical height distribution; positive skewness occur when a surface has high peaks or filled valleys; negative skewness describes surfaces with deep scratches or lack of peaks. Rku is the kurtosis which measures the sharpness of both peaks and
valley. Rku is less than 3 when surfaces have relatively smooth peaks and valleys,
whileRku is more than 3 for surfaces with relatively sharp peaks and narrow valleys
[67].
Skin friction appears to dependent on several factors such as age, anatomical site and skin hydration. In addition, the choice of the probe and the test apparatus will also influence the measurement. Differences in probe material, geometry and smoothness affect friction coefficient measurements. An increase in skin hydration, either through water or moisturiser application, increases its friction coefficient; whereas a decrease in skin hydration, either through clinical dermatitis or through alcohol addition, decrease the coefficient [3, 43, 44, 46, 47, 66]. Differences are present between anatomical sites. Conflicting results are found regarding age and no differences are apparent as a result of gender or race [68].

![Figure 2.3: The view of arm skin friction measuring unit of Egawa et al. [43]](https://thumb-us.123doks.com/thumbv2/123dok_us/9459551.452736/36.595.198.396.268.472/figure-view-arm-skin-friction-measuring-unit-egawa.webp)

![Figure 2.7: The multilayered artificial fingertip designed by Han and Kawamura [55]](https://thumb-us.123doks.com/thumbv2/123dok_us/9459551.452736/39.595.223.379.311.457/figure-multilayered-articial-ngertip-designed-han-kawamura.webp)

![Figure 2.9: The pure silicone artificial fingertip used in Shao, Childs and Henson [5]](https://thumb-us.123doks.com/thumbv2/123dok_us/9459551.452736/41.595.165.399.110.371/figure-pure-silicone-articial-ngertip-shao-childs-henson.webp)


