RESEARCH ARTICLE
Modulation of joint and limb mechanical work in walk-to-run
transition steps in humans
Neville J. Pires1, Brendan S. Lay1and Jonas Rubenson1,2,*
ABSTRACT
Surprisingly little information exists of the mechanics in the steps initializing the walk-to-run transition (WRT) in humans. Here, we assess how mechanical work of the limbs (vertical and horizontal) and the individual joints (ankle, knee and hip) are modulated as humans transition from a preferred constant walking velocity (vwalk) to a variety of running velocities (vrun; ranging from a sprint to a velocity slower thanvwalk). WRTs to fastvrunvalues occur nearly exclusively through positive horizontal limb work, satisfying the goal of forward acceleration. Contrary to our hypothesis, however, positive mechanical work remains above that at vwalk even when decelerating. In these WRTs to slow running, positive mechanical work is remarkably high and is comprised nearly exclusively of vertical limb work. Vertical-to-horizontal work modulation may represent an optimization for achieving minimal and maximal vrun, respectively, while fulfilling an apparent necessity for energy input when initiating WRTs. Net work of the WRT steps was more evenly distributed across the ankle, knee and hip joints than expected. Absolute positive mechanical work exhibited a clearer modulation towards hip-based work at high accelerations (>3 m s−2), corroborating previous suggestions that the most proximal joints are preferentially recruited for locomotor tasks requiring high power and work production. In WRTs to very slow vrun values, high positive work is nevertheless done at the knee, indicating that modulation of joint work is not only dependent on the amount of work required but also the locomotor context.
KEY WORDS: Walk, Run, Gait transition, Joint work, Limb work
INTRODUCTION
Among the most universal locomotor patterns is the transition from walking to running to move faster. Many studies have investigated the biomechanical, physiological and/or psychological explanations for the spontaneous (self-selected) transition from walking to running in humans (WRT; Mercier et al., 1994; Hreljac, 1995; Mohler et al., 2007; Pires et al., 2014). These studies have generally involved constant-velocity locomotion and focused on the transition to running that occurs as walking velocity is increased beyond a threshold where walking is no longer the preferred gait. Although central to our understanding of human gait transition, these studies focused on WRT
velocities (∼2.0 m s−1) that are generally avoided during normal
locomotion. For example, it has been shown that, in towns and cities,
walking velocities range from approximately 0.75–1.8 m s−1
(Bornstein, 1979; Minetti et al., 1994). How these previous studies relate to the WRT that takes place from a slower, more natural, walking velocity is unclear. In many cases, the decision to transition from a walk to a run occurs not through an increase in walking velocity up until we experience discomfort, as has been the case in most WRT studies, but rather is achieved via a direct transition from slower, more comfortable walking. Surprisingly little data exists for the mechanics of the WRT from these typical habitual walking velocities. Further, relatively few studies have examined the mechanics of accelerating from walking to running during the actual transition steps themselves (although see Van Caekenberghe et al., 2010b; Segers et al., 2013). Thus, how the joints and limbs combine to achieve the WRT remains surprisingly poorly understood.
Studies assessing a range of constant-velocity walking and running indicate that the ankle is a key joint dictating the transition from fast walking to slow running (Neptune and Sasaki, 2005; Farris and Sawicki, 2011a,b; MacLeod et al., 2014; Pires et al., 2014). However, unlike constant-velocity analyses, WRT acceleration steps necessitate a net input of positive mechanical work and can thus be expected to have a distinct limb and joint mechanical pattern compared with both steady-velocity walking and running. Studies on humans indicate a greater reliance on proximal joints for net positive work production (Hubley and Wells, 1983; Roberts and Belliveau, 2005; Qiao and Jindrich, 2016). This shift in work distribution may be explained on the basis that long-fibered parallel muscles associated with the proximal joints have a greater capacity to perform mechanical work compared with the short-fibred pennate muscles of the distal limb (Biewener, 1998; Biewener and Roberts, 2000). Greater reliance on proximal joints to input high net positive work is nevertheless not universal. For example, turkeys performing bipedal running acceleration steps exhibit near equivalent net ankle and hip joint work across a range of acceleration levels (Roberts and Scales, 2004), and wallabies rely predominantly on net ankle work (McGowan et al., 2005). At a limb level, it has been demonstrated that as step acceleration increases in turkeys, negative work drops to zero such that net work is represented solely by positive work production (Roberts and Scales, 2002). In this study, the ratio of peak horizontal to vertical force increased substantially at higher accelerations. These results suggest that increasing acceleration may also be achieved through modulating the ratio of horizontal to vertical work. The details of how limb and joint work is modulated across WRT accelerations is not known for human gait.
The purpose of this study was to assess how mechanical work at the limbs (both horizontal and vertical work) and individual joints (ankle, knee and hip) is modulated as humans transition from a
preferred walking velocity (vwalk) to a variety of running velocities
(vrun; ranging from a sprint to a running velocity that is slower than
vwalk). While transitioning tovrunslower thanvwalkis unnatural, and
unlikely to occur under normal conditions, they are included to help
Received 1 December 2017; Accepted 13 June 2018
1School of Human Sciences, The University of Western Australia, Crawley,
WA 6009, Australia.2Biomechanics Laboratory, Department of Kinesiology,
Pennsylvania State University, University Park, PA 16803, USA.
*Author for correspondence ( [email protected])
N.J.P., 0000-0003-2749-500X; J.R., 0000-0003-2854-1776
Journal
of
Experimental
reveal more comprehensively the fundamental biomechanical control paradigms of the WRT. We have chosen to investigate both the net mechanical work at the limbs and joints as well as the absolute positive (and negative) work. In net work calculations, energy absorption and generation across the step cancel and thus they represent the overall effect that the specific limb or joint has on accelerating the center of mass (COM) between the start and end of the step. Absolute work captures the cumulative amount of positive (and negative) work that the joint delivers to the COM
within the step.Partitioning absolute positive and negative work is
important for understanding how the limb and joints accelerate the COM in cyclical movements that include periods of energy absorption and generation, where examining net work alone might obscure their role (Sasaki et al., 2009). Finally, partitioning the amount of work performed to accelerate the COM vertically versus horizontally further helps explain the functions of the limbs and individual joints across WRTs ranging from low to high acceleration.
We first hypothesized that, at the highest WRT accelerations, net work would be generated exclusively through positive mechanical work. We also hypothesized that positive work will decrease below
the value atvwalkwhen decelerating into a run and start to approach
zero, because an input of work is theoretically no longer a mechanical requirement. These predictions were based, in part, on data from fast-accelerating turkeys (Roberts and Scales, 2002, 2004) that provide among the most comprehensive data on bipedal acceleration steps. Secondly, we hypothesized that a greater reliance on mechanical work production at the proximal joints (knee and hip) and a reduced reliance on work at the distal joint (ankle) occurs with increasing WRT accelerations, similar to that observed in other human locomotor tasks when the requirement for positive mechanical work is high (Hubley and Wells, 1983; Roberts and Belliveau, 2005; Farris and Raiteri, 2017).
MATERIALS AND METHODS Participants
Ten healthy and recreationally active male participants with no history of major lower-limb injury were recruited for this study (age: 26.3±2.4 years; height: 174.9±6.8 cm; mass: 74.3±13.7 kg; means± s.d.). Previous work indicated that this sample size is suitable for detecting velocity-dependent effects on joint mechanics (Pires et al., 2014). All testing procedures were approved by the Human Research
Ethics Committee of the University of Western Australia. Written informed consent was obtained from all participants.
Walk-to-run conditions
Prior to conducting gait transition trials, the participants’average
self-selected ( preferred) walking velocity (vwalk) was determined
by having the participants walk 20 m through a gait laboratory (the velocity calculations are described in further detail below and in Fig. 1). Participants were subsequently instructed to change from
theirvwalkto one of five running velocities (referred to asvrun):
(1) avrunthat was slower than theirvwalk, (2) avrunthat was the
same as theirvwalk, (3) a jog, (4) a fast run and (5) a sprint. The five
vrun transitions were repeated a minimum of five times and
performed in random order to avoid order effects. The participants were instructed to initiate the transition so that their first transition step (referred to as S1) occurred on one force plate (2000 Hz; 9261A Kistler, 0.6×0.4 m Winterthur, Switzerland) and their subsequent step (referred to as S2) occurred on a second force plate (2000 Hz; BP12001200-4K AMTI 1.2 m×1.2 m, Watertown, MA, USA). The participants could choose whichever leg felt comfortable to initiate the transition step. They were instructed
to maintain theirvwalkprior to the transition step, irrespective of
the instructed transition velocity. If the walking velocity leading
up to the transition steps did not match within 0.3 m s−1of their
vwalk, the trials were repeated.
We conducted a secondary test where our participants were
instructed to change from theirvwalkto either (1) a walk faster than
theirvwalkor (2) a walk slower than theirvwalk.
List of symbols and abbreviations
CH,CV horizontal and vertical integration constants COM center of mass
FH,FV,FML horizontal, vertical and medio-lateral GRF acting on the limb
g gravitational constant (9.81 m s−2) GRF ground reaction force
m body mass
PH,PV,Ptot horizontal, vertical and total limb power
S1 Step 1
S2 Step 2
vH,vV,vML horizontal, vertical and medio-lateral center of mass velocity
vrun running velocity
vwalk preferred walking velocity
Wnet
H ;WHþ;WH net, positive and negative horizontal limb work
Wnet
V ;WVþ;WV net, positive and negative vertical limb work
Wnet
tot;Wtotþ;Wtot net, positive and negative total limb work WRT walk-to-run transition
Walking timing gates (vwalk)
Running timing gates (vrun)
2 m
2 m
2 m
2 m 1.2 m
0.6 m S1
[image:2.612.52.297.65.258.2]S2
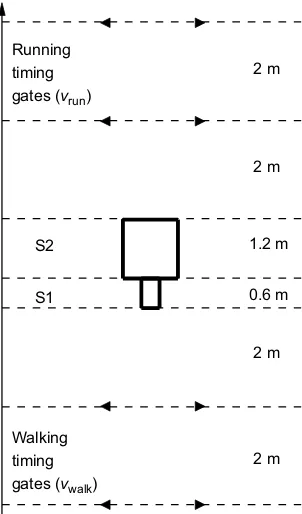
Fig. 1. Diagram of the laboratory set up.The preferred walking velocity (vwalk) was measured from timing gates separated by 2 m and placed 2 m in front of the first force plate. The first (S1) and second (S2) transition step velocities were measured from markers placed on the participant’s pelvis. S1 occurred on the first force plate [0.6 m (in the direction of motion) by 0.4 m]. S2 occurred on the second force plate (1.2 by 1.2 m). The final velocity (vrun) was measured from timing gates separated by 2 m and placed 2 m after the second
force plate.
Journal
of
Experimental
[image:2.612.363.514.392.649.2]Velocity and acceleration measurements
Thevwalkof the participants as they approached the transition step was
measured by a set of timing gates placed 2 m in front of the first force
plate.vrunwas measured by a second set of timing gates placed 2 m
after the second force-plate (Fig. 1). Thevrunreported in this study is
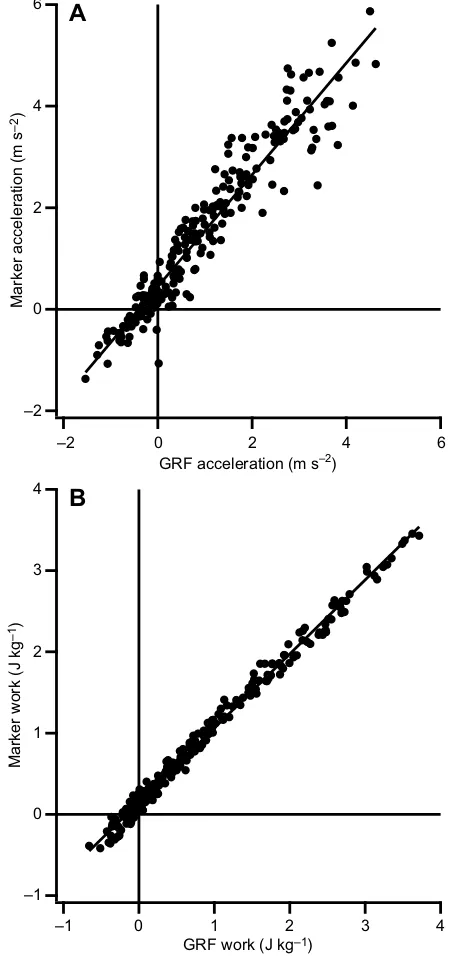
thus the running velocity that was achieved after the two recorded transition steps and not the velocity across these transition steps themselves. The average acceleration and velocity across the individual gait transition steps (S1 and S2) were computed by the mean horizontal acceleration and velocity of the mid-pelvis over the stance phase (heel strike to toe-off) of each respective step. As there was still a double support phase during S1, we were unable to calculate the COM acceleration and velocity of the complete S1 step using the ground reaction force (GRF) method (Donelan et al., 2002) as we did not have a force plate to measure the GRF of the contralateral foot during the double support phase. We did, however, compare the average pelvis linear horizontal acceleration with the acceleration calculated from numerical integration of the GRF of S2 when no double support was present (Donelan et al., 2002; see below for a detailed description of methodology). The average pelvis linear horizontal acceleration was found to be systematically slightly greater than the acceleration calculated from the GRF, but the two methods
were strongly correlated (r2=0.92 for the acceleration; Fig. 2A).
This difference resulted in slightly different slopes of mechanical work versus acceleration compared with using the GRF-derived acceleration, but did not alter the conclusions of the study.
Three-dimensional gait analysis and joint mechanics
For a detailed description of the three-dimensional (3D) gait analysis, joint moments and power calculations, please refer to Pires et al., (2014). Briefly, 3D GRFs (2000 Hz) and marker position data (250 Hz; 10 camera VICON MX motion analysis system; VICON Oxford Metrics, Oxford, UK) were captured whilst participants transitioned from walking to running. Prior to inverse dynamic modeling, marker position data and the GRFs were filtered using a fourth-order, 8 Hz low-pass Butterworth filter (filter frequency was selected by performing a residual analysis of filtered versus unfiltered data). Three-dimensional kinematic and inverse dynamic calculations were computed in Vicon Nexus and Bodybuilder software (VICON, Oxford Metrics, Oxford, UK) in accordance with Besier et al. (2003) and outlined in more detail in Pires et al. (2014).
Joint work calculations have also been previously detailed in Pires et al. (2014). Briefly, the net joint work for S1 and S2 were calculated from the time integral of the joint power curves, respectively, over the stance phase. Positive and negative joint work for S1 and S2 were calculated from the time integral of the positive and negative values of the joint power curves, respectively, over the stance phase.
Total joint powers for S1 and S2 were calculated by summing the instantaneous power traces at each joint. Net total joint mechanical work for S1 and S2 were calculated by integrating the values of the total joint power trace with respect to time. Positive and negative total joint mechanical work for S1 and S2 were calculated by integrating the positive and negative values of the total joint power trace with respect to time.
Limb mechanical work
The net, positive and negative horizontalðWnet
H ; WHþ; WHÞ, vertical
ðWnet
V ; WVþ; WVÞ and total ðWtotnet; Wtotþ; WtotÞ mechanical work
performed by each limb over the stance phase were calculated using
the‘individual limb method’outlined by Donelan et al. (2002). The
mechanical power produced by each lower limb in the horizontal
(PH) and vertical (PV) directions were computed as the dot product
of the horizontal and vertical external force acting on the limb (FH,
FV) and the horizontal and vertical velocity of the COM (vH,vV),
respectively:
PH¼FHvH ð1Þ
and
PV¼FVvV: ð2Þ
4
3
2
1
0
–1
Marker work (J kg
–1)
4 3
2 1
0 –1
GRF work (J kg–1)
B
6
4
2
0
–2
Marker acceleration (m s
–2)
6 4
2 0
–2
GRF acceleration (m s–2)
[image:3.612.326.554.61.540.2]A
Fig. 2. Comparison between marker- and GRF-derived acceleration and work.(A) Regression of the center of mass (COM) acceleration calculated from the ground reaction force (GRF) and the acceleration estimated from motion capture of markers placed on the participant’s (N=10) pelvis (line of best fit equation:amkr=1.10·aGRF+0.44;r2=0.92). (B) Regression of net mechanical limb work in S2 calculated from the GRF approach (see Materials and Methods) and the net mechanical limb work in S2 computed using the estimated COM velocity from markers placed on the participant’s pelvis (line of best fit equation:Wmkr=0.91·WGRF+0.15;r2=0.99).
Journal
of
Experimental
The total limb power generated on the body’s COM was computed from the sum of the horizontal, vertical and medio-lateral power:
Ptot¼ FHvHþFVvVþFMLvML; ð3Þ
where FML and vML are the medio-lateral GRF and COM
velocity, respectively. The COM velocities in each direction were estimated from the motion of the mid-pelvis measured using our motion capture system. Medio-lateral work was small and was not specifically assessed further in subsequent analyses. Net horizontal, net vertical and net total limb mechanical work were computed by integrating limb power over the stance phase:
Wnet
H ¼
ðtf
ti
PHdt; ð4Þ
Wnet
V ¼
ðtf
ti
PVdt; ð5Þ
Wnet
tot ¼
ðtf
ti
Ptotdt; ð6Þ
wheretfis foot off,tiis foot strike and dtis stance time.
Positive and negative horizontal, vertical and total limb mechanical work were computed by integrating limb power and restricting to positive and negative values, respectively:
Wþ
H ¼
ðtf
ti Pþ
Hdt; WH¼
ðtf
ti P
Hdt; ð7Þ
Wþ
V ¼
ðtf
ti Pþ
Vdt; WV¼
ðtf
ti P
Vdt; ð8Þ
Wþ
tot¼
ðtf
ti Pþ
totdt; Wtot¼
ðtf
ti P
totdt: ð9Þ
For S2, in which the entire stance phase is in single support, we assessed how the limb work calculated using the pelvis velocity compared with limb work calculated using a COM velocity derived from force plate recordings. For this comparison, the COM velocities in each direction were calculated by integrating the acceleration of the COM with respect to time. Horizontal and vertical COM accelerations were derived from the components of
the GRF and by the participants’body mass (and incorporating the
acceleration due to gravity in the vertical direction):
vH¼
ðtf
ti FH
m dtþCH; ð10Þ
vV¼
ð
tf
ti
FVmg
m dtþCV; ð11Þ
wheremis the body mass of the participants,gis the gravitational
acceleration (9.81 m s−2), andC
HandCVare integration constants.
The integration constants were calculated as the difference between
the average velocity (horizontal and vertical:vH,vV) of the pelvis
and the average horizontal and vertical velocity calculated from the
numerical integration of the GRF across the stance phase. The remainder of the work calculations were the same as those of
Eqns 1–9. The mechanical work calculation using the two separate
methods for S2 resulted in only very small differences that did not alter conclusions drawn in this study (Fig. 2B).
Statistics
In post-testing, the recordedvrunfrom the second timing gates were
grouped as follows: (1) <1.5 m s−1; (2) 1.5 m s−1<v
run<2.5 m s−1;
(3) 2.5 m s−1<v
run<3.5 m s−1; (4) 3.5 m s−1<vrun<4.5 m s−1; and
(5) >4.5 m s−1. Within these groups a one-way repeated measures
ANOVA (post hoccomparison with Bonferroni correction and a
significance level ofP<0.05) was used to compare velocity between
vwalk, the average velocity of S1 and S2, andvrun.
The limb and joint work measures of S1 and S2 for each participant were plotted against the average COM acceleration of each step. We determined whether a linear or curvilinear regression
line best fit each participant’s limb and joint work versus
acceleration data by increasing the order of the polynomial until the highest coefficient was no longer significantly different from 0. At this point, increasing the number of coefficients did not improve the fit of the data.
To assess the relationships between limb and joint work measures and acceleration, we first computed the work in both S1 and S2 at
accelerations common to all participants (−1.0, 0, 1.0, 2.0, 3.0, 4.0
and 5.0 m s−2) using the participant-specific regression equations
described above. Using these calculated values, we performed one-way repeated measures (seven acceleration levels) ANOVAs on S1
and S2 limb work measures at aP-level of <0.05. We also performed
a two-way ( joint: ankle, knee and hip) by seven repeated measures
ANOVA (seven acceleration levels) at a significance level ofP<0.05
for both S1 and S2 to assess how net, positive and negative joint work was modulated across acceleration. The same ANOVA was run on the percent contribution that each individual joint had to the summed net, positive and negative joint work, after performing an arc-sine
transformation. Post hoccomparisons with Bonferroni corrections
were used to determine significant differences between individual joints. If an interaction effect between joint and acceleration was present, we tested for significance between percent work contribution in individual joints at each acceleration; we used a paired-sample
Student’s t-test on arc-sine transformed data with Bonferroni
corrections for multiple comparisons. A paired-sample Student’s
t-test was used to determine whether there was a significant difference
between the total joint work performed in WRT accelerations versus that generated when the same acceleration was achieved by walking faster/slower.
RESULTS Step velocity
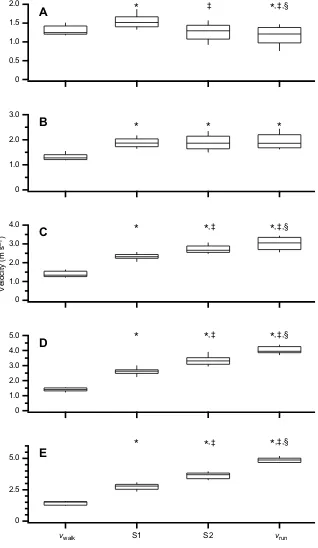
In the first step of the WRT (S1), irrespective of the instructed running velocity condition, our participants increased their
horizontal velocity (P<0.05; Fig. 3). When instructed to
transition to a run that was slower than their vwalk, our
participants increased horizontal velocity, but decelerated thereafter (Fig. 3A). Except for transitioning from walking to an
instructed run that was intended to be the same velocity as thevwalk
(∼1.5 m s−1), our participants were not able to achieve a
constant velocity between S2 and the finalvrun(Fig. 3B). When
transitioning to running velocities that were greater than 2.5 m s−1
(instructed‘fast runs’and‘sprints’), our participants’horizontal
velocity increased between all steps (Fig. 3C–E).
Journal
of
Experimental
Mechanical power
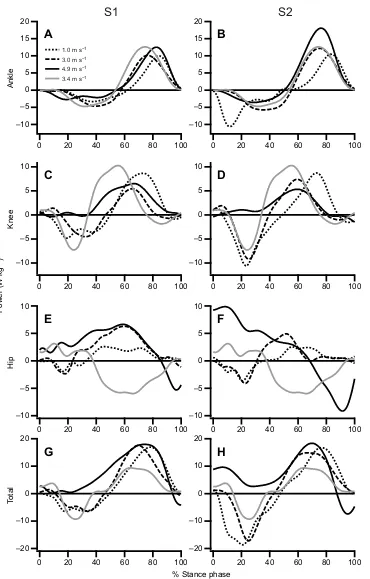
Example traces of the instantaneous ankle, knee and hip joint and total joint power plotted against the percentage of the stance phase for S1 and S2 are presented in Fig. 4. Owing to the quantity and spread of
data, individual traces were chosen that corresponded to avrunof 1.0,
3.0 and 5.0 m s−1. The participant’s self-selected constant-velocity
running trial (∼3.4 m s−1) is also included (Fig. 4).
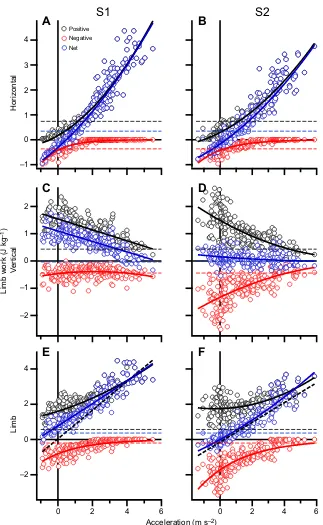
Vertical, horizontal and total limb work versus acceleration
There was a significant main effect of acceleration on all limb work measures for both S1 and S2, except for the vertical net work in S2
(P<0.05; Fig. 5). As expected, the net total limb work increased with
acceleration, but only became negative with a negative horizontal acceleration in S2 (Fig. 5E,F). Total negative limb work reduced to
near zero at accelerations above∼3 m s−2in S1 and 4 m s−2in S2.
Net work at these higher accelerations was therefore composed nearly exclusively of positive limb work. Positive total limb work increased with acceleration in S1 and S2, and was always above the
positive work ofvwalk. The positive and net horizontal mechanical
work in both S1 and S2 significantly increased as step acceleration
increased (Fig. 5A,B). At accelerations above 3–4 m s−2, net
horizontal work resulted purely from positive horizontal work
2.0
1.5
1.0
0.5
0
A
3.0
2.0
1.0
0
B
4.0
3.0
2.0
1.0
0
C
5.0 4.0 3.0 2.0 1.0 0
D
5.0
2.5
0
E
Velocity (m s
–1)
*
*
*
*
*
vwalk S1 S2 vrun
*
*
‡
*
, ,‡§*
, ,‡§*
, ,‡§*
, ,‡§*
,‡*
,‡ [image:5.612.53.371.59.607.2]*
,‡Fig. 3. Box and whisker plots of the preferred walking velocity (vwalk), S1 and S2 transition step velocity, and the final running velocity (vrun).Data have been
grouped by the followingvrunranges: (A) <1.5 m s−1; (B) 1.5 m s−1<v
run<2.5 m s−1; (C) 2.5 m s−1<vrun<3.5 m s−1; (D) 3.5 m s−1<v
run<4.5 m s−1; and (E) >4.5 m s−1. Velocities were measured at the start of the walkway (vwalk); the first step where they transitioned to a running gait over the force plate (S1); the second transition step over the second force plate (S2); and the end of the walkway as the participants ran (vrun).vwalkandvrunwere measured from timing gates placed 2 m either side of the force plates. The S1 and S2 velocities were measured from the average pelvis linear velocity measured over the stance phase for the respective step. Bonferronipost hocadjustment was used to identify significant differences between the respective steps: *P<0.05 betweenvwalkversus S1,vwalkversus S2 andvwalk versusvrun;‡P<0.05 between S1 versus S2 and S1 versusvrun;§P<0.05 between S2 andvrun.
Journal
of
Experimental
production. Conversely, the net (S1) and positive (S1 and S2)
vertical mechanical work significantly decreased as step
acceleration increased (Fig. 5C,D;P<0.05).
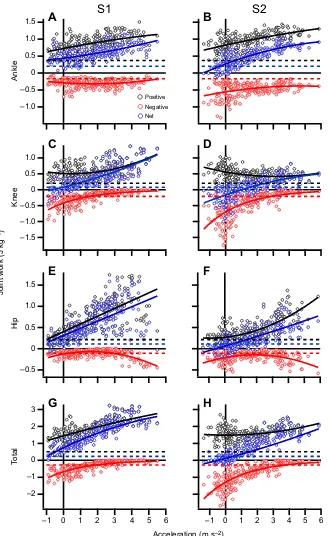
Mechanical joint work versus acceleration
A full description of the ANOVA results for net, positive and negative joint work are presented in Table 1. A main effect of acceleration was observed across the joints (ankle, knee and hip) for
net, positive and negative joint work (P<0.05; net and positive work
increased with increasing acceleration, whereas negative work decreased; Figs 6 and 7).
A main effect of joint was observed on net work in S1 and S2.
Post hoctests failed to identify any significant differences in net work between specific joints in S1. When the main effect of
acceleration across joints was investigated further, post hoctests
revealed that the ankle net work was statistically greater than the
20
15
10
5
0
–5
–10
Ankle
100 80 60 40 20 0
A
100 80 60 40 20 0
100 80 60 40 20
0 0 20 40 60 80 100
100 80 60 40 20
0 0 20 40 60 80 100
100 80 60 40 20
0 0 20 40 60 80 100
B
–10 –5 0 5 10
Knee
C
D
–10 –5 0 5 10
Hip
E
F
–20 –10 0 10 20
20
15
10
5
0
–5
–10
–10 –5 0 5 10
–10 –5 0 5 10
–20 –10 0 10 20
To
tal
G
H
% Stance phase
Power (W kg
–1)
S1
S2
[image:6.612.56.426.53.632.2]1.0 m s−1 3.0 m s−1 4.9 m s−1 3.4 m s−1
Fig. 4. Representative traces for the instantaneous ankle, knee, hip and total joint powers (body-mass normalized) for S1 and S2 plotted against the percent of the stance phase.Ankle (A,B), knee (C,D), hip (E,F) and total (G,H) powers are shown. The fine dotted line represents a WRT to avrun of 1.0 m s−1; the course broken line represents a WRT to avrunof 3.0 m s−1; and the solid black line represents a WRT to avrunof 4.9 m s−1. The solid grey line is an example trace of the joint power where the participant is running at a constant velocity of 3.4 m s−1(self-selected running velocity).
Journal
of
Experimental
knee and hip in S2 (P<0.05; Figs 6 and 7F). An interaction effect on net work was observed between joint and acceleration in S1
(P<0.05; Fig. 7F).Post hoctests on percent net work in S1 showed
that the ankle generates significantly more net work at low accelerations, whereas the hip generates more work at high
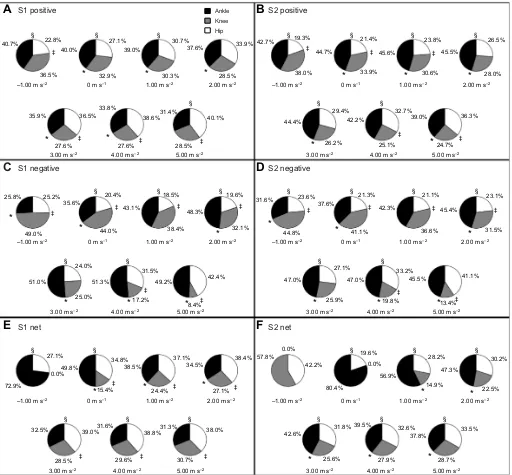
accelerations (P<0.05; Figs 7E and 8E).
A main effect of joint was also observed on positive work in both
S1 and S2.Post hoctests found that positive work at the ankle was
greater than the knee in S1, and was greater than the knee and hip in
S2 (P<0.05; Table 1, Figs 6 and 7A,B). An interaction effect on
positive work was observed between joint and acceleration in both S1
and S2 (P<0.05; Fig. 7A,B).Post hoctests on percent positive work
showed that the ankle and knee generate significantly more positive
work than the hip at low accelerations but that the hip increases its
relative contribution to positive work at high accelerations (P<0.05;
Figs 7A,B and 8A,B). In S1, the hip generates the most positive work
out of all joints (P<0.05; Figs 7A and 8A).
Apart from the positive work done by the hip joint during both steps (Fig. 6E,F), the positive mechanical work of each joint during the transition step was always greater than that of the positive
mechanical work of the joint when walking at thevwalk(horizontal
dashed lines in Fig. 6).
We did not make any specific hypotheses regarding the relative amount of negative work among joints. We did observe significant main effects of joint on negative work and interaction effects between joints and acceleration in both S1 and S2. In summary,
4
3
2
1
0
–1
A
2
1
0
–1
–2
C
4
2
0
–2
6 4
2 0
E
B
D
6 4 2 0
F
Acceleration (m s–2)
S1
S2
Limb work (J kg
–1)
Horizontal
V
ertical
Limb
[image:7.612.51.374.53.578.2]Positive Negative Net
Fig. 5. Positive, negative and net body-mass-specific mechanical limb work in S1 and S2 for each participant (n=10) versus acceleration.Horizontal (A,B), vertical (C,D) and total (E,F) limb work. Solid colored lines are lines of best fit. The horizontal broken black, red and blue lines represent the positive, negative and net mechanical limb work performed duringvwalk over one step, respectively. The thick dashed black line (E,F) represents the work required to accelerate the COM horizontally, calculated from the change in kinetic energy from the start to the end of the step.
Journal
of
Experimental
when negative work production is largest (during low and negative horizontal accelerations) most negative work is produced at the knee
(P<0.05; Figs 6 and 7C,D). Negative joint work is very small at high
acceleration, but that which is produced is primarily in the ankle and
hip (P<0.05; Figs 6 and 7C,D). A full description of the ANOVA
results for negative work are presented in Table 1.
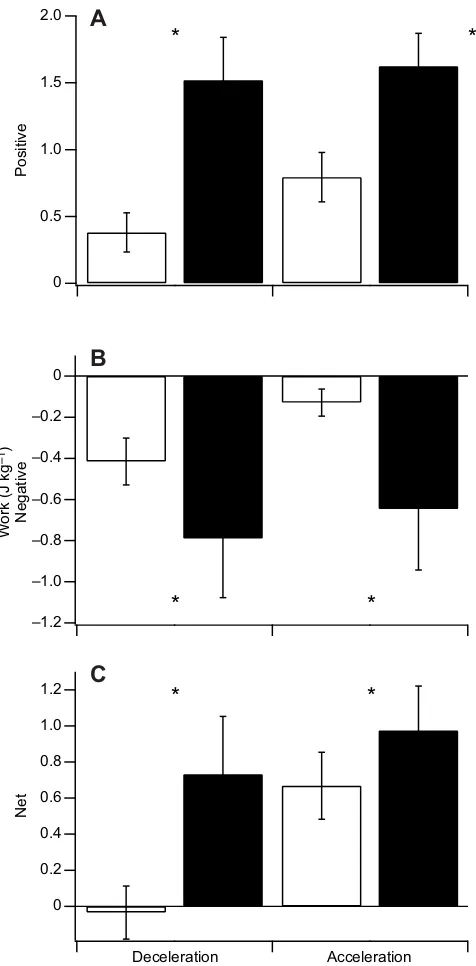
The positive, negative and net work required to both accelerate
(0.49±0.32 m s−2) and decelerate (−0.47±0.15 m s−2) from the
vwalkto faster/slower walking speeds was significantly less than the
work required to transition to a run with an equivalent acceleration
(P<0.05; Fig. 9).
DISCUSSION
General mechanical response to walk-to-run transition tasks
This study investigated limb and joint mechanics and their modulation during the transition from a preferred walking velocity to various targeted running velocities. The response to the instructed WRT was consistent across participants yet showed several unexpected features. First, we showed that humans have difficulty transitioning directly to a running gait that has a forward velocity equal to or slower than their preferred walking velocity (Fig. 3A,B). It is possible that the ability to directly decelerate from a walk to a very slow run is improved with practice. The challenge of decelerating into a slow run is supported by a total joint power profile that predominantly generates power, irrespective of whether the locomotor goal is to decelerate (Fig. 4G). Deceleration into a very slow run is instead primarily achieved in S2, after many of the participants had already transitioned to a run with an initial increase in forward velocity (Fig. 3A).
We also found that, when instructed to transition to a running gait
with‘jogging’through to‘sprinting’velocities, a constant velocity
is not achieved by the second (S2) step of the WRT (Figs 3, 6). Our analyses were limited to two steps and we cannot establish how many steps are required to achieve a constant forward velocity. Despite the inability of the participant to adhere strictly to the instructed transition tasks, a systematic response of the joints and limbs to a WRT spanning a broad range of running velocities and accelerations was observed.
Limb mechanical work as a function of the walk-to-run transition acceleration
In both S1 and S2, negative limb work (and negative total joint work) drops to zero as WRT acceleration increases (Figs 5, 6), supporting our hypothesis that humans, similar to avian bipeds, use purely positive mechanical work to achieve high forward acceleration. We also discovered that, in these high forward accelerations, humans generate nearly exclusive positive horizontal work. Together, these data show that humans generate work effectively when the goal is to accelerate the COM in the forward direction. Had negative work been
generated in high-acceleration steps, more positive work would be required to achieve the same net positive work. Likewise, if a greater portion of this work was directed in the vertical direction, more overall work would be required to generate the same horizontal work, and thus forward acceleration. Both these strategies theoretically minimize the muscle work required for high WRT accelerations. One way to gauge the effectiveness of the limb in accelerating the COM forward is to compare it to the theoretical mechanical work required to achieve the observed horizontal acceleration. This can be
computed as ð1=2mv2HfÞ ð1=2mv2HiÞ, where v2Hf and v2Hi are the
final and initial velocities of the COM during the WRT step, respectively. The theoretical horizontal work confirms that, at high WRT accelerations, the limb (and presumably muscles) produces work that is indeed devoted nearly purely to the task of forward
acceleration; nearly no mechanical work is ‘wasted’ in COM
deceleration or vertical acceleration (Fig. 5).
Contrary to our hypothesis, however, positive limb (and positive total joint work) was always above that during steady-velocity walking, irrespective of the WRT acceleration. WRTs to very slow velocities incur remarkably high positive work considering the goal is to decelerate, not accelerate, the COM. WRTs to slow RUN velocities are consequently also associated with a large increase in negative work. This is necessary to generate the net negative horizontal work (Fig. 5A,B) required for reducing the forward speed of the COM. It is noteworthy that, even though some participants could reduce their forward velocity in S1, no participants were able to do so with an overall reduction in net limb work (Fig. 5E), raising the question of whether an input of energy is a fundamental control paradigm of transitioning from walking to running.
The high mechanical cost of transitioning to very slow running velocities results nearly completely from the generation of positive vertical limb work (Fig. 5). Although producing additional mechanical work is undesirable, if an initial input of energy is indeed a constraint on the WRT then directing this energy in the vertical direction is the best way to minimize unwanted forward acceleration. This is because an input of vertical work will have a minimal effect on forward velocity. It has been previously reported that, when participants are freely allowed to transition from a walk to a run, there is a large increase in velocity (referred to as a velocity jump) during the transition step (Van Caekenberghe et al., 2010a,b; Segers et al., 2013). Our results indicate that this velocity jump is still present at slow velocities but, rather than occurring horizontally, it occurs vertically. The second step in the WRT (S2) showed the most pronounced increase in positive limb work in WRTs involving a reduction in forward velocity. In these transitions it is remarkable that positive limb work is nearly equivalent to that of transitioning from a walk to a sprint (Fig. 6H). Controlling WRTs to very slow runs thus, paradoxically, involves an increase in positive mechanical limb work, which is directed to accelerate the COM vertically.
Table 1. Joint work versus acceleration statistics
S1 S2
Two-way ANOVA Bonferroni Two-way ANOVA Bonferroni
Joint Accel. Int.
Ankle vs knee
Ankle vs hip
Knee vs
hip Joint Accel. Int.
Ankle vs knee
Ankle vs hip
Knee vs hip
Positive 0.009 <0.001 <0.001 0.039 1.00 0.074 <0.001 <0.001 <0.001 <0.001 <0.001 1.00 Negative <0.001 <0.001 <0.001 0.950 0.001 0.009 0.008 <0.001 <0.001 0.967 0.001 0.139
Net 0.017 <0.001 <0.001 0.237 0.661 0.057 <0.001 <0.001 0.926 0.002 0.001 0.190
P-values indicating ANOVA main effects of joint and acceleration (Accel.) and their interaction effect (Int.). Bonferronipost hoctests identify statistical differences between individual joints. Bold numbers signify statistical differences (P<0.05). For statistical differences between joints at specific levels of acceleration, please refer to Fig. 8.
Journal
of
Experimental
By parsing total joint work into vertical and horizontal work, we uncover a previously undescribed (to the best of our knowledge) modulation of limb work in WRTs. With transitions to faster running, there is a clear systematic reduction in vertical limb work and an increase in horizontal limb work. When transitioning to a sprint, limb work is directed nearly exclusively in the horizontal direction compared with the near exclusive vertical limb work when transitioning to very slow runs (Fig. 5). This modulation can be viewed as an optimization for maximal forward acceleration when the goal is to achieve maximal running velocity, and minimization of forward acceleration when the goal is to achieve minimal forward velocity.
Limb mechanics of WRTs: insights into gait transition energetics and gait selection
Previous studies have found that gait transition is metabolically expensive (Usherwood and Bertram, 2003), especially when compared with the cost of changing speed by walking faster and slower (Minetti et al., 2013; Seethapathi and Srinivasan, 2015). Although we do not assess metabolic energy cost directly, our data corroborates these observations. We found that a WRT step that does not alter gait velocity is more costly of positive mechanical work compared with a normal walking step at the same velocity [ positive work is used here as it is most closely associated with positive fiber
1.5
1.0
0.5
0
–0.5
–1.0
A
–1.5 –1.0 –0.5 0 0.5 1.0
C
1.5
1.0
0.5
0
–0.5
E
3
2
1
0
–1
–2
6 5 4 3 2 1 0 –1
G
B
D
F
6 5 4 3 2 1 0 –1
H
Acceleration (m s–2)
S1
S2
Joint work (J kg
–1)
Ankle
Knee
Hip
To
ta
l
[image:9.612.54.382.56.592.2]Positive Negative Net
Fig. 6. Grouped positive, negative and net body-mass-specific mechanical joint work for each participant (n=10).Values for the ankle (A,B), knee (C,D) and hip (E,F) joints, and the total joint work (G,H), are shown for S1 and S2 plotted against the participants’average acceleration. Solid colored lines are lines of best fit. The dashed black, red and blue horizontal lines represent the amount of positive, negative and net mechanical work produced by each joint, respectively (A–F), or the positive, negative and net total joint work (G,H), when participants walked at their preferred velocity (vwalk).
Journal
of
Experimental
work during gait (Sasaki et al., 2009) and metabolic energy (Woledge et al., 1985)]. We also found that changing velocity by walking faster/ slower uses considerably less positive mechanical work than a gait transition to the same velocity (Fig. 9). These findings offer a possible mechanical underpinning to the relative costs of gait transitions and walking velocity oscillations, although comparisons to previous studies are complicated by the fact that these involved continuous walking/running in treadmill-bases experiments.
In addition to gait transition costs, our data provides insight into gait selection behavior. In an elegant study, Long and Srinivasan (2013) showed that human participants often use mixtures of walking and running gaits in an energetically optimal way to reach their destination. When the average velocity required for the journey
decreased below ∼2 m s−1, however, participants used nearly
exclusively a range of walking velocities. Our findings afford an explanation for this demarcation. First, transitions from walking to running are (unnecessarily) mechanically and metabolically expensive at these slow velocities and oscillating between walking slow and fast may instead be the most economical gait pattern. Furthermore, the very high mechanical cost of switching from walking to running at relatively slow velocities might diminish
the benefit of walk–run mixtures utilizing slow, but metabolically
economical, running velocities (2–2.5 m s−1; Long and Srinivasan,
2013). These possible influences of WRT costs on gait behavior should in theory be amplified when distances are short and the relative cost of WRTs to the total cost of the journey are high.
1.5
1.0
0.5
0.0
A
–1.5 –1.0 –0.5
0.0
C
–1.5 –1.0 –0.5 0 0.5 1.0 1.5
6 5 4 3 2 1 0
–1 –1 0 1 2 3 4 5 6
E
B
D
F
Acceleration (m s–2)
S1
S2
Joint work (J kg
–1)
Positive
Negative
Net
[image:10.612.51.385.54.578.2]Ankle Knee Hip
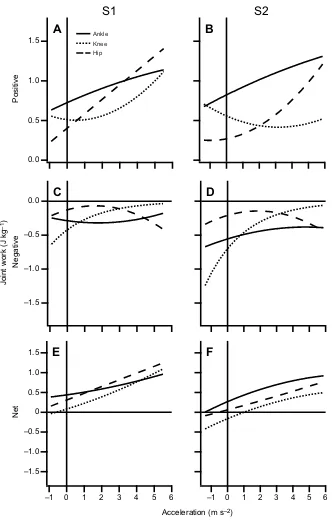
Fig. 7. The lines of best fit for positive, negative and net joint work versus acceleration for the ankle, knee and hip.The plots highlight the joint’s contribution to the mechanical work of the step and how these contributions change with increasing acceleration.
Journal
of
Experimental
Modulation of net joint work in walk-to-run transitions
We observed a more even distribution of net work across WRT accelerations than what was expected. Previous studies of incline running and jumping have found that the hip contributes substantially to the net mechanical work required to raise the COM (Roberts and Belliveau, 2005; Hubley and Wells, 1983). During incline running, it has been found that humans even decrease their net ankle work between moderate and steep inclines, relying purely on the hip to provide the additional COM mechanical work (Roberts and Belliveau, 2005). In contrast, we found that, overall, the ankle was at least equally important in providing net positive mechanical work as the hip in WRTs (ANOVA main effect). In fact,
in S2, the ankle bore the largest contribution to net work production even at the highest accelerations (Fig. 8F). Also noteworthy is the relatively large contribution of net positive mechanical work at the knee, especially in S1 (Figs 6C, 7E and 8E), which stands in contrast to the exclusive net negative knee work observed in human incline running. The obvious difference between the work distribution in incline running and jumping and the work distribution of the WRT is that work in WRTs is required to accelerate the COM forward, compared with vertical acceleration in the previous two tasks. This demonstrates that modulation of net joint work is not necessarily
dictated by muscle–tendon architecture as much as it is by the
mechanics of the locomotor task itself. Interestingly, the observed
A
S1 positive S2 positiveC
S1 negativeS1 net S2 net
S2 negative §
22.8%
36.5%
–1.00 m s–2
3.00 m s–2
–1.00 m s–2
3.00 m s–2
–1.00 m s–2
3.00 m s–2 4.00 m s–2 5.00 m s–2
0 m s–1 1.00 m s–2 2.00 m s–2
4.00 m s–2 5.00 m s–2 3.00 m s–2 4.00 m s–2 5.00 m s–2
3.00 m s–2 4.00 m s–2 5.00 m s–2
1.00 m s–2 2.00 m s–2
0 m s–1
4.00 m s–2 5.00 m s–2
40.7% 35.9% 25.8% 35.6% 48.3% 43.1%
44.0% 38.4% 32.1%
25.2% 20.4% 24.0% 31.5% 42.4% 49.2% 51.0% 51.3% 25.0% 17.2% 8.4% 18.5% 19.6% 31.6% 37.6%
21.3% 21.1% 23.1%
41.1% 27.1% 0.0% 42.2% 19.6% 31.8% 32.6% 37.8% 33.5% 39.5% 27.9% 28.7% 42.6% 25.6% 28.2% 47.3% 30.2% 22.5% 14.9% 56.9% 0.0% 80.4% 57.8% 33.2% 47.0% 19.8% 13.4% 41.1% 45.5% 25.9% 47.0% § § § § § § § § 36.6% 31.5% 45.4% 42.3% 23.6% 44.8% § § § § § § 27.1% 39.0% 38.8%
32.5% 31.6% 31.3% 38.0%
28.5% 29.6% 30.7%
0.0% 72.9% 15.4% 49.8% 34.8% 38.5% 37.1% 34.5% 38.4% 24.4% 27.1% § § § § 49.0% 36.5% ‡ ‡ § § 27.1% 32.9%
0 m s–1
40.0% * * § § § 30.7% 33.9% 33.8% 31.4% 30.3% 28.5%
27.6% * 27.6% ‡ 28.5% ‡
1.00 m s–2 2.00 m s–2 –1.00 m s–2 0 m s–1 1.00 m s–2 2.00 m s–2
3.00 m s–2 4.00 m s–2 5.00 m s–2
–1.00 m s–2 0 m s–1 1.00 m s–2 2.00 m s–2
–1.00 m s–2 0 m s–1 1.00 m s–2 2.00 m s–2
[image:11.612.52.564.57.532.2]39.0% 38.6% 40.1% 37.6% 19.3% 21.4% 44.7% 33.9% 30.6% 23.8% 26.5% 45.5% 28.0% 45.6% 38.0% 29.4% 42.2% 32.7% 39.0% 36.3% 24.7% 25.1% 44.4% 26.2% 42.7% * * ‡ ‡ ‡ ‡ ‡ ‡ * * * * * * ‡ ‡ ‡ ‡ * * ‡ * ‡
E
B
D
F
‡ ‡ * § ‡ * § * § * § ‡ ‡ * § ‡ * § ‡ ‡ ‡ * § § ‡ ‡ * * * * * * * * * Ankle Knee HipFig. 8. The group average (n=10) percent joint work of the summed positive, negative and net joint work in S1 and S2.Ankle (black); knee (gray); hip (white). Percent contribution was computed at accelerations of−1.0, 0, 1.0, 2.0, 3.0, 4.0 and 5.0 m s−2. To assess the contribution of each joint to net mechanical work, if the total net work was positive or negative, only the joints that were producing net positive or negative work, respectively, were included in the calculation of the percent joint work contribution. The symbols (*,‡,§) represent a significant difference between the ankle and knee, the knee and hip, and the ankle and hip, respectively (P<0.05).
Journal
of
Experimental
net work distribution between joints resembles those of other bipeds, turkeys and wallabies, undergoing a similar range of horizontal accelerations (Roberts and Scales, 2004; McGowan et al., 2005).
Notwithstanding the large contribution of the ankle to net work, our data does partially support our hypothesis that high acceleration WRTs are achieved by an increased reliance on net work at proximal joints, specifically the hip. This can be seen by the switch to
predominantly hip-based net work production above 3 m s−2in S1
(Fig. 8E). That this does not occur in S2, however, further illustrates that a distal-to-proximal modulation of net joint work depends on the locomotor context, not simply the magnitude of the required mechanical work. It is also noteworthy that the knee is responsible for the majority of the energy absorption (net negative work) during deceleration WRTs (Fig. 8F). This is consistent with the primary energy absorption role of the knee joint during constant-velocity walking and running (Novacheck, 1998; Hreljac et al., 2008; Farris and Sawicki, 2011b; Pires et al., 2014).
Modulation of positive joint work in walk-to-run transitions
During gait, absolute positive joint work is a much closer estimate of total positive muscle fiber work than net joint work (Sasaki et al., 2009) and, therefore, modulation of positive joint work (more so
than net work) may be more closely linked with muscle–tendon
architecture. Indeed, positive hip joint work in both S1 and S2 better align with our hypothesis that higher accelerations lead to a greater reliance on mechanical work production at proximal joints. These results also corroborate those of other studies investigating horizontal acceleration movements in humans showing an increased reliance on the hip for positive work (Belli et al., 2002; Farris and Raiteri, 2017).
A common explanation for a distal-to-proximal shift in work production has been that proximal joints are powered by strap-like muscles with long parallel fibers that are thought to be better suited to producing positive mechanical work compared with shorter, pennate, fibered muscles. Although the mass-specific work capacity of pennate muscles are not lower (any loss in shortening capacity due to short fibers can be offset by an increase in force capacity due
to greater cross-sectional area), under high power demands, force–
length–velocity effects may limit their force, and thus work capacity
(Biewener and Roberts, 2000). An additional constraint on work capacity in distal muscles may be related to tendon compliance. Tendon compliance has the ability to affect muscle dynamics significantly, in particular as the time course for force production decreases (Lichtwark and Wilson, 2006; Lichtwark et al., 2007; Rosario et al., 2016). For example, it has been hypothesized that fast walking is avoided because the gastrocnemius and soleus must undergo rapid shortening that reduces force capacity due to fiber
force–velocity effects (Neptune and Sasaki, 2005; Farris and
Sawicki, 2011a). Similarly, using a simulation approach, Dorn et al. (2012) found that, when humans approach sprinting velocities, the triceps surae also shortens under high velocity and likewise has a compromised force capacity at these fast running velocities. It is possible that the interaction between the compliant Achilles tendon and the fiber mechanics of the triceps surae underscores the observed shift to greater reliance on the hip for positive work production during high-acceleration movements. Interestingly, greyhounds, which are characterized by highly compliant distal tendons, have similarly been shown to switch from positive joint work at the ankle to positive hip joint work as
whole-body acceleration requirements increase (Williams
et al., 2009).
We also demonstrate that, like net work, high positive mechanical work output is not limited to the hip joint. When transitioning to very slow running velocities, a surprisingly large amount of positive work is performed by the knee joint (Figs 6C,D and 7A,B). It is not clear why the knee, as opposed to the other joints, is used to produce the positive work in WRTs to slow running. One reason may be that the knee is better suited to produce vertical work compared with the hip. The predominant use of the knee extensors to power vertical jumping in humans provides support for this interpretation (Hubley
2.0
1.5
1.0
0.5
0
Positive
Deceleration Acceleration
A
–1.2 –1.0 –0.8 –0.6 –0.4 –0.2 0
Negative
B
1.2
1.0
0.8
0.6
0.4
0.2
0
Net
C
W
ork (J kg
–1)
*
*
*
*
[image:12.612.55.293.58.541.2]*
*
Fig. 9. Positive, negative and net total joint work.Work was measured as participants accelerated (0.49±0.32 m s−2) or decelerated (−0.47±0.15 m s−2) without changing gait (continuous walking; white bars) versus when transitioning to a run (WRT) with the same acceleration and deceleration [black bars; data are only presented for the first step of the WRT (S1)]. The asterisk (*) indicates a significant difference between the work generated in the walking acceleration/deceleration and that generated in the WRT acceleration/ deceleration (P<0.05).
Journal
of
Experimental
and Wells, 1983; Jacobs et al., 1996). We propose that the knee is preferentially recruited for positive vertical work, whereas the hip is recruited for positive horizontal work production in WRTs. This interpretation is borne from the combined modulation between positive knee and hip work and positive vertical and horizontal limb work across WRT accelerations. This is most apparent in S2, where the knee and hip exhibit a near opposite response to a change in WRT acceleration; here, the knee reduces positive work output at high accelerations that require predominantly horizontal work (Figs 6D, 7A). It is not clear whether this should result from any musculoskeletal architectural differences between knee and hip muscles, although it has been demonstrated, at least in cat locomotion, that certain muscles are more strongly related to controlling vertical versus horizontal GRFs (Kaya et al., 2006).
Limitations
This study focused solely on joint-level inverse dynamic analyses, and so represents the net effect of all muscles and structures of the joints. We have not taken into account co-contraction between antagonist muscles, force sharing between synergist muscles, energy transfer between joints, or the distribution of work and power between muscle fibers and tendons. The approach we have taken in this study may thus not reflect the mechanics of individual muscles. It also is possible that training may improve the effectiveness of unnaturally slow transition velocities, possibly altering their limb and joint mechanics.
Competing interests
The authors declare no competing or financial interests.
Author contributions
Conceptualization: N.J.P., B.S.L., J.R.; Methodology: N.J.P., B.S.L., J.R.; Software: N.J.P.; Validation: J.R.; Formal analysis: N.J.P., J.R.; Investigation: N.J.P.; Data curation: N.J.P.; Writing - original draft: N.J.P.; Writing - review & editing: N.J.P., B.S.L., J.R.; Supervision: B.S.L., J.R.; Project administration: J.R.
Funding
This work was supported by an Australian Postgraduate Award scholarship to N.J.P through the University of Western Australia.
Data availability
Data are available from Penn State’s data repository site, ScholarSphere (Pires et al., 2018): https://doi.org/10.18113/S1N06P.
References
Belli, A., Kyröläinen, H. and Komi, P. V.(2002). Moment and power of lower limb joints in running.Int. J. Sports Med.23, 136-141.
Besier, T. F., Sturneiks, D. L., Alderson, J. A. and Lloyd, D. G. (2003). Repeatability of gait data using a functional hip joint centre and a mean helical knee axis.J. Biomech.36, 1159-1168.
Biewener, A. A.(1998). Muscle function in vivo: a comparison of muscles used for elastic energy savings versus muscles used to generate mechanical power1.Am. Zool.38, 703-717.
Biewener, A. A. and Roberts, T. J.(2000). Muscle and tendon contributions to force, work, and elastic energy savings: a comparative perspective.Excersice Sport Sci. Rev.28, 99-107.
Bornstein, M.(1979). The pace of life: revisited.Int. J. Psychol.
Donelan, J. M., Kram, R. and Kuo, A. D.(2002). Simultaneous positive and negative external mechanical work in human walking.J. Biomech.35, 117-124.
Dorn, T. W., Schache, A. G. and Pandy, M. G.(2012). Muscular strategy shift in human running: dependence of running speed on hip and ankle muscle performance.J. Exp. Biol.215, 2347-2347.
Farris, D. J. and Sawicki, G. S.(2011a). Human medial gastrocnemius force-velocity behavior shifts with locomotion speed and gait.Proc. Natl. Acad. Sci. USA
109, 977-982.
Farris, D. J. and Sawicki, G. S.(2011b). The mechanics and energetics of human walking and running: a joint level perspective.J. R. Soc. Interface9, 110-118.
Farris, D. J. and Raiteri, B. J.(2017). Modulation of leg joint function to produce emulated acceleration during walking and running in humans.R. Soc. Open Sci.
4, 160901.
Hreljac, A. (1995). Determinants of the gait transition speed during human locomotion: kinematic factors.Biomechanics28, 669-677.
Hreljac, A., Imamura, R. T., Escamilla, R. F., Edwards, W. B. and MacLeod, T. D.
(2008). The relationship between joint kinetic factors and the walk-run gait transition speed during human locomotion.J. Appl. Biomech.24, 149-157.
Hubley, C. L. and Wells, R. P.(1983). A work-energy approach to determine individual joint contributionsto vertical jump performance.Eur. J. Appl. Physiol.50, 247-254.
Jacobs, R., Bobbert, M. F. and Van Ingen Schenau, G. J.(1996). Mechanical output from individual muscles during explosive leg extensions: the role of biarticular muscles.J. Biomech.29, 513-523.
Kaya, M., Leonard, T. R. and Herzog, W.(2006). Control of ground reaction forces by hindlimb muscles during cat locomotion.J. Biomech.39, 2752-2766.
Lichtwark, G. A. and Wilson, A. M.(2006). Interactions between the human gastrocnemius muscle and the Achilles tendon during incline, level and decline locomotion.J. Exp. Biol.209, 4379-4388.
Lichtwark, G. A., Bougoulias, K. and Wilson, A. M.(2007). Muscle fascicle and series elastic element length changes along the length of the human gastrocnemius during walking and running.J. Biomech.40, 157-164.
Long, L. L. and Srinivasan, M.(2013). Walking, running, and resting under time, distance, and average speed constraints: optimality of walk-run-rest mixtures.
J. R. Soc. Interface10, 20120980-20120980.
MacLeod, T. D., Hreljac, A. and Imamura, R.(2014). Changes in the preferred transition speed with added mass to the foot.J. Appl. Biomech.30, 95-103.
McGowan, C. P., Baudinette, R. V. and Biewener, A. A.(2005). Joint work and power associated with acceleration and deceleration in tammar wallabies (Macropus eugenii).J. Exp. Biol.208, 41-53.
Mercier, J., Gallais, D. Le, Durand, M., Goudal, C., Micallef, J. P. and Prefaut, C.
(1994). Energy expenditure and cardiorespiratory responses at the transition between walking and running.Eur. J. Appl. Physiol. Occup. Physiol.69, 525-529.
Minetti, A. E., Ardigò, L. P. and Saibene, F. P.(1994). The transition between walking and running in humans: metabolic and mechanical aspects at different gradients.Acta Physiol. Scand.150, 315-323.
Minetti, A. E., Gaudino, P., Seminati, E. and Cazzola, D.(2013). The cost of transport of human running is not affected, as in walking, by wide acceleration/ deceleration cycles.J. Appl. Physiol.114, 498-503.
Mohler, B. J., Thompson, W. B., Creem-Regehr, S. H., Pick, H. L. and Warren, W. H.(2007). Visual flow influences gait transition speed and preferred walking speed.Exp. Brain Res.181, 221-228.
Neptune, R. R. and Sasaki, K.(2005). Ankle plantar flexor force production is an important determinant of the preferred walk-to-run transition speed.J. Exp. Biol.
208, 799-808.
Novacheck, T. F.(1998). The biomechanics of running.Gait Posture7, 77-95.
Pires, N. J., Lay, B. S. and Rubenson, J.(2014). Joint-level mechanics of the walk-to-run transition in humans.J. Exp. Biol.217, 3519-3527.
Pires, N. J., Lay, B. S. and Rubenson, J.(2018). Data for: Modulation of joint and limb mechanical work in walk-to-run transition steps in humans. ScholarSphere. DOI: 10.18113/S1N06P.
Qiao, M. and Jindrich, D. L.(2016). Leg joint function during walking acceleration and deceleration.J. Biomech.49, 66-72.
Roberts, T. J. and Belliveau, R. A.(2005). Sources of mechanical power for uphill running in humans.J. Exp. Biol.208, 1963-1970.
Roberts, T. J. and Scales, J. A.(2002). Mechanical power output during running accelerations in wild turkeys.J. Exp. Biol.205, 1485-1494.
Roberts, T. J. and Scales, J. A.(2004). Adjusting muscle function to demand: joint work during acceleration in wild turkeys.J. Exp. Biol.207, 4165-4174.
Rosario, M. V., Sutton, G. P., Patek, S. N. and Sawicki, G. S.(2016). Muscle– spring dynamics in time-limited, elastic movements.Proc. R. Soc. B Biol. Sci.283, 20161561.
Sasaki, K., Neptune, R. R. and Kautz, S. A.(2009). The relationships between muscle, external, internal and joint mechanical work during normal walking.
J. Exp. Biol.212, 738-744.
Seethapathi, N. and Srinivasan, M. (2015). The metabolic cost of changing walking speeds is significant, implies lower optimal speeds for shorter distances, and increases daily energy estimates.Biol. Lett.11, 10-13.
Segers, V., De Smet, K., Van Caekenberghe, I., Aerts, P. and De Clercq, D.
(2013). Biomechanics of spontaneous overground walk-to-run transition.J. Exp. Biol.216, 3047-3054.
Usherwood, J. R. and Bertram, J. E. A.(2003). Gait transition cost in humans.
Eur. J. Appl. Physiol.90, 647-650.
Van Caekenberghe, I., Segers, V., De Smet, K., Aerts, P. and De Clercq, D.
(2010a). Influence of treadmill acceleration on actual walk-to-run transition.Gait Posture31, 52-56.
Van Caekenberghe, I., De Smet, K., Segers, V. and De Clercq, D.(2010b). Overground vs. treadmill walk-to-run transition.Gait Posture31, 420-428.
Williams, S. B., Usherwood, J. R., Jespers, K., Channon, A. J. and Wilson, A. M.
(2009). Exploring the mechanical basis for acceleration: pelvic limb locomotor function during accelerations in racing greyhounds (Canis familiaris).J. Exp. Biol.
212, 550-565.
Woledge, R. C., Curtin, N. A. and Homsher, E.(1985). Energetic aspects of muscle contraction.Medicine41, 1-357.