warwick.ac.uk/lib-publications
A Thesis Submitted for the Degree of PhD at the University of Warwick
Permanent WRAP URL:
http://wrap.warwick.ac.uk/89561
Copyright and reuse:
This thesis is made available online and is protected by original copyright. Please scroll down to view the document itself.
Please refer to the repository record for this item for information to help you to cite it. Our policy information is available from the repository home page.
Nanostructured Electroactive Materials:
Applications in Electroanalysis and
Electrocatalysis
By Peisan E (Sharel)
A thesis submitted for the degree of Doctor of Philosophy
Department of Chemistry
University of Warwick
I
Table of contents
Table of contents ... I List of figures ... V List of tables ... XII Acknowledgements ... XIII Declaration ... XIV Abstract ... XVI Abbreviations ... XVII Glossary of terms ... XX
Chapter 1 Introduction ... 1
1.1 Dynamic electrochemistry ... 1
1.1.1 Mass transport ... 2
1.1.2 Electron transfer kinetics ... 4
1.1.3 Cyclic voltammetry (CV) ... 6
1.1.4 Scanning electrochemical cell microscopy ... 9
1.2 Introduction to carbon materials ... 11
1.2.1 Structural properties of carbon nanotubes ... 12
1.2.2 Carbon nanotube network growth ... 15
1.2.3 Modification of carbon nanotubes ... 16
1.2.4 Applications of carbon-based nanostructures for electrocatalysis ... 19
1.3 Introduction to Li-O2 batteries ... 25
1.3.1 Formation of Li2O2 toroid ... 26
1.4 Aims of thesis ... 28
1.5 References ... 30
Chapter 2 Experimental ... 44
2.1 Chemicals ... 44
2.2 Single-walled carbon nanotube network growth ... 47
2.3 Functionalization of Single-walled carbon nanotube networks ... 48
2.4 Gold evaporation ... 49
2.5 Droplet experiments ... 49
2.6 Micro-capillary electrochemical method (MCEM) ... 50
II
2.8 Environmental scanning electrochemical cell microscopy ... 54
2.9 Characterization techniques ... 55
2.9.1 Optical microscopy ... 55
2.9.2 Atomic force microscopy ... 55
2.9.3 Field emission-scanning electron microscopy ... 55
2.9.4 High resolution-transmission electron microscopy (HR-TEM) ... 56
2.9.5 Micro-Raman microscopy ... 57
2.10 References ... 58
Chapter 3 Controlled functionalization of single-walled carbon nanotube network electrodes for the enhanced voltammetric detection of dopamine ... 60
3.1 Introduction ... 61
3.2 Experimental ... 64
3.2.1 Single-walled carbon nanotube network growth ... 64
3.2.2 Functionalization of single-walled carbon nanotube networks ... 65
3.2.3 Single-walled carbon nanotube networks characterization ... 65
3.2.4 Single-walled carbon nanotube electrode fabrication and micro-capillary electrochemical method setup ... 66
3.2.5 Chemicals and solutions ... 67
3.3 Results and discussion... 68
3.3.1 Growth, functionalization and characterization of low density and high density single-walled carbon nanotube networks ... 68
3.3.2 FcTMA+ oxidation ... 74
3.3.3 Dopamine detection ... 75
3.4 Conclusions ... 81
3.5 References ... 83
Chapter 4 Quantitative trace level electrochemical detection in complex aqueous media: comparison of single-walled carbon nanotube network electrodes and screen-printed carbon electrodes as voltammetric electrochemical sensors... 89
4.1 Introduction ... 90
4.2 Experimental ... 92
4.2.1 Chemicals and solutions ... 92
4.2.2 Electrode materials ... 93
4.2.3 Single-walled carbon nanotube network electrodes and screen-printed carbon electrodes characterization ... 94
4.2.4 Droplet experiments ... 94
III
4.3.1 Characterization of low, high and super high density single-walled carbon nanotube network electrodes and comparison with screen-printed carbon
electrodes ... 95
4.3.2 Evaluation of diffusion coefficients of solutions with and without polymers ... 99
4.3.3 Cyclic voltammetry response and detection limit of low, high and super high density single-walled carbon nanotube network electrodes compared to screen-printed carbon electrodes ... 100
4.3.4 Differential pulse voltammetry response of low, high and super high density single-walled carbon nanotube network electrodes and screen-printed carbon electrodes ... 102
4.3.5 Surface fouling studies on electrodes ... 105
4.4 Conclusions ... 107
4.5 References ... 109
Chapter 5 Electrodeposition of nickel hydroxide nanoparticles on carbon nanotube electrodes: correlation of particle crystallography with electrocatalytic properties 114 5.1 Introduction ... 115
5.2 Experimental ... 118
5.2.1 Electrodeposition of Ni(OH)2 on single-walled carbon nanotube network electrodes ... 118
5.2.2 Material characterization ... 120
5.2.3 Electrocatalytic measurements ... 120
5.3 Results and discussion... 121
5.3.1 Ni(OH)2 formation on single-walled carbon nanotube network electrodes ... 121
5.3.2 Methanol oxidation reaction and ethanol oxidation reaction on Ni(OH)2 nanoparticles modified single-walled carbon nanotube network electrodes.... 129
5.4 Conclusions ... 135
5.5 References ... 138
Chapter 6 Nanoscale electrocatalysis of hydrazine electro-oxidation at blistered graphite electrodes ... 146
6.1 Introduction ... 147
6.2 Experimental ... 149
6.2.1 Materials ... 149
6.2.2 Droplet experiments ... 149
6.2.3 Hopping scanning electrochemical cell microscopy-linear sweep voltammetry experiments ... 150
6.2.4 Micro-Raman and atomic force microscopy experiments ... 151
IV
6.3.1 Surface blistering of highly oriented pyrolytic graphite ... 152
6.3.2 Characterization of surface blisters on highly oriented pyrolytic graphite using atomic force microscopy and Raman microscopy ... 155
6.3.3 Scanning electrochemical cell microscopy imaging at the “blistered” highly oriented pyrolytic graphite for hydrazine oxidation ... 158
6.4 Conclusions ... 164
6.5 References ... 166
Chapter 7 Visualization of Redox Activity of Li2O2 in non-aqueous media: conformal layer vs. toroid structure ... 172
7.1 Introduction ... 173
7.2 Experimental ... 173
7.2.1 Materials ... 173
7.2.2 Li2O2 growth ... 174
7.2.3 Field emission-scanning electron microscopy, micro-Raman and atomic force microscopy experiments ... 175
7.2.4 Poly (glycidyl methacrylate) ... 175
7.2.5 Gel-polymer electrolyte ... 176
7.2.6 Hopping scanning electrochemical cell microscopy-cyclic voltammetry experiments ... 176
7.3 Results and discussion... 178
7.3.1 Li2O2 growth and characterization ... 179
7.3.2 Gel polymer electrolyte ... 181
7.3.3 Scanning electrochemical cell microscopy imaging at the Li2O2 products ... 182
7.4 Conclusions ... 187
7.5 Future work ... 187
7.6 References ... 188
V
List of figures
VI
deposited on the mica substrate, CVs at (a and c) the bare GC and (b and d) RGSs/GC electrode (a and b) in the absence and (c and d) in the presence of 10 mM HZ in 0.1 M KOH solutions. RGSs/GC electrode displays high electrocatalytic activity towards the oxidation of HZ with lower overpotential and a higher peak current as compared to bare GC.123 ... 22 Figure 1.13 (a) A schematic depicting the two-step solution method to prepare the Pt/Ni(OH)2/rGO-4 materials. (b) Corresponding transmission electron microscopy
(TEM) image of ternary hybrid materials, CV curves of Pt/Ni(OH)2/rGO-4, Pt/rGO
hybrid and standard 20 wt % Pt/C in 1 M methanol/1 M KOH, short-term durability measurement at ‒0.30 VSCE for Pt/Ni(OH)2/rGO-4, Pt/rGO, standard 20 wt % Pt/C and
20 wt % PtRu/C. Pt/Ni(OH)2/rGO-4 electrode displays exceptional activity and
durability towards efficient MOR.131 ... 24 Figure 1.14 Schematic of nonaqueous Li-O2 battery design... 25
Figure 1.15 (a) Schematic of the Li2O2 crystal growth via a surface mechanism and
VII
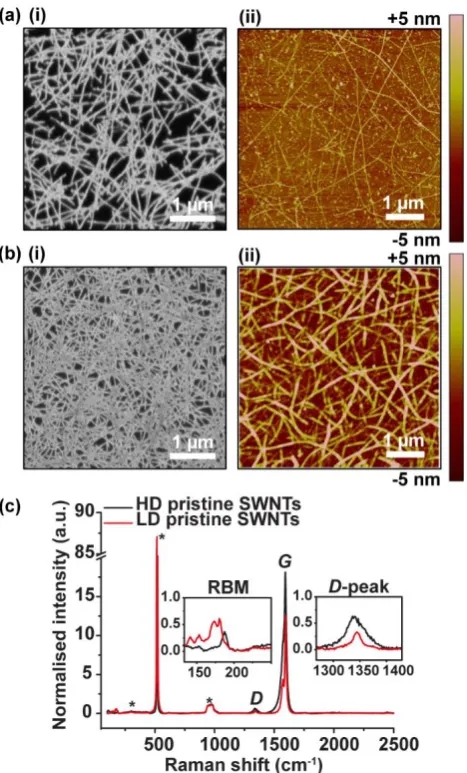
skeletonize binary image using “Nanotube Analyzer” to determine of total nanotube length. The density of this LD SWNT sample was 4.7 µmSWNT µm-2. ... 56
Figure 3.1 Schematic of the experimental setup for the electro-oxidation of DA. .... 67 Figure 3.2 Typical (i) FE-SEM and (ii) AFM images of (a) LD and (b) HD SWNT networks. (c) Corresponding micro-Raman spectra of LD (red) and HD (black) SWNT networks normalised to the Si/SiO2 peak at 950 cm-1. ... 70
Figure 3.3Typical (a) FE-SEM and (b) AFM images of LD SWNT networks after (i) 20 min, (ii) 120 min, (iii) 300 min and (iv) 600 min treatment with 3 M HNO3 at 70 oC. ... 71
Figure 3.4Typical (a) FE-SEM and (b) AFM images of HD SWNT networks after (i) 20 min, (ii) 120 min, (iii) 300 min and (iv) 600 min treatment with 3 M HNO3 at 70 oC. ... 72
Figure 3.5Typical micro-Raman spectra of (a) HD and (b) LD SWNT networks before and after acid treatment, in 3 M HNO3 at 70 oC for different times. (c) Effect of acid
treatment time on (i) SWNT network density as expressed in the iGp (t)/iGp (pristine) ratio and (ii) defect density as expressed in the iD /iGp ratio for HD SWNT networks (black) and LD SWNT networks (red). ... 73 Figure 3.6 Typical CVs for the oxidation of 1 mM FcTMA+ in 100 mM KNO3 (50
mV s-1) at (a) HD and (b) LD pristine SWNT networks and after 20 min, 120 min, 300 min, 600 min acid treatment in 3 M HNO3 at 70 oC. ... 75
Figure 3.7CVs for the oxidation of 100 µM DA in 0.01 M citric acid pH 7.0 phosphate buffer (100 mV s-1) at HD (black) and LD (green) pristine SWNT networks and after 20 min acid treatment on HD (red) and LD (blue) SWNT networks... 76 Figure 3.8 Ten consecutive CVs, recorded at a scan rate of 100 mV s-1, for the oxidation of 100 µM DA in 0.01 M citric acid pH 7.0 phosphate buffer at (a) HD and (b) LD pristine SWNT networks and 20 min acid-treated (c) HD and (d) LD SWNT network electrodes. Plot of (e) ∆Ep versus number of cycles (n = 3) and (f) ip(n)/ip(initial)
versus number of cycles (n = 3): HD (black) and LD (green) pristine SWNT networks, 20 min acid treatment on HD (red) and LD (blue) SWNT networks... 77 Figure 3.9 (a) CVs for the oxidation of 100 µM DA, recorded at a scan rate of 100 mV s-1, in 0.01 M citric acid pH 7.0 phosphate buffer (100 mV s-1) at HD SWNT networks after acid treatment for 120 min (blue), 300 min (brown) and 600 min (green) with 3 M HNO3 at 70 oC; (b) plot of ∆Ep versus acid treatment times (n = 3). ... 79
VIII
Figure 4.2 Typical FE-SEM images of (a) LD, (b) HD, (c) SHD SWNT networks and (d) SPCE. ... 96 Figure 4.3 CVs for the capacitance examination in 8 % PEG 2K + 0.01 M PBS (100 mV s-1) on SPCE (black), SHD (red), HD (blue) and LD (green) SWNT networks. 97 Figure 4.4 Micro-Raman spectra of SPCE (black), SHD (red), HD (blue) and LD (green) SWNT networks. ... 98 Figure 4.5 CVs for the oxidation of 1 mM FcCOOH and 0.01 M PBS (10 mV s-1) using a Pt microdisk electrode (25 µm in dia.) without PEG (black) and with 8 % of PEG 2K (red)... 99 Figure 4.6 CVs for the oxidation of different concentrations of FcCOOH in 8% PEG 2K and 0.01 M PBS (100 mV s-1) at (a) LD (Inset is the plot of ipvs. Concentration), (b) HD, (c) SHD SWNT networks and (d) SPCE. ... 101 Figure 4.7 DPVs for the oxidation of different concentrations of FcCOOH in 8% PEG 2K and 0.01 M PBS at (a) LD, (b) HD, (c) SHD SWNT networks and (d) SPCE. Inset is the zoomed-in DPVs. ... 103 Figure 4.8 ip as a function of FcCOOH concentration for (a) LD, (b) HD, (c) SHD SWNT networks and (d) SPCE. Note the different concentration ranges. ... 104 Figure 4.9 CVs of 15 consecutive cycles for the oxidation of 100 µM FcCOOH in 4 % albumin and 0.01 M PBS at (a) LD, (b) HD, (c) SHD SWNT networks and (d) SPCE, scan rate 100 mV s-1. ... 106
Figure 4.10 CVs of 100 consecutive cycles for the oxidation of 100 µM FcCOOH in 8 % PEG 2K and 0.01 M PBS at (a) LD, (b) HD, (c) SHD SWNT networks and (d) SPCE, scan rate 100 mV s-1. ... 107
Figure 5.1 Experimental set-up for (a) the electrodeposition of NPs using the droplet method and microscopic electrocatalytic measurements using the MCEM. (b) Illustration showing Ni(OH)2 NPs formation on a SWNT network electrode by both
the direct (top) and indirect (bottom) approach. ... 119 Figure 5.2 Typical (a) FE-SEM and (b) AFM images of a HD SWNT network. (c) Corresponding micro-Raman spectrum. ... 122 Figure 5.3 (a) A typical current-time curve recorded at a substrate potential of -1.5 V for 5 s in 10 mM Ni(NO3)2 for the direct approach. (b) Concentration profile of OH
-(▲) vs. distance from electrode surface for a time of 5 s and corresponding S values (□), calculated using equation 2. ... 124 Figure 5.4 Typical (a) FE-SEM and (b) AFM images of a HD SWNT network electrode modified with Ni(OH)2 (deposition parameters 5 s at -1.5 V vs. Ag/AgCl in
10 mM (Ni(NO3)2 solution). (c) AFM cross sectional height analysis (red line in b) of
IX
(i) before and after (ii) 1 cycle, (iii) 10 cycles and (iv) 50 cycles in 0.1 M KOH. (c) Corresponding height cross sections of the NPs. ... 125 Figure 5.6 Repetitive CVs recorded in 0.1 M KOH on Ni NP deposited SWNT network electrode (indirect approach). The scan rate was 5 mV s-1. ... 126 Figure 5.7 Typical (a, d) HR-TEM images and (c, f) SAED patterns of modified HD SWNT network electrode with Ni(OH)2 NPs by the (a-c) direct and (d-f) indirect
approaches. ... 127 Figure 5.8 Schematic representation of (a) α-Ni(OH)2 phase (small grey spheres, Ni2+;
large red spheres, OH-; medium size blue spheres, H2O positions) and (b) β-Ni(OH)2
phase (medium grey spheres, Ni2+; large red spheres, O2-; small pink spheres, H+). In the first structure, H+ is omitted for clarity.1 ... 128 Figure 5.9 Typical CVs recorded using the MCEM with a capillary of 60 µm diameter in 0.1 M KOH, using a Ni(OH)2 modified SWNT network electrode by the direct and
indirect approaches. The potential scan rate is 5 mV s-1. ... 130 Figure 5.10 CVs at Ni(OH)2 NP-modified SWNT network electrodes using the (a, b)
direct and (c, d) indirect approach in a solution of 0.1 M KOH (red) with (a, c) 0.5 M EtOH and (b, d) 0.5 M MeOH (black). Inset: Magnification of the CVs of bare SWNT network electrode (blue) in 0.1 M KOH solution containing 1 M EtOH + 1 M MeOH and Ni(OH)2/SWNT in 0.1 M KOH (red). The potential scan rate was 5 mV s-1. .. 132
Figure 5.11 Typical CVs of 0.5 M EtOH in 0.1 M KOH at β-Ni(OH)2/SWNT prepared
by 10 (black) and 50 (red) potential cycles in 0.1 M KOH. ... 133 Figure 6.1 Experimental setup for (a) blister formation on HOPG using the droplet method (0.1 M HClO4) and (b) nanoscopic electrocatalytic measurement using
voltammetric hopping mode SECCM. For SECCM, a bias voltage (V2) was applied between two QRCEs and the resulting ion conductance current (IIC) was measured and used for nanopipette positioning. A substrate voltage (V1) was applied to one of the QRCEs to control the working electrode potential (Es = – (V1 + V2/2) vs. Pd-H2) and
the working electrode current (IEC) was measured. Small amounts of residue were left on the surface after withdrawing the nanopipette from each position, which aided location identification by other techniques. The arrows show the movement of the nanopipette. ... 152 Figure 6.2 Three consecutive CVs recorded at HOPG in 0.1 M HClO4 (25 mV s-1).
Peak positions on the potential scale (inset figure) are mentioned in the text. (b and c) Corresponding FE-SEM images recorded on a blistered region of HOPG after the measurement in (a). (d) Schematic depicting the formation of a blister on HOPG.30-32 1) The basal plane and surface defects (step edges and GBs) on HOPG electrode prior to electro-oxidation in 0.1 M HClO4 solution. 2) Intercalation of ClO4- ions occurs
along with the intercalation of HClO4 and H2O at defect sites during the anodic
X
Figure 6.3 Typical AFM images of AM HOPG (a) before and after (b and c) voltammetric cycling 0.1 M HClO4 (conditions as Figure 6.2a), leading to surface
blistering. (d and e) Corresponding height cross sections of surface blistered regions. Note the different height scale bars. ... 156 Figure 6.4 Optical micrographs (i) of two surface blistered regions (a and b) with corresponding micro-Raman maps of: (ii) iD and (iii) iG/iD ratio, along with individual Raman spectra at (iv) blistered and (v) basal plane regions of an EC-treated HOPG surface. (vi) Averaged-spectra (n = 3 ‒ 5) of the surface blistered region (red) and basal plane (blue) of the treated HOPG surface. ... 158 Figure 6.5 EC map of the modified HOPG substrate at (a) 2.35 VRHE (5 mM N2H4).
(b) FE-SEM image after SECCM imaging showing the locations of the individual pixels. (c) Individual LSVs (black, n = 5) and averaged LSV (red) for different regions marked in (a). (d) Tafel map (mV per decade) determined using data from 0.65 > Es > 1.10 VRHE (blister) and 1.40 > Es > 1.70 VRHE (basal plane). ... 161
Figure 6.6 2 consecutive LSVs of hydrazine oxidation at a gold electrode in a SECCM setup. Electrolyte: 5 mM N2H4 in 0.1 M PBS. Scan rate: 500 mV s-1. ... 161
Figure 6.7 EC map of a modified HOPG substrate at (a) 2.1 VRHE (5 mM N2H4) (b)
FE-SEM image after SECCM imaging. LSV for different regions: (c) blister spots (1 and 2 in (a)), (d) Inner blister (A) (n = 5) and (e) basal plane (B) (n = 5). (f) Tafel map (mV per decade) determined using data from 0.75 > Es > 1.05 VRHE (blister) and 0.90
> Es > 1.30 VRHE (basal plane). ... 164
Figure 7.1 (a) Typical LSV recorded in O2 saturated 0.1 M LiClO4 DMSO on gold
substrate. The scan rate was 100 mV s-1. (b) Typical current-time curves recorded at a
substrate potential of 1.87 VLi/Li+ for 10 s. ... 175
Figure 7.2 High resolution transmission electron microscopy (HR-TEM) image of pulled dual channel nanopippette for SECCM imaging. ... 177 Figure 7.3 (a) Schematic of EC measurement using voltammetric hopping mode SECCM in the Ar environmental chamber. (b) CV measurements at every pixel of a pre-defined scanned area. ... 179 Figure 7.4 (a) FE-SEM images after Li2O2 products (Li2O2 toroids on top of thin Li2O2
layer) growth on gold substrate (conditions as Figure 7.1) and inset is FE-SEM image of the toroid with higher magnification. (b) Typical micro-Raman spectra of Li2O2
toroid. (c) Typical AFM image of Li2O2 toroids on Li2O2 layer. A magnified AFM
image of (d) a spherical Li2O2 toroid, illustrating a nanocrystalline aggregate structure
and (e) the Li2O2 layer. Corresponding height cross sections of surface Li2O2 particles:
(f) toroidal and (g) layer structure. ... 180 Figure 7.5(a) Topography simultaneously generated with the EC measurements using voltammetric hopping mode SECCM in the Ar environmental chamber. (b) FE-SEM image after SECCM imaging showing the locations of the individual pixels. (c) Magnified FE-SEM image after SECCM imaging at region 1. (d) Averaged CVs (n = 4) for Li2O2 toroid (1st cycle (red); 2nd cycle (blue)) and Li2O2 layer (1st cycle (green);
XI
7.1) at 2.39 VLi/Li+ for (e) first and (f) second cycle. EC map different oxidation
potential at (g) 3.59 VLi/Li+ and(g) 4.12 VLi/Li+ for second cycle. ... 186
XII
List of tables
XIII
Acknowledgements
First I would like to thank my supervisors, Prof. Patrick Unwin and Prof. Julie Macpherson for their kindness in accepting me as a student transferring from Engineering. Their advice and guidance helped me a lot in the last four years, allowing me to grow as a research scientist. I really appreciate having had the opportunity to be a member of the group.
I have been fortunate to work with many gifted scientists on different projects -Yang-Rae, David, Minkyung, Paul, Andrew, Ashley, Tom, Lingcong, Guohui, Danqing, Rob,Jeremy, Marcio, Liz, Max and Jon. I would also like to thank the members of Warwick Electrochemistry and Interfaces Group past and present for their help and discussion, especially Yang-Rae Kim for his insightful comments and discussion which incentivized me to widen my research from various perspectives. A special thanks to the members of office C111, Ashley Page, David Perry, Tom Scott, Alexander Parker, they provided humor and entertainment in what could have otherwise been a stressful working environment.
I am thankful to Warwick Chancellors International scholarship for providing funding for my Ph.D. studies.
XIV
Declaration
The work in this thesis is original and my own except where carried out in collaboration, as outlined below.
Chapter 5 was developed by Marcio Vidotti, who kindly provided comments and discussion for this project. The Ni(OH)2 electrodeposition using the indirect
approach was conducted by Danqing Liu. HR-TEM images were taken with the help of Dr. Robert Lazenby and Dr. Jeremy Sloan (Warwick Physics); Chapter 6, the SECCM MATLAB script was kindly written by David Perry and the Raman MATLAB script by Ashley Page; Chapter 7 was developed by Dr. Andrew Basile, who kindly provided insight and expertize that greatly assisted the research. The polymer gel was developed by Dr. Paul Wilson. Galvanostatic discharging data and the HR-TEM image were collected by Minkyung Kang. I confirm that this thesis has not been submitted for any degree at another university.
Parts of this thesis have been published or to be submitted, as detailed below:
S. P. E,Y. R. Kim, D. Perry, C. L. Bentley and P. R. Unwin, ACS Appl. Mater. Interfaces, 2016, 8, 30458–30466.
S. P. E, D. Liu, R. A. Lazenby, J. Sloan, M. Vidotti, P. R. Unwin and J. V. Macpherson, J. Phys. Chem. C, 2016, 120, 16059-16068.
S. P. E, T. S. Miller, J. V. Macpherson and P. R. Unwin, Phys. Chem. Chem. Phys., 2015, 17, 26394-26402.
XV
S. P. E, M. Kang, Paul Wilson, A. Basile, L. Meng, D. Perry and P. R. Unwin. Nanoscale Visualization of Redox Activity of Li2O2 in Non-Aqueous Media:
Conformal Layer vs. Toroid Structure, in preparation.
Side projects in collaboration with others:
T. S. Miller, S. Sansuk, S. P. E, S. C. Lai, J. V. Macpherson and P. R. Unwin, Catal. Today, 2015, 244, 136-145.
XVI
Abstract
Carbon materials, including single-walled carbon nanotubes (SWNT) and graphene, have gained great interest in electrochemistry. The advantages of carbon electrodes include chemical stability, biocompatibility, low background currents and good electrical conductivity. With the increasing importance of carbon electrode materials for biological and energy application, the systematic investigation and new applications is mandatory.
SWNT networks, with different densities, are firstly investigated using microscale capillary electrochemical (EC) methods. Pristine high density (HD) SWNT networks are shown to exhibit more facile electron transfer (ET) for dopamine (DA) electro-oxidation and are less susceptible to blocking by reaction products when compared to low density (LD) SWNT networks. Acid treatment of SWNT networks results in an enhancement of electrode kinetics and a reduction in their susceptibility to surface fouling. Further, a comparison is made between SWNT electrodes, with different densities and a commercial screen printed carbon electrode (SPCE), for the oxidation of ferrocenecarboxylic acid (FcCOOH) in complex aqueous media (polyethylene glycol (PEG) and albumin), to mimic conditions in which diagnostic devices might be used. SWNTs exceed the performance of SPCEs, with a detection limit that is 3 orders of magnitude lower. Finally, a Ni(OH)2 nanoparticles (NPs)
modified SWNT network is employed for the methanol oxidation reaction (MOR) and the ethanol oxidation reaction (EOR), showing improved ET processes with ~2.8 kA g-1 for MOR and ~3.7 kA g-1 for EOR, which are much higher than recent reports using
other nanostructured catalysts.
A fundamental understanding of the structure-activity of “blistered” highly oriented pyrolytic graphite (HOPG), produced by electro-oxidation in HClO4, is
obtained using scanning EC cell microscopy (SECCM) coupled with multi-microscopy techniques. The disordered sp2 carbon structure of the blister catalyzes the electro-oxidation of hydrazine compared to the basal surface. In this study, a potential sweep at each pixel of pre-defined scan area is recorded, providing potentiodynamic data with high resolution.
To demonstrate that the approaches are generally applicable, a fundamental study of the redox activity for Li2O2 product (toroidal and layer structure) in dimethyl
sulfoxide (DMSO) non-aqueous media, is undertaken. A unique gel polymer organic electrolyte (polymer matrix, cross linker and organic electrolyte) is employed in a dual barrel nanopipette and the SECCM approach is carried out with cyclic voltammetry (CV) measurements performed at every pixel of a scan. The Li2O2 toroids outperforms
the Li2O2 layer structure with a 9 times increase in the current response and ca. 80 %
XVII
Abbreviations
Symbol
Abbreviation
AC Alternating current
ADHD Attention deficit hyperactivity disorder AFM Atomic force microscopy
AN Acceptor number
AOR Alcohol oxidation reaction CE Working electrode
CNT Carbon nanotube CV Cyclic voltammetry
cCVD Catalyzed chemical vapour deposition DA Dopamine
DI Deionized
DMSO Dimethyl sulfoxide DN Donor number DOS Density of state
DPV Differential pulse voltammetry EC Electrochemical
XVIII
EGO Electrochemically formed graphite oxide EOR Ethanol oxidation reaction
ET Electron transfer EtOH Ethanol
FE-SEM Field emission scanning electron microscopy GC Glassy carbon
HD Highly density
HOPG Highly oriented pyrolytic graphite
HR-TEM High resolution-transmission electron microscopy HZ Hydrazine
LD Low density LOD Limit of detection
LSV Linear sweep voltammetry
MCEM Micro-capillary electrochemical method MeOH Methanol
mSWNT Metallic single-walled carbon nanotube MOR Methanol oxidation reaction
MWNT Multi-walled carbon nanotube NP Nanoparticle
Ni(OH)2 Nickel hydroxide
XIX
PBS Phosphate-buffered solution PEG Polyethylene glycol
PCDF Porous carbon derived from filter paper PGMA Poly(glycidyl methacrylate)
QRCE Quasi reference counter electrode QRE Quasi reference electrode
RBM Radial breathing mode RE Reference electrode RGSs Reduced graphene sheets SA Specific activity
SAED Selected area electron diffraction
SECCM Scanning electrochemical cell microscopy SHD Super high density
SPCE Screen printed carbon electrode SWNT Single-walled carbon nanotube
XX
Glossary of Terms
Symbol
Abbreviation
j Flux
D Diffusion coefficient
c Concentration of the electroactive species
v Fluid velocity
z Charge of the species
F Faradaic constant
R Gas constant
T Temperature
∅ Electric field
E Electrode potential
Eo’ Formal electrode potential
O Concentrations of the oxidized species
R Concentrations of the reduced species
i Faradic current
n Number of electrons transferred
A Electrode area
XXI
kf Electron transfer rate of the forward reaction
Cox Concentration of oxidized species Cred Concentration of reduced species η Electrode overpotential
α Charge transfer coefficient
k0 Heterogeneous standard rate constant
Epa Anodic peak potential Epc Cathodic peak potential ∆Ep Peak separation
ipa Anodic peak current
ipc Cathodic peak current
[R]bulk Concentration of species R in bulk solution
DR Diffusion coefficient for R species
v Scan rate
a Radius of electrode
E1/2 Half wave potential
E3/4 Potential at current values at ¾ of ilim E1/4 Potential at current values at ¼ of ilim E0 Standard electrode potential
𝐶⃗ Chiral vector defined as below
XXII
dt Nanotube’s diameter
aC-C Carbon-carbon distance in graphene
µ Mean of the CV response
σ Standard deviation of the CV response
ilim Limiting current of disc UME
r Radius of electrode
ρth(metallic) Metallic percolation threshold
l Length of SWNTs
C Capacitance
iaverage Average current from forward and reverse sweep of CV
Ageometric Geometrical area of the electrode
Γ The amount of electroactive Ni(OH)2 Qox Oxidative charge
Qred Reductive charge
MNi(OH)2 Molar mass of Ni(OH)2
cₒ Inter-sheet distance
S Saturation ratio
Ksp Solubility constant
XXIII
Co Initial concentration
l Separation of electrode surface and a parallel boundary
t Time
x Distance from electrode
m Number of points used in the analytical expression
Es Working electrode potential defined as below
V1 Substrate voltage
V2 Bias voltage
IEC Working electrode current
1
Chapter 1
Introduction
This introduction is concerned with the development of carbon electrodes for electroanalysis and electrocatalysis. The synthesis and modification of controlled growth of single-walled carbon nanotubes (SWNTs) is summarized. The uses of carbon electrodes for different applications such as biosensors for the detection of biological agents and alcohol oxidation for fuel cells are discussed. Finally, the fundamental understanding of the cathode electrode in Li-O2 batteries is summarized.
1.1
Dynamic electrochemistry
2
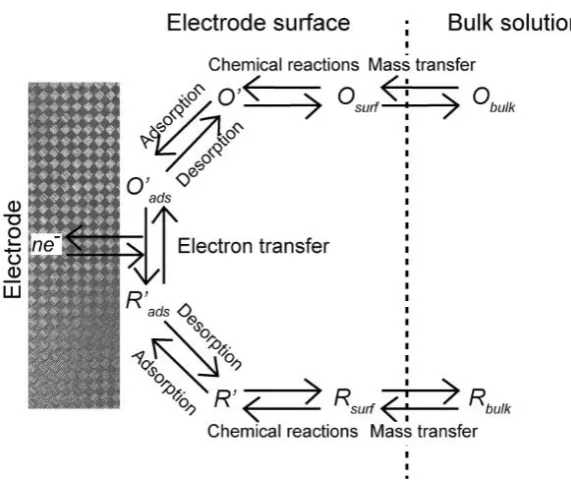
Figure 1.1 Schematic of a general electrode reaction. The mass transport occurs
in series with other processes, such as chemical reactions, adsorption/desorption
and ET.1
1.1.1
Mass transport
Mass transport involves a species in solution travelling between the electrode surface
and bulk solution. The mass transfer coefficient, kr, determines the rate of movement
of species in solution. There are three mass transport modes: diffusion, convection and
migration.1, 2 The Nernst-Plank equation defines the contributions of all three modes
to the steady state flux, J, as:3
𝐽 = −𝐷∇𝑐 + 𝑣𝑐 −𝑧𝐹
𝑅𝑇 𝐷∇∅ (1)
where D is the diffusion coefficient, c is the concentration of the electroactive species,
v is fluid velocity, z is charge of the species, Fis Faraday’s constant, R is the ideal gas
constant, T is the temperature and ∅ is the electric field.
The movement of species driven by the presence of a concentration gradient is
3
species is consumed and a product is formed, resulting in a low concentration of the
reactant species and a high concentration of the product species close to electrode
surface. Due to the uneven concentration distribution in the system, species tend to
move between the electrode surface and bulk solution. The diffusion profile, which
develops during an EC reaction, depends on the electrode size and on its geometry. As
examples, planar diffusion is observed at a macroelectrode (Figure 1.2a) whereas a
hemispherical diffusion profile develops at a microelectrode (or ultramicroelectrode,
UME) under steady-state conditions (Figure 1.2b). UMEs offer advantages over
macroelectrodes for the study of EC systems, as they have higher rates of mass
transport (hemispherical diffusion profile), a small ohmic drop (due to the low current
generated) and a low capacitance charge in time-dependant measurements (small
surface area).1, 4
Figure 1.2 Schematic view of diffusion profiles for (a) macroelectrode and (b)
microelectrode.
The movement of species due to an external force is termed convection. The
most commonly used convection EC system is a rotating disk electrode, where an
increased flux of species towards the electrode surface results from the convective
4
Migration is the movement of a charged species in an electrical field. In an EC
cell, electrical fields exist due to the externally applied potential on the electrodes,
with the charged species tending to move according to the electrical field, resulting in
a complex mass transport. Typically, EC experiments are conducted under a large
excess of background electrolyte where inert salt (KNO3 or KCl) suppresses these
migration effects. The concentration of supporting electrolyte added to solution is
usually around 100 times greater than the concentration of the reactant species.
Another benefit of the introduction of supporting electrolyte is the reduced solution
resistance (reduced ohmic drop).1, 3
1.1.2
Electron transfer kinetics
For a reversible system, the ET at the electrode is fast when compared to the mass
transport to the electrode surface so that the Nernst equation applies.3
𝐸 = 𝐸°′ +𝑅𝑇
𝑛𝐹𝑙𝑛 [𝑂]
[𝑅] (2)
where E is electrode potential, Eo’ is formal electrode potential, n is the number of
electrons transferred per redox species, O and R are the concentrations of the oxidized
and reduced species, respectively.
When kinetics operate, we may write:
𝑂 + 𝑛𝑒− 𝑘𝑓 →
𝑘𝑏
← 𝑅 (3)
where kf and kb are the ET reaction constants of the forward and backward reactions,
5
The faradic current, i, at the electrode is proportional to the flux of species at
the electrode surface, j
𝑖 = 𝑛𝐴𝐹𝑗 (4)
where A is the area of the electrode and j is defined by:
𝑗 = 𝑘𝑓𝐶𝑜𝑥− 𝑘𝑏𝐶𝑟𝑒𝑑 (5)
kf and kb have an exponential dependence on the electrode overpotential, η, which is
the potential difference between the applied potential and the equilibrium potential
and act as a main driving force for a reaction. A good electrocatalyst can facilitate the
EC reactions at low η.
𝜂 = 𝐸 − 𝐸𝑜 (6)
𝑘𝑓 = 𝑘0𝑒−𝛼𝑛𝐹𝜂𝑅𝑇 (7)
𝑘𝑏 = 𝑘0𝑒(1−𝛼)𝑛𝐹𝜂𝑅𝑇 (8)
where α is the charge transfer coefficient. Substituting equations 7 and 8 into 5 yields
the Butler-Volmer equation below (equation 9 and Figure 1.3a).5
𝑖 = 𝑛𝐴𝐹𝑘0[𝐶𝑜𝑥𝑒−𝛼𝑛𝐹𝜂𝑅𝑇 − 𝐶𝑟𝑒𝑑𝑒
(1−𝛼)𝑛𝐹𝜂
𝑅𝑇 ] (9)
If the system deviates from equilibrium, (│η│ ≫ 0) one reaction (either the
cathodic or anodic reaction) will dominate and equation 9 can be written as
𝑖 = 𝑛𝐴𝐹𝑘0𝐶𝑜𝑥𝑒−𝛼𝑛𝐹𝜂𝑅𝑇 (10)
6
𝜂 = (2.3𝑅𝑇
𝛼𝑛𝐹) 𝑙𝑜𝑔 𝑖0+ ( −2.3𝑅𝑇
𝛼𝑛𝐹 ) 𝑙𝑜𝑔𝑖 = 𝑎 + 𝑏 𝑙𝑜𝑔𝑖 (11)
The Tafel equation reveals a linear relationship between η and log i, where io
can be written as:
𝑖0 = 𝑛𝐴𝐹𝑘0𝐶𝑜𝑥 (12)
and can be determined from the intercept of Tafel plot (η = 0) as shown in Figure 1.3b.
The Tafel slope is proportional to α, which can be used to determine the possible
reaction pathway and the rate determining step of the EC reactions.
Figure 1.3 Schematic plots for (a) Butler–Volmer equation and (b) Tafel plots.
1.1.3
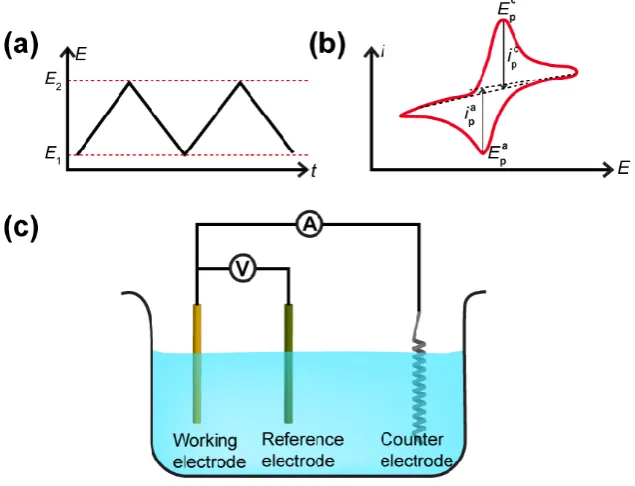
Cyclic voltammetry (CV)
One of the most commonly used dynamic EC techniques is voltammetry, where the
current is recorded as a function of applied potential. Figure 1.4 shows a schematic of
an example CV measurement. In a CV measurement, the potential applied to the
working electrode (WE) is swept from E1 to E2 and then back to E1, in a triangular
waveform (Figure 1.4a) and the current flowing through the WE is measured. The CV
is then represented as a plot of current as a function of the potential. A typical CV
recorded at a macroelectrode (diameter in millimetre range) is shown in Figure 1.4b.
7
where the potential is applied between the WE and reference electrode (RE) and the
current is measured between the WE and counter electrode (CE).
The CV recorded at a macroelectrode exhibits some important key features:
(1) the current value recorded is usually large in magnitude due to the large electrode
area, hence the 3-electrode setup is necessary. The CE (typically a Pt wire) is used to
pass the current resulting in negligible current being drawn through the RE to maintain
a constant potential; and (2) peak shaped CV signature. The potential is swept from
E1, where no EC reaction occurs, to a value where a faradaic process, in this case the
ET process of R to O, takes place, resulting in an increase in the current magnitude.
As the potential scans towards E2, the current increases exponentially until reaching a
peak, ipa at potential of Epa, after which the current drops. The current signature is
dependent on the relationship between the mass transport coefficient and the ET rate.3
Scanning backwards, a similar current signature is observed; a cathodic peak, ipc at
potential of Epc. The peak to peak separation, ∆Ep,
∆𝐸𝑝 = 𝐸𝑝𝑎− 𝐸𝑝𝑐 (13)
can be used to determine the reversibility of an EC reaction and it is 59 mV for a
reversible (diffusion limited) one electron reaction. The anodic peak current, ipa is
described by Randles-Sevcik equation:6
𝑖𝑝𝑎 = 0.446𝑛𝐹𝐴[𝑅] 𝑏𝑢𝑙𝑘(
𝑛𝐹𝐷𝑅𝑣
𝑅𝑇 )
1 2
(14)
For the solution is at 298 K,
𝑖𝑝𝑎 = (2.69×10⁵)𝑛32𝐴𝐷 𝑅
1 2[𝑅]
𝑏𝑢𝑙𝑘𝑣
1
8
where DR is the diffusion coefficient for R species; [R]bulk is concentration of R in bulk
solution; T andv represent the temperature in K and scan rate in V s-1.
Figure 1.4 (a) E ‒ t plot for a CV; (b) A typical CV where ipc and Epc are the
cathodic peak current and potential, respectively and ipa and Epa are the anodic
peak current and potential, respectively for a reversible reaction; (c) A typical 3
electrode cell.
The CV for a UME (diameter in µm range) is somewhat different to that
obtained from a macroelectrode (Figure 1.5) and exhibits (1) a much reduced current
magnitude due to the smaller electrode area, hence, 2-electrode setup can often be
used; (2) a steady-state current-potential response due to the enhanced mass transport
rate which results from the hemispherical diffusion. The limiting current (ilim) obtained
for a disc UME is described by:
𝑖𝑙𝑖𝑚 = 4𝑛𝑎𝐹𝐷𝑅[𝑅]𝑏𝑢𝑙𝑘 (16)
where a is the radius of the disc UME. For a reversible process in a microelectrode
[image:33.595.164.482.142.385.2]9
𝐸3/4− 𝐸1/4= 59
𝑛 𝑚𝑉 (17)
where E3/4 and E1/4 are the potentials at which current values are at ¾ and ¼ of ilim,
respectively.7
Figure 1.5 CV of a microdisk electrode. il i m is the limiting current, E3 / 4 and E1 / 4
is the potential at current values equals to ¾ and ¼ of il i m, respectively.
1.1.4
Scanning electrochemical cell microscopy
SECCM is part of the family of scanning probe microscopy techniques which utilizes
a nanoscale (or microscale) liquid meniscus formed at the end of a dual barrel nanopipette, as an EC cell capable of achieving high resolution and localized EC measurements.8-10 This setup enables high mass transport rates by manipulating the potential bias between the two barrels and is capable for studying ion transfer and ET.8 Droplet cells were first developed in the mid-1990s for corrosion studies,11, 12 and was greatly improved through the invention of SECCM to facilitate the simultaneous study of topography and the electroactivity of the electrode in the 2010.8
quasi-10
[image:35.595.244.395.243.461.2]reference counter electrodes (QRCE) in each barrel. A bias is applied between the QRCEs to induce an ionic conductance current flow across of the droplet which is used as a feedback parameter for controlling the tip-to-substrate separation.9 The tip is oscillated normal to the surface to induce an alternating the AC component which is detected through the use of lock-in techniques and the resulting AC ion current served as the feedback signal.13
Figure 1.6 Schematic depicting SECCM operation. A bias is applied between the
QRCEs in the electrolyte to introduce an ionic conductance current flow across
the meniscus at the end of the nanopipette, which is used as the feedback signal
for nanopipette positioning on the ele ctrode surface. A substrate voltage is
applied to one of the QRCEs to drive the EC reactions at the (semi)conducting
electrode and the WE current was measured.
11
emission-scanning electron microscope (FE-SEM)), it allows for a correlation between structure and activity at the nanoscale to be obtained.
1.2
Introduction to carbon materials
12
1.2.1
Structural properties of carbon nanotubes
CNTs consists of sp2-hybridized carbon atoms and can be constructed in two forms: SWNT and multi-walled carbon nanotube (MWNT).34 SWNT can be described as a layer graphene rolled into a hollow cylinder whereas MWNT consist of several tubes of graphene fitted one inside the other (0.34 nm interlayer distance of graphite).30, 34 A vast variety of possible nanotube geometries provides nanotubes of different diameters and chirality, uniquely described by a chiral vector (𝐶⃗), which is the result of the graphene lattice vectors 𝑎⃗1 and 𝑎⃗2 correspond to a pair of integers (n, m),35
𝐶⃗ = n𝑎⃗1 + m𝑎⃗2 (18) Figure 1.7 shows three types of SWNTs: zigzag (n, 0), armchair (n = m) and chiral (n ≠ m > 0). The chiral angle is the angle between the direction of chiral 𝑎⃗1, such as 0° > θ > 30°. The tube diameter, dt, can be calculated by dividing |𝐶⃗| by 𝜋.36
𝑑𝑡 = √3𝑎𝑐−𝑐
𝜋 √𝑛
2+ 𝑚2+ 𝑛𝑚 (19)
where aC-C is the carbon-carbon distance in graphene, 1.42 Å. Ta is known as the translational vector of the nanotube with the same origin as 𝐶⃗ but runs orthogonal to it, which defines as the length of the SWNT. Thus, Ta and 𝐶⃗ define the area of graphene sheet to form a SWNT. The typical diameter of CNT is 0.7 – 3 nm and 2 – 30 nm, for SWNT and MWNT, respectively.34 Both SWNTs and MWNTs can range from
13
[image:38.595.182.464.221.463.2]or seven-membered rings (at the kinked side), sp3 hybridized carbon and the open tube end. The open tube ends formed during chemical processing are often decorated with oxygen functionalities (Figure 1.8b).39 These defects in CNTs are important in covalent chemistry as they serve as potential sites for adsorption of electroactive species which could bring new performance, an aspect that we discuss below.
Figure 1.7 Schematic diagram showing roll -up of a 2D graphene sheet leading to
the three different types of CNT: chiral (11, 4), zigzag (16, 0) and armchair (8,
8) orientations.
CNTs can be either metallic or semiconducting depending on the diameter and chirality of the tube, which corresponds to the (n, m) indices.40, 41 The rule of thumb
14
diameter of the tube.43 Sharp spikes (van Hove singularities), which arise from one-dimensional (1D) electronic structure, predict the electronic state densities for the CNTs.36 The 1D electronic structure causes the electronic transport in mSWNTs and MWNTs to occur ballistically, where electrons can move freely over long nanotube lengths without scattering from atoms or defects.44, 45 The introduction of defects into the CNT network results in fascinating properties and can enhance their potential application as electrocatalysts.22, 46
Figure 1.8 (a) Schematic illustrating edge plane and basal plane like sites on
graphite and MWNTs. (b) Typical defects in a SWNT; A) five - or
seven-membered rings, leading to a bend in the tube, B) sp3-hybridized defects (R=H
and OH), C) sidewall damaged by oxidative process, functionalizing the hole
lined with -COOH groups and D) open end of the SWNT terminated with -R and
[image:39.595.146.501.270.608.2]15
Figure 1.9 Electronic properties of two CNTs: (a) armchair (5,5) CNT exhibits
metallic behavior (reveals charge carrier in DOS at the Fermi energy) and (b)
zigzag (7,50) CNT exhibits semiconductor behavior (no charge carrier in DOS
at the Fermi energy).4 2
1.2.2
Carbon nanotube network growth
High temperature CNTs growth techniques (arc discharge and laser ablation; T > 3000
℃) have been replaced by relatively low temperature techniques (chemical vapor deposition (CVD); T < 1000 ℃).47, 48 Arc discharge results in CNT formation by
harvesting energy from electrical arc between cathode and anode electrodes, in the presence of metal catalyst (i.e. Co, Ni and Fe).49 Laser ablation produces CNTs from
[image:40.595.215.432.107.354.2]16
catalysts.30, 51, 52 These impurities often interfere with the electrochemistry of CNTs.
53-55 Thus, a clean-up procedure after growth is necessary.56-58
Alternatively, with carefully optimization of the catalyzed CVD (cCVD) conditions, CNTs grown have been shown to exhibit a low defect density,46, 59 negligible amorphous carbon content and to be relatively free of catalytic NPs (metal NPs encapsulated at the end of the CNT).60 In this approach, the CNT is precipitated from the decomposition of a gaseous hydrocarbon source (alkane or CO) on the catalytic metal NPs (Co and Fe).61 The CNTs are attached to an inert substrate (e.g.
Si/SiO2 or quartz).62 It is possible to grow CNTs of different geometries (isolated
CNTs,63 2D random networks,64 and vertically aligned CNT forests65) by means of controlling the growth time and metal catalyst used. Another appealing feature of this method is the capability to control the diameter of CNTs by adapting the size of the catalyst NP.66
1.2.3
Modification of carbon nanotubes
The surface structure of CNT electrodes is crucial to EC applications. CNTs act as a support material for various organic and inorganic materials due to their large active surface63 and stability20. The rapid development of these composite materials, used as EC sensors, has been successfully witnessed.67 The role of oxygen containing groups and metal NPs functionalization in enhancing the catalytic activities of CNTs are highlighted in this section.
1.2.3.1 Oxygen containing groups functionalization
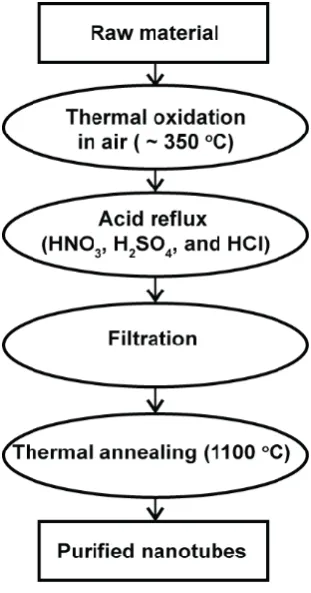
17
carbon. Next, the metal catalyst NPs are removed by refluxing the CNTs in HNO3,
[image:42.595.258.414.164.461.2]H2SO4, HCl or mixtures of these acids.68-70 A final annealing at high temperature (1000 oC) in vacuum eliminates residual surface defects.71-73
Figure 1.10 Typical purification process for CNTs.5 8
The use of this purification process can introduce defects, possibly resulting in CNT “cutting”, opening the end of the CNTs and oxidative damage to the sidewalls.57, 74 These cut ends and defects are functionalized with oxygen containing groups, such
as carboxylic acids, ketones and alcohols.75 These groups can further bind to other units, which could aid certain EC reactions.67 Many redox processes (inner sphere)
back-18
scattering.78, 79 Hence, careful control of the purification procedure is needed to optimize the performance of CNT-based electrodes.
1.2.3.2 Modification with metal nanoparticles
The modification of CNT structures with metal NPs for EC-based sensor has also received great attention.80 Noble metal NPs-modified CNTs can be constructed which
give an excellent EC response as a consequence of improved catalytic activities and chemical stability. For instances, Au/SWNTs hybrid materials shows increased electrocatalytic activity towards hydroxylamine detection,81 whilst Pt/SWNTs composites shows remarkably improved sensitivity towards hydrogen peroxide.82 Pd/SWNTs hybrid composites acts as a novel non-enzymatic electrocatalyst for glucose oxidation.83 These noble catalysts are rather expensive and scarce metals. Thus, there is a need to find an alternative method, using cheaper materials, which perform well in terms of electrocatalytic activity. Metal oxide nanostructures have also been applied as EC sensors, however, they are limited by poor electrical conductivity. This limitation can be overcome by anchoring the metal oxides on CNTs in which the CNT matrix provides electrons with conducting pathways.67 Nickel and its hydroxide has been the subject of investigation as electrocalatysts for fuel cell applications84 and glucose sensors.85, 86 A variety of synthetic routes are available for making different
Ni(OH)2 morphologies.87, 88 The electrocatalytic activity arises from unpaired d
electrons or empty d-orbitals resulting from the oxidized form of Ni(OOH)89-91 which
is available to bond with adsorbed species.
19
1.2.4
Applications of carbon-based nanostructures for
electrocatalysis
1.2.4.1 Dopamine detection
Biosensors plays a vital role in medical diagnosis and detection of biological agents in the environment.92 The discovery of novel, efficient electrocatalysts is highly desirable in the development of new biosensors. EC sensing holds great promise in this area due to their high sensitivity and fast response time.93 Carbon-based materials of different structures and dimensionalities are important electrode materials for EC biosensors due to the wide potential window, chemical inertness and hence biocompatibility, as well as their low cost.94 However, conventional EC biosensors based on glassy carbon (GC) electrodes and screen printed carbon electrodes (SPCE) have several limitations, such as slow ET rates, poor sensitivity and stability.30 In contrast, CNTs could overcome some of these issues owing to their high surface area,95
biocompatibility,96, 97 ease of functionalization98-100 and facile ET for different redox couples.58
20
is a strong correlation between increasing functionalization and decreasing conductivity, hence, a balance must be obtained between the two in order to enhance the performance of a SWNT network electrode.However, the extent of acid treatment in relation to the SWNT density required for optimal EC performance has not been fully addressed.
The oxidation of DA tends to produce the by-product, leucodopaminechrome,108, 109 and eventually melanin-like compounds are formed,
which may block the electrode surface, inhibiting ET and restrain the sensitivity of the electrode.110-112 High density (HD) SWNT network electrodes have been shown to
enhance sensitivity and stability of DA oxidation (Figure 1.11b).64 The HD SWNT
networks with low resistivity and background current, show promise in biosensor
applications especially in challenging biological media where fouling is evident on
conventional electrodes.113, 114
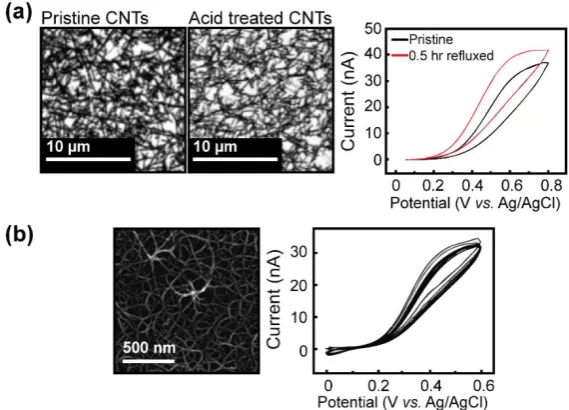
Figure 1.11 (a) FE-SEM images of pristine and 2 hours acid treated SWNT
networks, CVs for the oxidation of 1 mM DA in 0.1 M citric acid pH 7.2 PBS,
showing kinetically favored after acid treatment of SWNT network electrode.6 0
(b) FE-SEM image of HD SWNT network, showing good electrode stability with
[image:45.595.174.459.454.659.2]21
1.2.4.2 Hydrazine detection
HZ is a widely used in the chemical and pharmaceutical industries. However,
HZ is a carcinogenic and hepatotoxic compound which is harmful to human health.
115-117 Thus, the development of strategies for sensitive and reliable HZ detection is
becoming more important, with EC detection showing promise.23, 118
The overall reaction of HZ oxidation depends on the pH. For instance, in acidic
media the reaction can be stated as:119, 120
N2H5+→ N2 + 5H+ + 4e− Eo= ‒0.23 V (vs. NHE) (20)
whereas in alkaline media it is:121
N2H4 + 4OH‒→ N2 + 4H2O + 4e− Eo= ‒0.33 V (vs. NHE) (21)
The use of porous carbon, derived from filter paper (PCDF), can electrocatalyze the HZ oxidation reaction.122The intertwined structure of the cellulose
matrix in the filter paper is beneficial to serve as a self-template, the cellulose material
and the metal-amine complexes act as precursors and the silica coating around
cellulose structure as a protecting shell, the nanoporous carbon electrocatalysts were
eventually formed (Figure 1.12a), showing good electrocatalytic activity towards HZ
oxidation reaction. Besides, the reduced graphene sheets (RGSs) possess excellent
electrocatalytic properties towards the HZ oxidation in alkaline media (Figure
22
Figure 1.12 (a) FE-SEM image of PCDF, CVs for HZ oxidation with different
concentration (0 to 50 mM) in 0.1 M PBS (pH 7.4).1 2 2 (b) AFM image of RGSs
deposited on the mica substrate, CVs at (a and c) the bare GC and (b and d)
RGSs/GC electrode (a and b) in the absence and (c and d) in the presence of 10
mM HZ in 0.1 M KOH solutions. RGSs/GC electrode displays high
electrocatalytic activity towards the oxidation of HZ with lower overpotenti al
and a higher peak current as compared to bare GC.1 2 3
1.2.4.3 Carbon-based electrocatalysts for the alcohol oxidation reaction
(AOR)
Understanding of the AOR (methanol oxidation reaction (MOR) and ethanol oxidation reaction (EOR)) is vitally important in fuel cell research. The commercial success of fuel cells is hindered by the high cost associated with noble metal electrocatalysts (i.e.
Pt), typically used to facilitate these reactions.124, 125 Additional problems include that Pt catalysts are readily poisoned by intermediate carbonaceous species (i.e. CO) produced during the AOR, which serve to reduce their electrocatalytic activity.126, 127
23
through allowing the use of smaller amount of the expensive Pt, the electrode performance so far has been limited in success.124, 128, 129 Pristine CNTs are ineffective
as AOR catalysts as the reaction requires adsorption sites for the intermediates reaction, which are not readily available in the pure sp2 structure. However, CNTs which exhibit a high surface area can act as a support material for metal or metal oxides catalysts and CNT networks provide a high electric conductivity for fast electrocatalysis of AOR.130, 131 For instance, CNT supported Pt NPs have
demonstrated significant enhancement of catalytic activity in MOR.132, 133
There is a need to find alternative and cheaper materials, which perform well in terms of electrocatalytic activity. Nickel hydroxide (Ni(OH)2) is one such material
that exhibits high EC activity and cost effectiveness and so this electrode has been the focus of considerable attention.88, 134-137 Ni(OH)
2 prepared at low temperatures usually
contains defects, which are particularly active for the dissociative adsorption of water molecules to form OHad species in alkaline electrolytes.138 The interaction between
Ni(OH)2 and OHad species is neither too strong nor too weak, which has the maximum
activity to participate in electrocatalytic reactions.139 Besides, it is well known that the electrocatalytic activity of Ni(OH)2 results from the oxidized form, Ni(OOH):89
Ni(OH)2 + OH-⇌ NiOOH + H2O + e- (22)
The interconversion of Ni(OH)2/NiOOH acts as an electronic mediator,
contributing to the superior catalytic activity for the AOR:140
NiOOH + organic compound → Ni(OH)2 + byproduct (23)
24
molecules and removing the carbonaceous product from poisoning the Pt electrode.131 For instance, Pt-Ni(OH)2–graphene ternary hybrids which were produced via a
two-step solution method, as shown in Figure 1.13a, exhibit excellent activity and durability towards the MOR as shown in Figure 1.13b.
Figure 1.13 (a) A schematic depicting the two -step solution method to prepare
the Pt/Ni(OH)2/rGO-4 materials. (b) Corresponding transmission electron
microscopy (TEM) image of ternary hybrid materials, CV curves of
Pt/Ni(OH)2/rGO-4, Pt/rGO hybrid and standard 20 wt % Pt/C in 1 M methanol/1
M KOH, short -term durability measurement at ‒0.30 VS C E for Pt/Ni(OH)2
/rGO-4, Pt/rGO, standard 20 wt % Pt/C and 20 wt % PtRu/C. Pt/Ni(OH)2/rGO-4
25
1.3
Introduction to Li-O
2batteries
The nonaqueous rechargeable Li- O2 battery has been of great interest in developing
practical device for road transportation owing to its high theoretical energy density of 3,458 Wh kg-1.141
Figure 1.14 Schematic of nonaqueous Li-O2 battery design.
The fundamental EC reaction of the Li-O2 battery (Figure 1.14) can be written
as,142 Anode:
Li ⇌ Li+ + e‒ (24) Cathode:
2Li+ + 2e‒ + O2 ⇌ Li
2O2 Eo= 2.96 V (vs. Li/Li+) (25)
whilst the net EC reaction is:
26
with the forward process corresponding to discharge of the battery and the backward reaction describing charge reaction.143-145 Significant efforts, dedicated to the design
of cathodes for Li-O2 batteries, which give a uniform supply of O2 throughout
discharge have been made.146 However, the formidable challenge arises from the electrical passivation of the cathode material during battery cycling,147, 148 resulting in poor rechargeability and lower capacity.149 The Li2O2 is an electronic insulator150 and
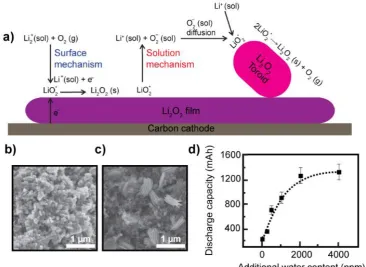
hinders charge transfer from cathode to Li2O2-electrolyte once the build-up of Li2O2
has a thickness of above 10 nm.151 To alleviate this, better ways of controlling the discharge product morphology and engineering different cathode structures have to be pursued, to allow for extended cycling and to yield higher capacities for the battery. Li2O2 toroid is believed to circumvent the charge transport limitations.149 This is an
interesting structure, but their electrocatalytic properties have not been widely studied to date.
1.3.1
Formation of Li
2O
2toroid
There are two EC pathways for Li2O2 growth, namely surface and solution
mechanisms as shown in the schematic in Figure. 1.15. The surface mechanism can be written as:152
O2∗ + Li+(sol) + e− → LiO 2
∗ Li→ Li+(sol) +e−
2O2(s) (27)
where * describes a surface-adsorbed species. The surface growth results in a homogenous Li2O2 layer, which terminates beyond the electron tunnelling thickness
27
The slower pathway for the growth of Li2O2 crystal is a solution-mediated
mechanism, which is induced by soluble oxygen species (O2−) in the presence of water149 or at relatively low overpotentials,153 and can be written as:
LiO2∗ → Li+(sol) + O2−(sol) (28)
The O2−(sol) undergoes reaction on a growing Li2O2 crystal on top of the
existing Li2O2 conformal layer which is O-rich surface (primarily at kink site or defects
on an already nucleated layer),152, 154 which is given by:149
2Li+(sol) + 2O2−(sol) ⇌ Li
2O2(s) + O2(g) (29)
The proposed mechanism149 as shown in Figure 1.15a is that: (a) LiO2∗ solvates from the O-rich Li2O2 conformal layer, (b) O2−(sol) diffuses to the growing crystal and
form LiO2∗, (c) the disproportionation of two LiO2∗ results in formation of Li2O2 on a
growing crystal and eventually toroidal Li2O2 particles are generated and (d) LiO2∗ is
restored via the reaction in equation 27.
The stability of Li+ and O2− ions depends on the Gutman donor number (DN)
and acceptor number (AN).149 The addition of water with a high AN of ~ 55 kcal mol
-1 enhances the dissolution of O
2
−, encouraging the solution mechanism to form Li
2O2
toroid structures. For instance, Li2O2 toroids grew as the water content increased from
500 ppm (Figure 1.15b) to 2000 ppm (Figure 1.15c). The resulting discharged capacity also increases with the water content (Figure .1.5d) due to the solution mediated Li2O2
toroids. However, the addition of water also introduces the parasitic side reactions caused by an increase in charging potential.155 Therefore, water is not a good additive.
28
Dimethyl sulfoxide (DMSO) has high DNs (29.8 kcal mol-1) and thus, it stabilizes Li+ and is effective in promoting solution mechanism.
Figure 1.15 (a) Schematic of the Li2O2 crystal growth via a surface mechanism
and solution mechanism. FE -SEM image of the discharged cathodes (capacity of
1 mAh at a rate of 50 µA) using 1 M LiTFSI in DME with water of (b) 500 ppm
and (c) 2000 ppm. (c) Discharge capacities (discharge to a redu ctive potential of
2.3 V (vs. Li/Li+) at a discharge rate of 250 µA) for the batteries with varying
water content.1 4 9
1.4
Aims of thesis
[image:53.595.139.506.138.405.2]29
First, carbon electrodes are important for EC sensing and analysis, their EC properties can be further improved in term of detection sensitivity and reduce fouling effect. Second, Li-O2 batteries have received great attention for the development of a safe and cost-effective secondary batteries with high specific energy, yet fundamental aspects of their behaviour are unclear. This works highlights the importance of the precise control over the surface functionalization and surface nano-architectures, to optimize and to design the EC sensor and the cathode material for effective Li-O2
battery. After describing the experimental methods and details, the following results and discussion chapters are presented.
Chapter 2introduces the technical and experimental fundamentals of this thesis. Chapter 3 is concerned with surface functionalization of the SWNT networks for effective DA electro-oxidation in terms of facile ET and making the electrodes less susceptible to blocking.
Chapter 4 compares the SWNT network electrodes of different densities and commercially available SPCE for trace level detection in challenging media.
Chapter 5 explores the electrodeposition of Ni(OH)2 NPs on SWNT network
electrodes for effective AOR.
Chapter 6 explores the surface properties and HZ electro-oxidation of surface
“blistered” HOPG produced after electro-oxidation in HClO4.
Chapter 7 investigates the fundamental behavior of redox activity at Li2O2 toroids in
non-aqueous media.