warwick.ac.uk/lib-publications
Original citation:
Großkopf, Tobias, Consuegra, Jessika, Gaffé, Joël, Willison, John C., Lenski, Richard E., Soyer,
Orkun S. and Schneider, Dominique. (2016) Metabolic modelling in a dynamic evolutionary
framework predicts adaptive diversification of bacteria in a long-term evolution experiment.
BMC Evolutionary Biology, 16 (1).
Permanent WRAP URL:
http://wrap.warwick.ac.uk/81189
Copyright and reuse:
The Warwick Research Archive Portal (WRAP) makes this work of researchers of the
University of Warwick available open access under the following conditions.
This article is made available under the Creative Commons Attribution 4.0 International
license (CC BY 4.0) and may be reused according to the conditions of the license. For more
details see:
http://creativecommons.org/licenses/by/4.0/
A note on versions:
The version presented in WRAP is the published version, or, version of record, and may be
cited as it appears here.
R E S E A R C H A R T I C L E
Open Access
Metabolic modelling in a dynamic
evolutionary framework predicts adaptive
diversification of bacteria in a long-term
evolution experiment
Tobias Großkopf
1, Jessika Consuegra
2,3, Joël Gaffé
2,3, John C. Willison
4,5,6, Richard E. Lenski
7,8, Orkun S. Soyer
1*and Dominique Schneider
2,3*Abstract
Background:Predicting adaptive trajectories is a major goal of evolutionary biology and useful for practical applications. Systems biology has enabled the development of genome-scale metabolic models. However, analysing these models via flux balance analysis (FBA) cannot predict many evolutionary outcomes including adaptive diversification, whereby an ancestral lineage diverges to fill multiple niches. Here we combinein silicoevolution with FBA and apply this modelling framework, evoFBA, to a long-term evolution experiment withEscherichia coli.
Results:Simulations predicted the adaptive diversification that occurred in one experimental population and generated hypotheses about the mechanisms that promoted coexistence of the diverged lineages. We experimentally tested and, on balance, verified these mechanisms, showing that diversification involved niche construction and character displacement through differential nutrient uptake and altered metabolic regulation.
Conclusion:The evoFBA framework represents a promising new way to model biochemical evolution, one that can generate testable predictions about evolutionary and ecosystem-level outcomes.
Keywords:Adaptive diversification, Experimental evolution, FBA,In silicoevolution, Tradeoffs
Background
The ability to predict evolution would be valuable not only for understanding such processes as adaptation and speci-ation [1–3], but also for engineering robust industrial strains, anticipating ecosystem responses to climate change, and combatting antibiotic resistance [4–7]. Models that capture the relationship between genotypes and environ-ments, the structure and state of regulatory and metabolic networks, and the resulting phenotypes are likely to be im-portant for developing these predictive abilities [1, 3, 8].
Ultimately, models of the relationship between genotype and phenotype will need to be combined with models of evolutionary and ecological dynamics in integrated frame-works that can predict the trajectory of evolution [5, 9].
The dynamics of evolutionary change reflect multiple processes and varying selective pressures that are influ-enced by many ecological, physical, and cellular constraints that may conflict with one another. Understanding whether and how these dynamics lead to the splitting and divergence of lineages is of central interest, as these processes represent the initial steps towards speciation. To this end, several theoretical studies have shown that cellular tradeoffs can promote lineage divergence [10–16]. The importance of such tradeoffs can be readily under-stood in the context of metabolism and growth. For example, if there were no tradeoffs, then one would pre-dict that cells should maximize their expression of trans-porters and their surface area to achieve the highest
* Correspondence:
[email protected];[email protected] Tobias Großkopf and Jessika Consuegra are shared first authors. 1School of Life Sciences, University of Warwick, Coventry, UK 2University of Grenoble Alpes, Laboratoire Techniques de l’Ingénierie Médicale et de la Complexité - Informatique, Mathématiques et Applications, Grenoble (TIMC-IMAG), F-38000 Grenoble, France
Full list of author information is available at the end of the article
possible rate of substrate uptake [17]. However, such cellular investments would impinge on other cellular pro-cesses owing to competing requirements for membrane and cytosol space [18, 19], ribosomes [15, 16], and redox carriers [20, 21]. Thus, cells may appear suboptimal for individual physiological parameters, but this might be merely a consequence of being optimal for the combined set of parameters and associated cellular tradeoffs.
Historically, the interplay between cellular tradeoffs and evolutionary and ecological dynamics has been ana-lyzed using game theory and differential equation-based models that consider small or idealized metabolic sys-tems [10, 11, 14, 22]. These studies have highlighted that tradeoffs in cellular metabolism can lead to incomplete degradation of a resource, resulting in the evolution of cross-feeding interactions [10, 11]. This phenomenon has been seen in several evolution experiments under both batch and chemostat conditions [23–27]. To in-crease predictive power in microbial ecology and evolu-tion, it is now desirable to develop models that can take into account cellular metabolism at a larger scale and across different organisms. Stoichiometric models offer a promising approach because, in principle, they can capture all enzyme-mediated metabolic reactions of an organism in an unbiased and non-supervised way using genomic information [8].
Flux Balance Analysis (FBA) has been developed to de-termine the optimal metabolic state of an organism, given knowledge of its biochemical network, biomass composition, and uptake flux rates [28]. This approach is based on the assumptions that evolution has opti-mized metabolism and that metabolic fluxes can be pre-dicted by setting the growth rate for a given rate of substrate uptake (such that the ratio of the two rates represents a yield) as an optimization criterion that can be solved by linear programming [28–30]. Early applica-tions of FBA ignored the essential role of tradeoffs in the computation of metabolic fluxes [28, 31, 32], but more recent applications have incorporated tradeoffs as con-straints on total fluxes [18, 19, 33, 34] and thereby achieved better prediction of experimentally observed metabolic states, such as preferential substrate utilization [19] and acetate overflow [18]. Experimentally measured reaction thermodynamics and gene expression levels have also been used to constrain optimal metabolic states that reflect tradeoffs [35–37], and there have been efforts to combine FBA with ecological interactions between mul-tiple species in microbial communities [38–45]. These approaches use species-specific models in a shared en-vironment to maximize a predefined, community-level objective [39, 41, 43, 44] or apply FBA within a dynamic framework [46]. The latter approach enables prediction of ecological interactions such as competition and cross-feeding between different species making up the model
community, given defined substrate uptake constraints for each model species [40, 42, 45]. However, none of these approaches can currently be used to predict the interplay between ecological and evolutionary dynamics.
Here, we begin to overcome these limitations by inte-grating a FBA model of multi-phenotype systems with both cellular constraints and evolutionary dynamics. We define an overall constraint on uptake rates to enforce tradeoffs while simulating multiple model organisms living in the same environment without the need to specify each organism’s uptake preferences a priori (for details on how evolution and mutations are simulated see Methods section). By limiting total uptake in the model, and including O2“uptake” in that total, we seek
to represent cellular limitations that can arise from many diverse processes, including redox cycling [20, 47], respira-tory chain [18], enzyme expression [16, 48], and substrate uptake [17]. Although O2 uptake per se might not be
limiting, limitations in the electron transport chain can effectively limit O2respiration. Accounting for all the
dif-ferent possible limitations arising from cellular processes in a mechanistic manner is beyond the scope of stoichio-metric models; however, limiting total uptake provides a general constraint that allows us to implement the trade-offs observed in different studies in a simple, consistent, albeit approximate manner [16–18, 20, 47].
This approach allows integration of evolutionary dy-namics by mutations that change substrate uptake rates along with the optimization of each model organism in the context of other model organisms that are present and coevolving in the same environment. The combined framework, which we call evoFBA, thus aims to provide a more realistic way to model the interplay between ecological and evolutionary dynamics with global con-straints arising from cellular tradeoffs. To the best of our knowledge, this is the first FBA modeling approach that captures the continuous adaptation of organisms to the interplay between ecological and evolutionary dynamics in systems with multiple strains or species.
To examine the ability of evoFBA to capture ecological and evolutionary dynamics, we used it to simulate the evolution of Escherichia coli populations in a defined glucose-limited environment with daily transfers. We then experimentally analyzed the predictions of evoFBA in the context of the long-term evolution experiment (LTEE) with E. coli, in which 12 populations started from a common ancestor have been propagated in a glucose-limited medium for more than 60,000 genera-tions [2, 49]. We found that the evoFBA simulagenera-tions predicted the emergence of cross-feeding model organisms as a stable end-point, which in fact has occurred in at least one of the LTEE populations [26, 50]. Moreover, we saw that key metabolic features of the model organisms were in qualitative agreement with the physiological properties we
measured for the two biological lineages that emerged and subsequently coexisted for more than 50,000 generations.
Results
Microbial communities and their underlying metabolic interactions reflect the ecological and evolutionary histories of the component species [51]. To capture these interac-tions, we combine stoichiometric metabolic models with ecological and evolutionary dynamics in the multi-layered evoFBA framework (see Methods). To test the utility of this framework, we apply it to the LTEE in whichE. coli
populations evolve in a defined glucose-limited environ-ment [2, 52].
To model the LTEE, we ran evoFBA simulations starting with a metabolic model of E. coli that accounts for 14 carbon sources including glucose and byproducts that can be scavenged from the environment to produce biomass and fuel associated core metabolic reactions. In each evoFBA simulation, we allowed the metabolic model to
change by random mutations under global constraints that must be obeyed. Thus, each simulation produced mutant model organisms exhibiting different uptake rates, metabolic flux patterns, and resulting growth rates.
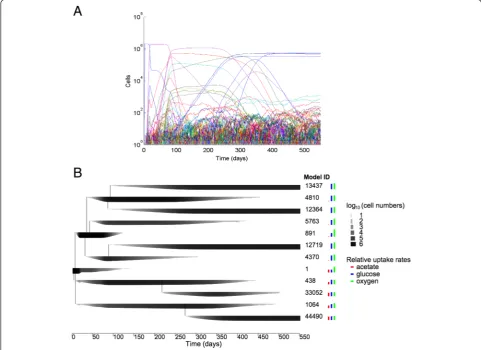
evoFBA predicts evolution of cross-feeding between lineages with different metabolic flux distributions Starting from a population of identical model organisms under conditions similar to the LTEE, a typical evoFBA simulation produced through random mutations more than 90,000 genetically distinct model organisms over 550 simulated daily transfer cycles (Fig. 1). The evolutionary dynamics across replicate simulations were highly repro-ducible in their key features, in particular the diversifica-tion of the populadiversifica-tion into two coexisting lineages (Fig. 2). Thus, throughout the paper, we will focus on results from a typical representative simulation that resulted in 97,912 different model genotypes, of which 3943 survived at least one transfer event (Fig. 1a) and 12 reached a population
[image:4.595.56.538.325.675.2]Fig. 2(See legend on next page.)
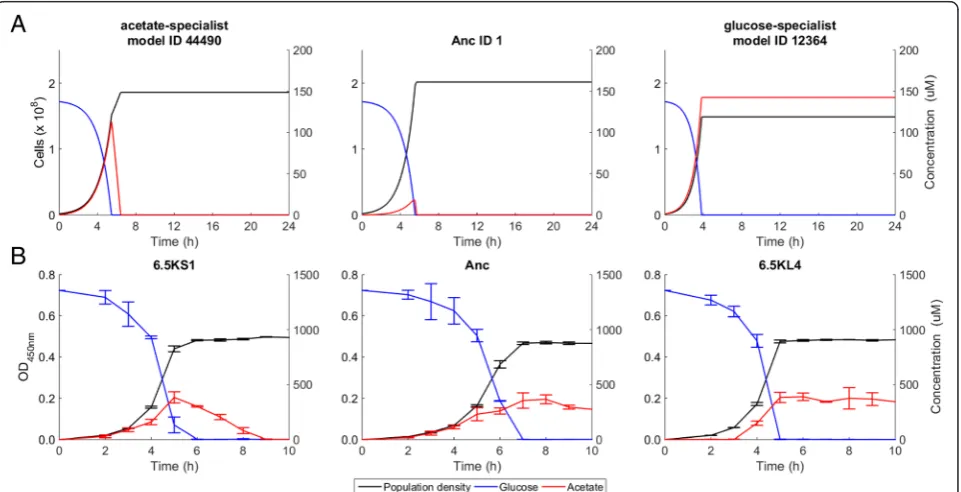
[image:5.595.60.535.87.710.2]size of at least 105cells at some point (Fig. 1b). These sim-ulations revealed specific changes in oxygen, glucose, and acetate uptake by the model organisms (Fig. 1b). Glucose uptake and incomplete oxidation resulted in acetate secre-tion by the ancestral model organism, which would then switch to acetate uptake and oxidation after the glucose was exhausted. Thus, the ancestral model displayed a dia-uxic shift (Fig. 3a), as observed inE. coli [21]. As the in silico evolution proceeded, new model organisms arose that had increased glucose uptake and acetate production. The resulting increase in acetate concentration generated an ecological niche that was colonized by other model organisms with increased acetate uptake but reduced glucose uptake. After ~300 simulated daily transfer cycles (~2000 generations), the simulated evolution came to a halt, with no mutant model organisms able to replace the dominant ones. Thus, thein silicodynamics produced two distinct lineages that specialized on glucose and acetate,
respectively. The glucose-specialist model organisms lost the ability to consume acetate, whereas the acetate-specialist model organisms retained the ability to con-sume glucose but at a lower rate, and the timing of their diauxic shift was changed (Fig. 3a). As a conse-quence, the simulation led to a stable cross-feeding relationship between two lineages of model organisms.
We then examined the metabolic fluxes for the two model organisms when growing on glucose and acetate (Fig. 4). On glucose, both the glucose and acetate specialists displayed similar behaviours, using the TCA cycle only partially and the glyoxylate shunt not at all (Fig. 4a and c). After switching to acetate consumption (which the glucose specialists could not do), the acetate specialists showed very different fluxes, with reverse glycolysis and full use of the TCA cycle including the glyoxylate shunt (Fig. 4b and d). We emphasize that the emergence of cross-feeding model organisms and their
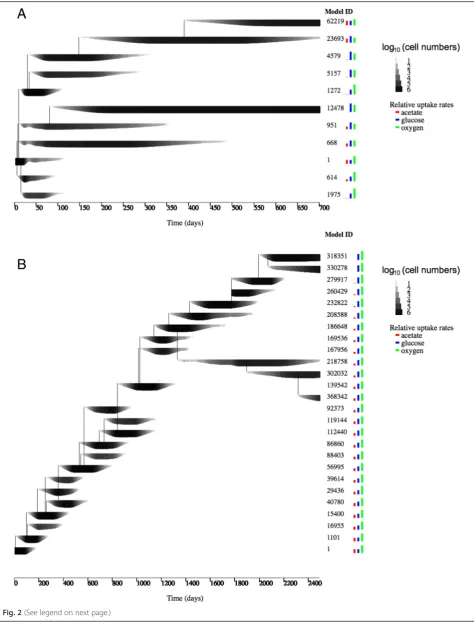
(See figure on previous page.)
Fig. 2Replicate runs of evoFBA.aOne of five replicate simulations using the same parameter set as described in the main text and shown in Fig. 1. All simulations led to qualitatively similar outcomes.bRunning evoFBA simulations with a smaller maximum mutation step size (+/−1 mmol/gDW/h), see Methods eq. 5), led to the same diversification into glucose specialist and glucose-acetate co-utilizing model organisms, although the time required to achieve the diversification was substantially longer. Model ID, line thickness and coloured bars are the same as in Fig. 1
[image:6.595.59.540.415.661.2]associated fluxes in the evoFBA simulation represents an idealized evolutionary stable state given the assumptions of the evoFBA framework.
Adaptive diversification in one LTEE population, matching evoFBA predictions
Two distinct lineages had emerged in one of the LTEE populations, called Ara-2, by 6500 generations, and they have coexisted ever since [26, 50]. The lineages are called S (small) and L (large) after their colony sizes on agar plates. The maintenance of this polymorphism de-pends on a cross-feeding interaction in which the L type is a better competitor for the exogenously supplied glu-cose and the S type is better at using one or more
secreted byproducts [26], although the precise ecological and metabolic mechanisms are still unknown. Therefore, we used predictions from the evoFBA simulations to generate hypotheses about these mechanisms.
We hypothesized that, first, L specializes on glucose and secretes acetate and, second, S specializes by im-proved acetate consumption. We tested this hypothesis by analyzing two evolved clones sampled at generation 6500 from the S and L lineages, named 6.5KS1 and 6.5KL4, respectively. HPLC analyses confirmed the pres-ence of acetate in a 24-h supernatant of 6.5KL4 that was grown in the same medium as the LTEE (see Methods). Acetate was not detected after growing 6.5KS1 in that supernatant (Additional file 1: Figure S1). We then
Fig. 4Metabolite turnover fluxes in glycolysis and TCA cycle. Fluxes in the glucose specialist (a,b) and the acetate specialist (c,d) genotypes (model IDs 12364 and 44490, respectively) during growth on glucose (a,c) and acetate (b,d). The following metabolites and reactions are shown: ac, acetate; actp, acetyl-phosphate; akg, alpha-keto-glutarate; cit, citrate; f6p, fructose-6-phosphate; fum, fumarate; glx, glyoxylate; g6p, glucose-6-phosphate; icit, isocitrate; mal, malate; oaa, oxaloacetate; pep, phospho-enol-pyruvate; succ, succinate; succoa, succinyl-coenzyme a. PGI, ACN, ACE, and ACK are the reactions catalyzed by glucose-phosphate isomerase, aconitate hydratase, malate synthase, and acetate kinase, respectively (shown inblue). Thickness of thearrowindicates the flux over the given reaction; the referencearrowat thebottom rightshows a flux of 10 mmol/gDW/h
[image:7.595.57.539.88.480.2]measured the acetate and glucose concentrations over time in cultures of the ancestor, 6.5KS1, and 6.5KL4 clones in DM250-glucose medium (Fig. 3b). Both the L and S clones consumed glucose faster than the ancestor, consistent with previous assays [53]. Moreover, in agree-ment with the evoFBA results, 6.5KL4 secreted acetate, with its concentration remaining high for many hours in the monoculture, and 6.5KS1 drew down its own acetate secretion much faster than both 6.5KL4 and the ancestor. After exhausting the glucose by 6 h, 6.5KS1 showed diauxic growth and consumed acetate until it was depleted after 9 h, whereas 6.5KL4 had barely, if at all, begun to consume acetate at that time even as it had exhausted the glucose by 5 h (Fig. 3b). These results support the hy-pothesis that the stable coexistence of S and L depends on acetate cross-feeding, with acetate production by both the L and S lineages and more efficient acetate scaven-ging by the S lineage, which exhibits a faster metabolic switch from glucose to acetate (Additional file 2: Figure S2).
Physiology and fluxes in S and L clones agree qualitatively with evoFBA
The evoFBA simulation reaches an evolutionary equilib-rium, whereas the interaction between the S and L lineages remained highly dynamic over thousands of generations [26]. Therefore, we examined the metabolic divergence of the S and L lineages over the course of the LTEE. We first measured the ability of clones from earlier and later generations to grow in minimal media containing glucose or acetate. S clones from later generations typi-cally grew faster and with a shorter lag phase on acetate and more slowly on glucose than S clones from earlier generations, while the opposite trends were observed in the L lineage (Additional file 3: Figure S3) (in line with previous observations [53]). Compared to the ancestor, S clones improved their growth on acetate over evolu-tionary time, while L clones initially improved some-what but were variable, with the 50,000-generation L clone showing weak growth similar to the ancestor (Fig. 5). On glucose, the opposite trend was observed with L clones consistently improving compared to the ancestor, while S clones improved initially but declined in later generations (Fig. 5). These patterns of growth relative to the ancestor are consistent with previous as-says using the LTEE clones [53, 54]. These evolutionary trajectories of growth on acetate and glucose indicate character displacement and suggest tradeoffs that pre-vent the simultaneous optimization of growth on both carbon sources. The trajectories are qualitatively consist-ent with the evoFBA simulations, although the evoFBA predicts complete specialization on glucose without any acetate consumption. This evoFBA prediction represents a potential evolutionarily stable end point, which might
eventually occur in the S and L lineages after more generations.
We then tested the flux patterns predicted by evoFBA (Fig. 4) by measuring, in several LTEE clones, the pro-moter activities of genes encoding four key metabolic enzymes, using transcriptional fusions with the gfp re-porter gene (see Methods). Both S and L clones showed moderately increased promoter activity for pgirelative to the ancestor (Fig. 6). Both S and L clones exhibited larger increases in the promoter activities of acnB and
aceBrelative to the ancestor, with the S clones showing much greater increases than the L clones, consistent with the possibility of greater flux through the TCA cycle and glyoxylate shunt in the S acetate specialists. There were no obvious changes in the promoter activi-ties of ackA in either the S or L lineages. Of course, there may be discrepancies between promoter activities and actual enzyme activities [55, 56]. Nonetheless, these patterns agree reasonably well with the flux pre-dictions from the evoFBA simulations, especially as they relate to the higher activities in the S lineage of the genes that specifically promote growth on acetate. As noted above, we reiterate that the evoFBA simula-tions predict an eventual complete loss of the acetate-specific activities in the L lineage, whereas thus far they are merely expressed at a lower level in the L lineage than in the S lineage.
Discussion
We developed a modeling framework, called evoFBA, which combines metabolic models that are amenable to FBA with an evolutionary algorithm to simulate the interplay of evolutionary and ecological dynamics in systems with multiple strains or species. We applied evoFBA to the LTEE withE. coliand predicted the emer-gence of two stably coexisting lineages with distinct metabolic flux distributions that promote a cross-feeding interaction. These predictions fit with the polymorphism seen in the Ara–2 population, where two lineages emerged early in the LTEE that have now coexisted for tens of thousands of generations [26, 50]. The evoFBA simula-tions enabled us to hypothesize specific ecological and physiological mechanisms that generate and sustain this polymorphism, and we then tested these hypotheses using the bacteria from that LTEE population. On balance, we found that the ecological, physiological, and metabolic properties of these coexisting lineages agree reasonably well with the predictions of the evoFBA.
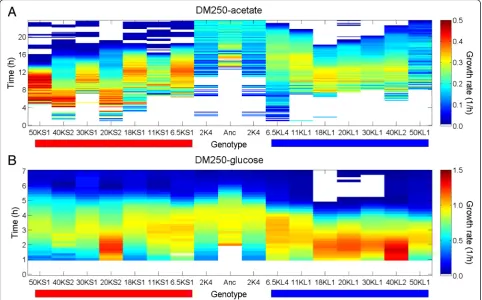
Fig. 5Changes in growth rates of S and L on glucose and acetate over evolutionary time. Growth of S and L clones sampled at multiple generations of the LTEE was followed in DM250-acetate (a) and DM250-glucose (b) media. Clone names are shown above the horizontal red and blue bars, which denote S and L clones, respectively. The ancestor (Anc) and a 2000-generation clone (2 K4) isolated prior to the divergence of the S and L lineages are also included. Growth rates (1/h) are shown according to the colour scale for 1-h sliding windows over 24-h and 7-h periods in the acetate and glucose media, respectively. Empty cells indicate missing values based on filtering negative rates or unreliable values (see Methods)
Fig. 6Transcription levels of four genes encoding metabolic enzymes in the ancestor and evolved clones. Promoter activities measured as (dGFP/dt)/OD450nmfor genes involved in glucose and acetate metabolism during the first 8 h of growth in DM250-glucose. The clones are, from left to right: 50KS1, 6.5KS1, ancestor (Anc), 6.5KL4 and 50KL1. The genes are, from top to bottom:pgiencoding glucose phosphate isomerase, acnBencoding aconitate hydratase,aceBencoding malate synthase A, andackAencoding acetate kinase. Activity values are means based on three-fold replication of each assay
[image:9.595.57.540.89.389.2] [image:9.595.59.539.475.675.2]suggest that other populations may have evolved cross-feeding interactions similar to the one studied here, even if they were not always so persistent [59]. One possible explanation for why persistent polymorphisms did not evolve in the other populations is that the establishment of the S lineage appears to have involved epistatic interactions between multiple mutations [50], which may have limited its evolutionary accessibility [58]. This possibility reflects one of the limitations of evoFBA, which cannot capture all of the intricacies of biological evolution but instead predicts optimal end states that emerge given the simplifying assumptions of this approach. For example, mutations in evoFBA affect the rates of resource uptake, but not the rates of internal reactions in the model. This limitation reflects the computational burden of simulating a multitude of mutant genotypes, the number of which would increase greatly if all reaction rates were subject to mutation. This limitation could be relieved by the development of more efficient algorithms (allowing mutations to affect all reac-tions in the model), but the final evolved model organisms might not differ functionally from those based on the current approach because changes in uptake rates can already affect downstream flux distributions. Another limitation of the evoFBA approach at this time is the assumption that constraints on the uptake fluxes can be changed only by mutation, while the optimization of fluxes within those constraints is immediate through FBA [32]. In other words, metabolic fluxes change within physiological limits without delay, whereas changing the limits themselves requires mutations. These assumptions are reasonable starting points for incorporating evolu-tionary dynamics into an FBA framework, but physio-logical delays in metabolic adjustments are also sometimes important [61, 62]. Expanding the evoFBA framework to include the dynamics of physiological transitions could start by integrating previous work on incorporating gene regulation into FBA [63, 64].
Adaptive diversification is expected, and has occurred, in other evolution experiments besides the LTEE, such as when two exogenous carbon sources are provided [27, 65] and in high-glucose chemostats, where substan-tial acetate is produced [21, 23, 25]. However, the adaptive diversification observed in the LTEE was unexpected owing to the presence of a single carbon source, glucose, which was supplied at a low concentration [52]. Using the evoFBA framework, we predicted that acetate secretion was the primary metabolic driver leading to the emer-gence of the polymorphism, and that prediction was supported by our experiments. The long duration of the LTEE—including several thousand generations to establish the S and L polymorphism [26] and its persistence for tens of thousands of generations [60]—may have facili-tated adaptive divergence under these more restrictive
ecological conditions, in comparison with other studies of much shorter duration where glucose, acetate, or both were supplied exogenously at high concentrations [23, 25, 45]. In fact, low levels of acetate, as observed in our study, have previously been reported to favor generalists as opposed to divergence into coexisting specialists [10]. Nonetheless, the L lineage evolved higher glucose uptake rates, which led to acetate overflow and the construction of a new niche that benefited the S lineage, as occurred in the evoFBA simulations. Thus, niche construction by the bacteria led to the emergence of this polymorphism, in contrast to experiments where both carbon sources were added to the medium [45]. Despite the differences between the LTEE and previous evolution experiments [45, 65], similar metabolic processes emerged.
Conclusion
The combination of evoFBA and experimental evolution provides a useful approach that can give insights into general mechanisms involved in the emergence of bacterial diversity and community construction. This approach may stimulate the development of even more detailed and integrated studies aimed at predicting the outcomes of evolution experiments and dynamics in multi-species systems including synthetic microbial communities [51].
Methods
Evolutionary flux balance analysis (evoFBA)
In each evoFBA simulation, stoichiometric metabolic models were used to simulate clonal populations with distinct genotypes. Each genotype was represented by a metabolic model, which was simulated in a dynamical FBA formalism [46] to evaluate its growth and metabolic flux rates over time. At each time step of the dynamic FBA, the metabolic model was optimized using linear optimization and a pseudo-reaction representing bio-mass as the objective function [66]. This optimization thus maximized growth rate given the constraints on uptake rates, i.e. it optimized biomass yield per substrate [67]. Instead of defining specific uptake rates for a particular set of media components (as in standard FBA studies), we assumed a global constraint for all carbon and oxygen uptake reactions in each model organism. By limiting total uptake in the model (including O2
“uptake”), we represent cellular limitations that can arise from many different factors, including redox cycling [20, 47], respiratory chain [18], enzyme expression [16, 48], and substrate uptake [17]. Similar implementations of global constraints in FBA models have been employed previously to study diauxic shift and substrate preference in
maximization of the FBA objective in order to achieve the most efficient use of cellular resources for growth [34].
New model organisms were generated by random mu-tation from existing ones. Mumu-tations altered specific bounds on individual uptake rates, while maintaining an overall total flux constraint of carbon and oxygen into the model organism. Thus, mutations change how the overall uptake flux is distributed across different substrates, and they allow a second level of optimization to occur over evolutionary time in addition to the optimization that occurs by FBA over the physiological time scale. Focusing evolution on a subset of reactions made computation of the ecological and evolutionary dynamics feasible; even so, the simulations presented here took over 20 days on a dedicated high-performance computer to simulate over 90,000 different model organism genotypes and their associated population and metabolite dynamics. A more complete simulation might encompass genome-scale models with evolution of all reactions in the model and with global constraints on total protein biomass [19] and membrane space [18]. The current implementation of evoFBA was unable to perform such simulations in a reasonable timeframe and with appropriate numbers of replicate simulations; efforts to run evoFBA with muta-tions allowed for all reacmuta-tions caused a slowdown of over 10-fold relative to the current implementation.
For the evoFBA simulations, we implemented the in silico equivalent of the LTEE with E. coli. The simula-tions started with a population comprised of a single model genotype that represented the central metabolism of E. coli [68]. This model included 95 reactions, 75 metabolites, and 20 exchange reactions. The uptake of nutrients from the medium (i.e., the flux over the ex-change reactions) was simulated by a Michaelis-Menten function for each substrate,vj, as follows:
vj¼
vmax;j⋅ Sj
Kmþ Sj
ð1Þ
where vmax,j is the maximum uptake rate of the jth sub-strate in millimoles per g dry weight per h (mmol/gDW/h), [Sj] is the concentration of thejth substrate in mmol/l, and
Km is the half-saturation constant of the transporter in mmol/l. For simplicity, we arbitrarily set the initial Km values for all uptake reactions to 0.01 mmol/l. The vmax,j values were allowed to evolve by mutation (see next section below). The value ofvjwas then used as the uptake bound for the exchange reaction of each substrate when running FBA. For each simulated day, we evaluated each model using dynamic FBA [46] over the course of 24 h with 1-min steps; the simulation used a 10-ml batch reactor, as in the LTEE. At each time step, we set thevjvalues for each
model using Eq.1, used FBA to determine growth rate, and updated the biomass as follows:
BMtþ1;i¼BMt;i 1þ μi
lnð Þ2 ⋅60
ð2Þ
whereBMt,iis the biomass in gDW of the clone rep-resented by the ith model genotype at time t, and μi is the growth rate of that model computed by FBA [29]. After updating the biomass of all model genotypes, the resulting concentration of each substrate was reset as follows:
S
½ j;tþ1¼½ Sj;t− X
i
BMi;t⋅vj;i
60⋅V ð3Þ
where [S]j,tis the substrate concentration of thejth sub-strate at time t (mmol/l),BMiis the biomass of the ith model clone at timet (gDW/l),vj,i is the uptake rate of thejth substrate by theith model genotype as computed by FBA (mmol/gDW/h), andVis the culture volume (l). To mimic the LTEE, we started each day’s culture with glucose at 0.1389 mmol/l. The culture was started with one model genotype (i.e., the core E. coli model [68]) having avmaxfor glucose and acetate of 10 mmol/gDW/h each, and for oxygen of 20 mmol/gDW/h, i.e. the total up-take constraint was set at 40 mmol/gDW/h based on pre-vious values for the combined uptake of carbon and oxygen [67]. The individual uptake rates for 14 carbon sources represented in the E. coli core model (acetate, acetaldehyde, α-ketoglutarate, ethanol, formate, fructose, fumarate, glucose, glutamine, glutamate, lactate, malate, pyruvate, succinate) and oxygen were subject to mutation in evoFBA. The exchange rates for phosphate, ammonia, water, protons, and carbon dioxide had no limits, reflecting the fact that carbon is the growth-limiting factor in the LTEE.
Representing mutations in evoFBA
The point mutation rate ofE. coliin the LTEE (excluding populations that evolved mutator phenotypes [60]) has been estimated to ~10−10 per base pair per generation, which equals ~4 × 10⁻⁴per genome per generation [69]. Directly mapping mutations from bacteria to evoFBA model organisms is not possible. The mutable “genome” in the model organism has only 15 targets, as opposed to thousands of genes and millions of base pairs in anE. coli
genome. Owing to these differences and computational limitations, we introduced mutations at the rate of 10−6 per model cell per generation in evoFBA. During the simulations, mutations were introduced into the popu-lation of each model genotype at each time step (i.e., simulated minute) according to the number of cells
produced in that step and those expected to contain a mutation (Nm(i)) as follows:
Nm ið Þ¼ Niμi
lnð Þ2 ⋅60⋅106 ð4Þ
whereNi is the population size of model organismi. Ni was calculated from the biomass of model clone i di-vided by the mass of one cell in gDW; we used a mass of 600 fg/cell, which was reported previously for exponen-tially growingE. colicells [70]. WhenNm(i)was between 0 and 1,Nm(i)was used as a probability to determine whether or not a mutant was introduced; when Nm(i) was ≥1, a single mutant was always introduced.
As noted, each genotype in evoFBA corresponds to a different stoichiometric model with associated vmax values. When a mutation occurred, one of the uptake re-actions was chosen at random and the maximum rate for that reaction was changed as follows:
vmax;m;new¼ vmax;m;old þ a ð5Þ
where vmax,m,new and vmax,m,oldare the new and old rates for the mutated reaction m, and a is a random number from the uniform distribution over the interval (−10,10). Each individual uptake rate was further constrained to lie between 0 and 40, such that the total uptake rate of 40 mmol/gDW/h was not violated. After any mutation, all other uptake reactions were updated as follows:
vmax;j;new¼
vmax;j;old X
kvmax;k;old
40−vmax;m;new
ð6Þ
wherekincludes all uptake reactions except the mutated one. This adjustment ensures a constant total uptake flux across the membrane of 40 mmol/gDW/h. This mu-tation scheme generates strong tradeoffs between uptake reactions. The large effects of the mutations on reaction rates were chosen for computational speed of the evolu-tionary simulations; additional simulations with smaller maximum mutation steps produced qualitatively similar results (Fig.2).
Simulating serial transfer and selection
To simulate the LTEE’s daily transfer cycles [2], we used dynamical FBA to compute growth over 24 h; selection is a direct consequence of the differential growth of the model genotypes. After 24 h, a dilution was performed by randomly drawing 1 % of the model organisms, which constituted the initial population for the next simulated day. The next day’s medium included 99 % of the initial medium and 1 % of the spent medium from the end of the previous day. The simulated growth and dilution ran for a total of 550 cycles. Results from replicate simula-tions (Fig. 2) are qualitatively similar to those in Fig. 1.
The population dynamics arising from these simulations are expected to give rise eventually to one dominant clone in each stably coexisting lineage. However, similar model organisms may occur within a simulation as a re-sult of independent mutations before any one of them has reached its population maximum (e.g., model geno-types 13437, 12364 and 12719 in Fig. 1). However, if the model organisms differ even slightly in their uptake rates, then one genotype should eventually prevail through com-petitive exclusion, unless the model organisms occupy distinct ecological niches (Fig. 1).
Computation
Simulations were performed using MATLAB (Math Works, Natick, Massachusetts) and dynamic FBA calcu-lations using the COBRA toolbox [71]. The MATLAB scripts used to run evoFBA and analyze the data are freely available at [72].
LTEE and bacterial strains
The LTEE consists of 12 populations founded from the same ancestral strain of E. coli, REL606 [73], that have been propagated since 1988 by daily 1:100 dilutions in Davis minimal medium [52] supplemented with glucose at 25 mg/l (DM25). Here, we focused on one population, called Ara–2, in which two lineages, S and L, diverged before 6500 generations and have co-existed ever since [26, 50, 60]. We studied the ancestor and one clone sampled from each lineage at 6500, 11,000, 18,000, 20,000, 30,000, 40,000 and 50,000 generations. Each evolved clone is named by its generation followed by S or L according to its lineage and an arbitrary numeral for a given clone. For example, 6.5KS1 is a clone from the S lineage that was sampled at 6500 generations.
Media and culture conditions
10 min. Growth rates were computed from filtered OD data as dln(OD450)/dt over a sliding window of 1 h,
using MATLAB. We report the mean of the three repli-cates. Filtering was performed by removing negative growth rates and mean growth rates that were more than 0.2 units above or below the immediately adjacent data points (outliers).
Measuring glucose and acetate concentrations
The ancestor, 6.5KS1, and 6.5KL4 clones were grown in DM250-glucose as described. Samples were taken at time 0 and every h for 9 h. After centrifugation to re-move cells, we measured glucose and acetate concentra-tions in the supernatant using the Glucose Assay Kit (Merck Millipore, Lyon, France) and Acetic Acid Assay Kit (Megazyme, Pontcharra-sur-Turdine, France), respectively, following the manufacturers’recommendations.
Analysis of flux patterns in individual model organisms We simulated the growth of the evoFBA model organisms with IDs 44490 and 12364 (Fig. 1) to obtain the flux values for their biochemical reactions. Each model organism was simulated using dynamical FBA in medium containing 0.1389 mM glucose, the same concentration as in the LTEE. Each simulation ran for ten 24-h periods with daily 1:100 dilutions; the last day was used to record the flux values, in order to remove any effect of the initial condi-tions. The flux patterns for growth on glucose were taken 10 min after the onset of growth (Fig. 4a and c), and for growth on acetate at 388 min because glucose was exhausted while acetate was still present at a substantial level (Fig. 4b and d). From the flux patterns, we identified several reactions of interest that showed differences between the two evolved model organisms (highlighted in blue in Fig. 4).
Identification of metabolites in filtrates of spent cultures of 6.5KL4
We analyzed by HPLC and GC-MS the metabolic by-products secreted by clone 6.5KL4 using filtrates from 24-h spent cultures of that clone in DM25- and DM250-glucose, both before and after growth of clone 6.5KS1. For HPLC, 1 ml of filtrate was acidified with 5 μl 1 M H2SO4, incubated at room temperature for 5 min, and
passed through a 0.45-μm regenerated cellulose syringe filter (PHENEX RC Membrane, Phenomenex, Le Pecq, France). Samples were then analyzed on an Agilent 1260 Infinity HPLC system equipped with a Rezex ROA-Organic Acid (8 %) 300 × 7.8-mm column (Phenomenex) and a diode array detector. The analytical conditions were as fol-lows: mobile phase, 5 mM H2SO4; flow rate, 0.6 ml/min;
column temperature, 35 °C; injection volume, 50 μl; wavelength scan range, 190–400 nm; detection wave-length, 210 nm; and run time, 35 min. Concentrations
of acetate and fumarate in the L-clone filtrates were de-termined from linear standard curves over the ranges of 0–10 mM and 0–100 μM, respectively, and with lower detection limits of 0.1 mM and 0.3μM, respectively. Succinate, lactate, formate, propionate, and butyrate can also be separated under these analytical conditions with detection limits similar to acetate, but they were not detected in any samples.
GC-MS analysis of volatile compounds was performed using an Agilent GC HP6890 gas chromatograph equipped with a Varian CP-WAX 58 column (length, 25 m; internal diameter, 0.25 mm; film thickness, 0.20μm), and coupled to an MSD5973 mass sensitive detector. The sample (600μl) was cooled on ice, acidified with 50μl 4 M HCl, and extracted with 0.375 g NaCl and 650μl ice-cold ether. After vortexing three times for 10 s each, with 30 s cooling intervals, the sample was centrifuged for 5 min at 10,000 rpm and placed on ice for 5 min. The upper organic layer (2.5 μl) was then injected manually into the GC using an ice-cold syringe (injection in split mode, split ratio = 10). The column was held at 40 °C for 1 min, ramped to 200 °C at a rate of 5 °C/min, and held for a further 3 min, giving a total run time of 36 min. The solvent delay for the MSD was 1.4 min and the mass scan range was set to 35–300 atomic mass units. The presence of acetate (retention time 12.2 min) in the L filtrate after growth in both DM25- and DM250-glucose was confirmed by this method. The estimated concentration from the DM250-glucose filtrate was 510μM, which is close to the 480μM detected by HPLC (Additional file 1: Figure S1). The concentration of acetate in the L filtrate from DM25-glucose was about one-tenth that detected in DM250-glucose. Ethanol (retention time 2.1 min) was also detected in the filtrates of all three strains tested (ancestor, 6.5KL4, and 6.5KS1). Other me-tabolites including isopropanol, butanol, acetoin, acetone, formic acid, propionic acid, butyric acid, isobutyric acid, and valeric acid were not detected (with lower detection limits around 50–100μM in scan mode).
Analysis of promoter activities in LTEE clones
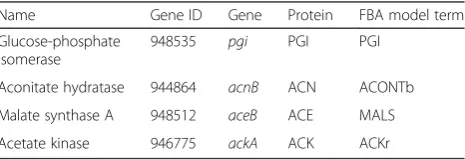
[image:13.595.306.539.652.732.2]We measured the activities of the promoters of four genes—pgi,acnB,aceB, andackA—that encode enzymes associated with reactions of interest (Table 1) given the results of evoFBA (Fig. 4). We used the corresponding
Table 1Genes used in the analysis of promoter activities
Name Gene ID Gene Protein FBA model term
Glucose-phosphate isomerase
948535 pgi PGI PGI
Aconitate hydratase 944864 acnB ACN ACONTb
Malate synthase A 948512 aceB ACE MALS
Acetate kinase 946775 ackA ACK ACKr
reporter plasmids from the E. coli library of gfp tran-scriptional fusions [74]. Each of the four plasmids, as well as the empty pUA66 reference plasmid, was intro-duced into the ancestor, 6.5KS1, 6.5KL4, 50KS1, and 50KL1 clones. Each plasmid-bearing clone was grown in DM250-glucose supplemented with 25μg/ml kanamycin. Both OD450nmand GFP fluorescence were measured every
10 min for 24 h in the microplate reader. Promoter activi-ties were estimated as the rate of GFP production from the promoter region [74]. They were computed using MATLAB as (dGFP/dt)/OD450nm, where GFP is the
fluorescence signal after subtracting the value for the empty plasmid and division by OD450nm standardizes
the data with respect to cell biomass density. We show the mean values from three replicate experiments (Fig. 6).
Additional files
Additional file 1: Figure S1.HPLC profiles of filtrate from spent cultures of 6.5KL4 before and after growth of 6.5KS1. Partial HPLC chromatograms, scaled in milli Absorbance Units (mAU) at 210 nm, showing elution time (min) of key metabolites for the filtrate of a 24-h spent culture of clone 6.5KL4 in DM250-glucose (A), and for the same filtrate after 24 h of growth of clone 6.5KS1 at 37 °C (B). The L filtrate contained 2-hydroxyglutarate, acetate, and fumarate. The S clone consumed the acetate and fumarate, but not the 2-hydroxyglutarate. The acetate peak indicates a concentration of 480μM, whereas the fumarate peak indicates a concentration of only 0.67μM; the molar absorption coefficient of fumarate at 210 nm is more than 300 times greater than that of acetate. (PDF 64 kb) Additional file 2: Figure S2.Diauxic growth in DM250 medium containing glucose and acetate at 10:90 ratio. Clone 6.5KS1 (red) exhibits a diauxic shift from glucose to acetate consumption much earlier than either the ancestor (green) or clone 6.5KL4 (blue). Curves show the average of three biological replicates. (PDF 113 kb)
Additional file 3: Figure S3.Growth curves of the ancestor and evolved clones in DM250-glucose and DM250-acetate media.AGrowth curves of the Anc and pre-divergence clone 2 K4 (both shown in green) on glucose (left) and acetate (right).BGrowth curves of S (red) and L (blue) clones sampled at seven generations (6.5, 11, 18, 20, 30, 40, and 50 K arranged chronologically from top to bottom) on glucose (left) and acetate (right). In each panel, curves show the average (heavy line) of 3–6 replicate assays (lighter lines) for each clone; curves for individual replicates are not always visible when they are close to the mean or other replicates. (PDF 186 kb)
Acknowledgements
JC acknowledges the French ministry of research for a research fellowship. This work was supported by grants from the Biotechnology and Biological Sciences Research Council (BBSRC, BB/K003240/1 to OSS), Agence Nationale de la Recherche Programme Blanc (ANR-08-BLAN-0283-01 to DS), European Union programme FP7-ICT-2013-10 project EvoEvo (610427 to DS), Université Grenoble Alpes (to DS), Centre National de la Recherche Scientifique (CNRS, to DS), the U.S. National Science Foundation (DEB-1451740 to REL), and the BEACON Center for the Study of Evolution in Action (NSF Cooperative Agreement DBI-0939454 to REL).
Authors’contributions
JC, TG, JG performed the experiments, analysed and interpreted the data, and drafted the article; JW performed the HPLC experiments and drafted the article; JC, TG, DS, OSS designed the study, analysed and interpreted the data, drafted and revised the article; REL directs the LTEE and helped draft and revise the article. All authors read and approved the final manuscript.
Competing interests
The authors declare that they have no competing interests.
Author details
1School of Life Sciences, University of Warwick, Coventry, UK.2University of Grenoble Alpes, Laboratoire Techniques de l’Ingénierie Médicale et de la Complexité - Informatique, Mathématiques et Applications, Grenoble (TIMC-IMAG), F-38000 Grenoble, France.3Centre National de la Recherche Scientifique (CNRS), TIMC-IMAG, F-38000 Grenoble, France.4University of Grenoble Alpes, Institut de recherches en technologies et sciences pour le vivant–Laboratoire de chimie et biologie des métaux (iRTSV–LCBM), Grenoble F-38000, France.5CNRS, iRTSV–LCBM, F-38000 Grenoble, France. 6Commissariat à l’énergie atomique (CEA), iRTSV–LCBM, F-38000 Grenoble, France.7Department of Microbiology and Molecular Genetics, Michigan State University, East Lansing, MI 48824, USA.8BEACON Center for the Study of Evolution in Action, Michigan State University, East Lansing, MI 48824, USA.
Received: 21 April 2016 Accepted: 4 August 2016
References
1. Stern DL, Orgogozo V, Pierre U, Bâtiment A, Saint Q. Is genetic evolution predictable? Nonrandom distribution of evolutionarily relevant mutations. Science. 2009;323:746–51.
2. Wiser MJ, Ribeck N, Lenski RE. Long-term dynamics of adaptation in asexual populations. Science. 2013;342:1364–7.
3. de Visser JAGM, Krug J. Empirical fitness landscapes and the predictability of evolution. Nat Rev Genet. 2014;15:480–90.
4. Nesse RM, Stearns SC. The great opportunity: Evolutionary applications to medicine and public health. Evol Appl. 2008;1:28–48.
5. Soyer OS, O’Malley MA. Evolutionary systems biology: What it is and why it matters. BioEssays. 2013;35:696–705.
6. Lohbeck KT, Riebesell U, Reusch TBH. Adaptive evolution of a key phytoplankton species to ocean acidification. Nat Geosci. 2012;5:346–51. 7. Novais Â, Comas I, Baquero F, Cantón R, Coque TM, Moya A, et al.
Evolutionary trajectories of beta-lactamase CTX-M-1 cluster enzymes: Predicting antibiotic resistance. PLoS Pathog. 2010;6:e1000735. 8. Papp B, Notebaart RA, Pál C. Systems-biology approaches for predicting
genomic evolution. Nat Rev Genet. 2011;12:591–602.
9. Prosser JI, Bohannan BJM, Curtis TP, Ellis RJ, Firestone MK, Freckleton RP, et al. The role of ecological theory in microbial ecology. Nat Rev Microbiol. 2007;5:384–92.
10. Doebeli M. A model for the evolutionary dynamics of cross-feeding polymorphisms in microorganisms. Popul Ecol. 2002;44:59–70.
11. Pfeiffer T, Bonhoeffer S. Evolution of cross-feeding in microbial populations. Am Nat. 2004;163:E126–35.
12. Gudelj I, Beardmore RE, Arkin SS, MacLean RC. Constraints on microbial metabolism drive evolutionary diversification in homogeneous environments. J Evol Biol. 2007;20:1882–9.
13. Schuster S, Pfeiffer T, Fell DA. Is maximization of molar yield in metabolic networks favoured by evolution? J Theor Biol. 2008;252:497–504. 14. Pfeiffer T, Schuster S, Bonhoeffer S. Cooperation and competition in the
evolution of ATP-producing pathways. Science. 2001;292:504–7. 15. Molenaar D, van Berlo R, de Ridder D, Teusink B. Shifts in growth strategies
reflect tradeoffs in cellular economics. Mol Syst Biol. 2009;5:323. 16. Weiße AY, Oyarzún DA, Danos V, Swain PS. Mechanistic links between
cellular trade-offs, gene expression, and growth. Proc Natl Acad Sci U S A. 2015;112:E1038–47.
17. Button D. Nutrient uptake by microorganisms according to kinetic parameters from theory as related to cytoarchitecture. Microbiol Mol Biol Rev. 1998;62:636–45.
18. Zhuang K, Vemuri GN, Mahadevan R. Economics of membrane occupancy and respiro-fermentation. Mol Syst Biol. 2011;7:500.
19. Beg QK, Vazquez A, Ernst J, de Menezes MA, Bar-Joseph Z, Barabási A-L-L, et al. Intracellular crowding defines the mode and sequence of substrate uptake by Escherichia coli and constrains its metabolic activity. Proc Natl Acad Sci U S A. 2007;104:12663–8.
20. van Hoek MJ, Merks RMH. Redox balance is key to explaining full vs. partial switching to low-yield metabolism. BMC Syst Biol. 2012;6:22.
22. Schuster S, de Figueiredo LF, Schroeter A, Kaleta C. Combining metabolic pathway analysis with evolutionary game theory. Explaining the occurrence of low-yield pathways by an analytic optimization approach. Biosystems. 2011;105:147–53.
23. Rosenzweig RF, Sharp RR, Treves DS, Adams J. Microbial evolution in a simple unstructured environment: Genetic differentiation inEscherichia coli. Genetics. 1994;137:903–17.
24. Turner PE, Souza V, Lenski RE. Tests of ecological mechanisms promoting the stable coexistence of two bacterial genotypes. Ecology. 1996;77:2119–29. 25. Treves DS, Manning S, Adams J. Repeated evolution of an
acetate-crossfeeding polymorphism in long-term populations ofEscherichia coli. Mol Biol Evol. 1998;15:789–97.
26. Rozen DE, Lenski RE. Long-term experimental evolution inEscherichia coli. VIII. Dynamics of a balanced polymorphism. Am Nat. 2000;155:24–35.
27. Friesen ML, Saxer G, Travisano M, Doebeli M. Experimental evidence for sympatric ecological diversification due to frequency-dependent competition inEscherichia coli. Evolution. 2004;58:245–60.
28. Varma A, Palsson BO. Stoichiometric flux balance models quantitatively predict growth and metabolic by-product secretion in wild-typeEscherichia coliW3110. Appl Environ Microbiol. 1994;60:3724–31.
29. Orth J, Thiele I, Palsson B. What is flux balance analysis? Nat Biotechnol. 2010;28:245–8.
30. Kauffman KJ, Prakash P, Edwards JS. Advances in flux balance analysis. Curr Opin Biotechnol. 2003;14:491–6.
31. Feist AM, Henry CS, Reed JL, Krummenacker M, Joyce AR, Karp PD, et al. A genome-scale metabolic reconstruction forEscherichia coliK-12 MG1655 that accounts for 1260 ORFs and thermodynamic information. Mol Syst Biol. 2007;3:121.
32. Ibarra RU, Edwards JS, Palsson BO.Escherichia coliK-12 undergoes adaptive evolution to achieve in silico predicted optimal growth. Nature. 2002;420:20–3.
33. Heinrich R, Schuster S, Holzhütter H-GG. Mathematical analysis of enzymic reaction systems using optimization principles. Eur J Biochem. 1991;201:1–21. 34. Holzhütter HG. The principle of flux minimization and its application to estimate
stationary fluxes in metabolic networks. Eur J Biochem. 2004;271:2905–22. 35. Hoppe A, Hoffmann S, Holzhütter H-G. Including metabolite concentrations
into flux balance analysis: thermodynamic realizability as a constraint on flux distributions in metabolic networks. BMC Syst Biol. 2007;1:23.
36. Thiele I, Jamshidi N, Fleming RMT, Palsson BØ. Genome-scale reconstruction of Escherichia coli’s transcriptional and translational machinery: A knowledge base, its mathematical formulation, and its functional characterization. PLoS Comput Biol. 2009;5:e1000312.
37. OBrien EJ, Lerman JA, Chang RL, Hyduke DR, Palsson BO. Genome-scale models of metabolism and gene expression extend and refine growth phenotype prediction. Mol Syst Biol. 2013;9:693.
38. Klitgord N, Segrè D. Ecosystems biology of microbial metabolism. Curr Opin Biotechnol. 2011;22:541–6.
39. Zomorrodi AR, Maranas CD. OptCom: a multi-level optimization framework for the metabolic modeling and analysis of microbial communities. PLoS Comput Biol. 2012;8:e1002363.
40. Harcombe WR, Riehl WJ, Dukovski I, Granger BR, Betts A, Lang AH, et al. Metabolic resource allocation in individual microbes determines ecosystem interactions and spatial dynamics. Cell Rep. 2014;7:1104–15.
41. Klitgord N, Segrè D. Environments that induce synthetic microbial ecosystems. PLoS Comput Biol. 2010;6:e1001002.
42. Freilich S, Zarecki R, Eilam O, Segal ES, Henry CS, Kupiec M, et al. Competitive and cooperative metabolic interactions in bacterial communities. Nat Commun. 2011;2:589.
43. Stolyar S, Van Dien S, Hillesland KL, Pinel N, Lie TJ, Leigh JA, et al. Metabolic modeling of a mutualistic microbial community. Mol Syst Biol. 2007;3:92.
44. Khandelwal RA, Olivier BG, Röling WFM, Teusink B, Bruggeman FJ. Community flux balance analysis for microbial consortia at balanced growth. PLoS One. 2013;8:e64567.
45. Louca S, Doebeli M. Calibration and analysis of genome-based models for microbial ecology. Elife. 2015;4:1–17.
46. Mahadevan R, Edwards JS, Doyle FJ. Dynamic flux balance analysis of diauxic growth inEscherichia coli. Biophys J. 2002;83:1331–40.
47. el-Mansi EM, Holms WH. Control of carbon flux to acetate excretion during growth ofEscherichia coliin batch and continuous cultures. Microbiology. 1989;135:2875–83.
48. Basan M, Hui S, Okano H, Zhang Z, Shen Y, Williamson JR, et al. Overflow metabolism inEscherichia coliresults from efficient proteome allocation. Nature. 2015;528:99–104.
49. Lenski RE, Wiser MJ, Ribeck N, Blount ZD, Maddamsetti R, Burmeister AR, et al. Sustained fitness gains and variability in fitness trajectories in the long-term evolution experiment withEscherichia coli. Proc R Soc B. 2015; 282:20152292.
50. Plucain J, Hindré T, Le Gac M, Tenaillon O, Cruveiller S, Médigue C, et al. Epistasis and allele specificity in the emergence of a stable polymorphism in Escherichia coli. Science. 2014;343:1366–9.
51. Großkopf T, Soyer OS. Synthetic microbial communities. Curr Opin Microbiol. 2014;18:72–7.
52. Lenski RE, Rose MR, Simpson SC, Tadler SC. Long-term experimental evolution inEscherichia coli. I. Adaptation and divergence during 2,000 generations. Am Nat. 1991;138:1315–41.
53. Leiby N, Marx CJ. Metabolic erosion primarily through mutation accumulation, and not tradeoffs, drives limited evolution of substrate specificity inEscherichia coli. PLoS Biol. 2014;12:e1001789.
54. Harcombe WR, Delaney NF, Leiby N, Klitgord N, Marx CJ. The ability of flux balance analysis to predict evolution of central metabolism scales with the initial distance to the optimum. PLoS Comput Biol. 2013;9:e1003091. Stelling J, editor.
55. Lewis NE, Hixson KK, Conrad TM, Lerman JA, Charusanti P, Polpitiya AD, et al. Omic data from evolvedE. coliare consistent with computed optimal growth from genome-scale models. Mol Syst Biol. 2010;6:390.
56. Rossell S, van der Weijden CC, Lindenbergh A, van Tuijl A, Francke C, Bakker BM, et al. Unraveling the complexity of flux regulation: a new method demonstrated for nutrient starvation inSaccharomyces cerevisiae. Proc Natl Acad Sci U S A. 2006;103:2166–71.
57. Elena SF, Lenski RE. Long-term experimental evolution inEscherichia coli: VII. Mechanisms maintaining genetic variability within populations. Evolution. 1997;51:1059–67.
58. Blount ZD, Borland CZ, Lenski RE. Historical contingency and the evolution of a key innovation in an experimental population ofEscherichia coli. Proc Natl Acad Sci U S A. 2008;105:7899–906.
59. Maddamsetti R, Lenski RE, Barrick JE. Adaptation, clonal interference, and frequency dependent interactions in a long term evolution experiment with Escherichia coli. Genetics. 2015;200:619–31.
60. Tenaillon O, Barrick JE, Ribeck N, Deatherage DE, Blanchard JL, Dasgupta A, et al. Tempo and mode of genome evolution in a 50,000 - generation experiment. Nature. 2016; in press.
61. Lenski RE, Souza V, Duong LP, Phan QC, Nguyen TNM, Bertrand KP. Epistatic effects of promoter and repressor functions of the Tn10 tetracycline-resistance operon on the fitness ofEscherichia coli. Mol Ecol. 1994;3:127–35. 62. Le Gac M, Brazas MD, Bertrand M, Tyerman JG, Spencer CC, Hancock REW,
et al. Metabolic changes associated with adaptive diversification in Escherichia coli. Genetics. 2008;178:1049–60.
63. Shlomi T, Eisenberg Y, Sharan R, Ruppin E. A genome-scale computational study of the interplay between transcriptional regulation and metabolism. Mol Syst Biol. 2007;3:101.
64. Covert MW, Palsson B. Transcriptional regulation in constraints-based metabolic models ofEscherichia coli. J Biol Chem. 2002;277:28058–64. 65. Spencer CC, Bertrand M, Travisano M, Doebeli M. Adaptive diversification
in genes that regulate resource use inEscherichia coli. PLoS Genet. 2007;3:0083–8.
66. Feist A, Palsson B. The biomass objective function. Curr Opin Microbiol. 2010;13:344–9.
67. Edwards JS, Ibarra RU, Palsson BO. In silico predictions of Escherichia coli metabolic capabilities are consistent with experimental data. Nat Biotechnol. 2001;19:125–30.
68. Orth JD, Fleming RM, Palsson BØ (2010a) 10.2.1–Reconstruction and use of microbial metabolic networks: the coreEscherichia colimetabolic model as an educational guide. In EcoSal–Escherichia coliandSalmonellaCellular and Molecular Biology, Karp PD (ed), 10.2.1. Washington DC: ASM Press. 69. Wielgoss S, Barrick JE, Tenaillon O, Cruveiller S, Chane-Woon-Ming B,
Medigue C, et al. Mutation rate inferred from synonymous substitutions in a long-term evolution experiment with escherichia coli. G3. 2011;1: 183–6.
70. Loferer-Krößbacher M, Klima J, Psenner R. Determination of bacterial cell dry mass by transmission electron microscopy and densitmetric image analysis. Appl Environ Microbiol. 1998;64:688–94.
71. Becker SA, Feist AM, Mo ML, Hannum G, Palsson BØ, Herrgard MJ. Quantitative prediction of cellular metabolism with constraint-based models: the COBRA Toolbox. Nat Protoc. 2007;2:727–38.
72. MATLAB scripts used to run evoFBA and analyze data. http://osslab.lifesci. warwick.ac.uk/?pid=resources.
73. Jeong H, Barbe V, Lee CH, Vallenet D, Yu DS, Choi SH, et al. Genome sequences ofEscherichia coliB strains REL606 and BL21(DE3). J Mol Biol. 2009;394:644–52.
74. Zaslaver A, Bren A, Ronen M, Itzkovitz S, Kikoin I, Shavit S, et al. A comprehensive library of fluorescent transcriptional reporters forEscherichia coli. Nat Methods. 2006;3:623–8.
• We accept pre-submission inquiries
• Our selector tool helps you to find the most relevant journal • We provide round the clock customer support
• Convenient online submission
• Thorough peer review
• Inclusion in PubMed and all major indexing services • Maximum visibility for your research
Submit your manuscript at www.biomedcentral.com/submit