Original citation:
Loveridge, Melanie, Lain, Michael J., Huang, Qianye, Wan, Chaoying, Roberts, Alexander J. ,
Pappas, George S. and Bhagat, Rohit. (2016) Enhancing cycling durability of Li-ion batteries
with hierarchical structured silicon–graphene hybrid anodes. Physical Chemistry Chemical
Physics, 18. p. 30677.
Permanent WRAP URL:
http://wrap.warwick.ac.uk/83267
Copyright and reuse:
The Warwick Research Archive Portal (WRAP) makes this work of researchers of the
University of Warwick available open access under the following conditions. Copyright ©
and all moral rights to the version of the paper presented here belong to the individual
author(s) and/or other copyright owners. To the extent reasonable and practicable the
material made available in WRAP has been checked for eligibility before being made
available.
Copies of full items can be used for personal research or study, educational, or not-for-profit
purposes without prior permission or charge. Provided that the authors, title and full
bibliographic details are credited, a hyperlink and/or URL is given for the original metadata
page and the content is not changed in any way.
Publisher statement:
First published by Royal Society of Chemistry 2016
http://dx.doi.org/10.1039/C6CP06788C
A note on versions:
The version presented here may differ from the published version or, version of record, if
you wish to cite this item you are advised to consult the publisher’s version. Please see the
‘permanent WRAP URL’ above for details on accessing the published version and note that
access may require a subscription.
Journal Name
ARTICLE
a.Energy Innovation Centre WMG, Warwick University, CV5 7AL
Received 00th January 20xx, Accepted 00th January 20xx
DOI: 10.1039/x0xx00000x
www.rsc.org/
Enhancing Cycling Durability of Li-ion Batteries with Hierarchical
Structured Silicon-Graphene Hybrid Anodes
Melanie J. Loveridge a, Michael J. Lain, Qianye Huang, Chaoying Wan, Alexander J. Roberts,
George S. Pappas and Rohit Bhagat.
Hybrid anode materials consisting of micro-sized silicon (Si) interconnected with few-layer graphene (FLG) nanoplatelets and sodium-modified poly (acrylic acid) (PAA) as a binder were evaluated for Li-ion batteries. The hybrid film has demonstrated a reversible discharge capacity of ~1800 mAh/g with a capacity retention of 97% after 200 cycles. The superior electrochemical properties of the hybrid anodes are attributed to a durable, hierarchical conductive network formed between Si particles and the multi-scale carbon additives, with enhanced cohesion by the functionalized polymer binder. Furthermore, improved SEI stability is achieved from the electrolyte additives, due to the formation of a kinetically stable film on the surface of the Si.
Introduction
The continued global drive for a clean energy future is a compelling
driving force motivating research groups across the world. This is
especially true in the electrification of transport, if this is to be a
viable strategy for reducing oil dependency and the associated
environmental impacts of road transportation. In parallel, to enable
the increased generation of renewable electricity by way of the
grid, static storage solutions will be of equal, high impact. For the
successful electrification of vehicles and effective, long-term grid
storage opportunities batteries are required to last much longer
and deliver energy at a higher rate than is currently possible.
Critical here are the Li-ion chemistries that need to be made from
electrode materials of reasonable cost, safety (non-toxic, excellent
structural/chemical stability with low heat generation), long cycle
life and abundance – the key factors to address the Li-ion energy
storage “quadrilemma” as depicted in Figure 1.
From an energy density perspective silicon (Si) has been the focus
of much research due to its considerable capacity of 3579 mAh/g,
second only to lithium metal 1. However, its obvious drawbacks
have highly limited its performance and applications, such as the
significant volume expansion upon lithiation, low conductivity and
consumption of Li ions by the way of continued SEI growth 2,3.
The volume expansion is around 280 % at maximum capacity (3579
mA h/g), and around 100 % at more practical capacities (1200 mA
h/g). This imposes serious mechanical challenges to the electrode
before any further electrochemical processes associated with SEI
growth and cracking. . In comparison, graphite anodes have
dominated the electrode chemistry since the launch of LIBs due to
its high electrical conductivity and low cost, but their limited
capacity of 372 mAh/g simply hinders further development for
Figure 1 The Li-Ion Energy storage “quadrilemma”
.
Attempts to improve the electrochemical performance of Si
materials have been based mainly on using nanostructured Si
materials, nanoporous Si frameworks as well as core-shell / hollow
Si structures 4. Nanostructured Si materials (<150 nm) may release
strain more effectively and thus experiences less structural damage
and pulverisation upon lithiation as compared to bulk Si 5. However,
the drawbacks of incorporating nano-sized Si as the anode active
material are obvious: (i) a higher surface area (≥100 m2/g) resulting
in a larger initial SEI film growth, (ii) electrochemical sintering
processes are not avoidable, emanating from localised spikes in
current / voltage which leads to performance deterioration.
In addition to active particles, the choice of polymeric binders is
considered to be critical to the performance of Si anodes. Effective
binders are those that can meet the following criteria: (a) adhesion
between the electrode and the current collector (b) interface
integrity between polymer and active material surface (c)
interaction of the polymer with electrolyte solvents and (d) the
tensile mechanical properties The frequently used polymers such
as PAA), as shown in Figure 2 6, sodium carboxymethyl cellulose
(Na-CMC) 7 and polyimide (PI) 8, have shown effective binding
functions due to their abundant functional groups. In Figure 2 the
interaction of the polymer carboxyl groups with the native
oxide-containing groups is illustrated
[image:3.595.308.516.137.342.2]
Figure 2 An illustration of sodium-modified poly (acrylic acid) and its
interaction with Si particle 9.
Apart from polymer binders, often two or more types of conductive
carbon are used to provide multi-scale conducting network, such as
small particles like acetylene black combined with larger particles
with higher aspect ratio e.g. vapour-grown carbon fibre (longer
range). This is carried out to highly promote the conducting
network formation and enhance the rate performance of the
anodes. Graphene has attracted considerable research effort on its
combination with Si in anodes 10,11. The desirable properties
associated with graphene, namely superior in-plane electrical
make it an interesting conductive additive for a more durable anode
architecture.
The theoretical capacity has been cited as 740-780 mAh/g, which is
approximately twice that of graphite, and in addition it is postulated
that the diffusion pathway of the lithium ions will be less tortuous
12.
In this study, we will exploit the conductive and mechanical
properties of FLG graphene to engineer electrodes with more
uniform conductive pathways and to protect against degradation.
It has been found that the electronic structure of few-layer
graphene (<10 layers) is different from that of bulk graphite, in light
of this it is useful to precisely define the different types of graphene
possible, i.e. single layer graphene, bilayer graphene and few-layer
graphene (FLG) 13.
Differential capacity analysis (dQ/dV) is used in this study and is the
first derivative of the galvanostatic curve and shows a series of
peaks that correspond to plateaus as seen in the respective voltage
profiles. Analysis using dQ / dV has been used on a number of
lithium ion battery chemistries 14–16. For dQ/dV vs. voltage plots, the
peaks correspond to specific processes relating to phase equilibria
and are voltage-specific.
Experimental
Silicon electrodes were prepared following the procedures as
described below.
Stock PAA solution
Polyacrylic acid (PAA; Sigma Aldrich, MWT = 450k, purity ≥ 99.5%)
aqueous solution (12wt %) was prepared using a Primix Homodisper
(Model 2.5) at room temperature. Then 0.12 mol of sodium
carbonate (Na2CO3; Fisher Chemical, purity > 99.5 %) was added to
form partially neutralise Na-PAA solution.
Carbon composite solution:
Carbon composite formulation: 10g few-layer graphene (FLG, XG
Sciences) is dry-blended with 5 g acetylene black (Alfa Aesar) on a
roller blender for 30 minutes. 135.9g deionised water containing
0.1g polyacrylic acid (Acros Organics) is added to the carbon blend
and the resulting suspension is high-shear stirred for 1 hour at
500rpm. The resulting slurry is then dispersed further ultrasonically
using a Hielscher 400 UPS (400W, 24Hz) sonotrode in static mode
with an amplitude of 60% at 0.5 cycles for 15 minutes. This
generates an effectively dispersed mixture of hierarchical carbons
as shown in Figure 2.
Si Composite Electrode Formulation
20 g of Si (Elkem Silgrain e-Si, d50 3.1 µm, purity 99.7%) is mixed
with 43.6 g of the C-mix (107.1g wt% solids mass) in a nalgene
vessel – Si particle morphology can be seen in Figure 3. The Si
composite slurry is then subjected to Ultrasonication to break down
any Si / C agglomerates. After sonication the slurry is further mixed
using medium sheer stirring in a Primix Homodisper Model 2.5 for
30 minutes at 1000 rpm. 33.33 g of the partially neutralized Na-PAA
solution (conc.12% w/v) is added to all of the Si slurry described
above. The composite slurry is further dispersed using a Primix
Homodisper Model 2.5 for 30 minutes. 30 mL of the resulting
solution is transferred to a Filmix mixing vessel and subjected to the
following mix cycle in a FilmixTM Thin-film Disperser Model 40-60:
two dispersions for 30 s each at 10 m/s then 30 s at 25 m/s. The
rest of the slurry receives the same mixing procedure (the solution
volume of the Filmix mixing vessel. The above formulations result in
electrodes with dry mass % composition of 56: 20: 14: 10 (Si: FLG:
PAA: Acetylene black). A control anode (containing no graphene) is
formulated based on a dry mass active content of 76% and
processed in the same way as described above for the Si-FLG
composite with a comparable coating mass.
The slurries are vacuum degassed under static vacuum for 1 hour.
Anode coatings are cast onto 10 µm thick Cu foil (Oak Mitsui,
electrodeposited) using an RK printing applicator (RK Instruments
Ltd) with a partial vacuum applied to the Cu foil and a doctor blade
set at a blade gap of 100 µm. Coated electrodes are dried on a hot
plate at 80 oC followed by vacuum drying (7 mBar) for 12 hours at
70 oC. Hohsen 2032 coin cells were used for charge-discharge cycle
testing versus Li metal (MTI Corporation, purity = 99.9%). All cells
used a GF/A separator rather than a porous polyolefin separator.
The electrolyte used was EC: EMC (3: 7), with 15 wt% FEC and 3
wt% VC. The cycling voltage range was 0.005 to 1.0 V. The first
(formation) cycle used a relatively low current (± C / 25), followed
by higher currents on subsequent cycles (± C / 5). Differential plots
of dQ / dV were calculated directly from the data.
FLG Anode Formulation
To establish the contribution of the FLG to overall reversible
capacity, an electrode was formulated based on a composition of
76: 14: 10 dry mass proportions of FLG: Na-PAA and carbon black. 4
grams of FLG (XG Sciences) is mixed with 8.65 grams of C-mix slurry
(10.5 wt %) in a Nalgene vessel. The slurry mixture is initially
blended with a spatula for 5 minutes and then subjected to
ultra-sonication for 10 minutes to disperse any carbon agglomerates.
6.84 grams of partially neutralized Na-PAA solution (11.7 wt %) is
added to the resulting slurry, and then it is further dispersed with a
Primix Homodisperser Model 2.5 for 30 minutes. Afterwards, the
composite slurry is transferred to a Filmix mixing vessel and
subjected to the following mix cycle: dispersed for 30 s at 10 m/s
then 30 s at 25 m/s.
The slurry is cast onto 10 µm Cu foil using a drawdown coater (RK
Instruments Ltd) with a blade gap of 100 µm. Coated electrodes are
dried on a hot plate at 50oC followed by vacuum drying (7 mBar) for
12 hours at 70oC.
Electrochemical characterisation
Charge-discharge cycle testing was carried out with a constant
current-constant voltage charging (CC-CV) procedure. Cell testing
was performed with a Maccor Potentiostat, with the cells housed in
temperature-controlled conditions maintained at 25oC.
BET Surface area & pore size distribution measurement
Surface area and porosity analysis was performed on a
Micromeritics Gemini V surface area analyser Nitrogen sorption was
carried out at 77 K on samples previously outgassed at 150ºC for 24
hours in a Micromeritics Flowprep 060 unit. The samples were then
transferred to a Micromeritics V Surface Area and Pore Size
Analyzer for analysis.
X-ray Diffraction
Crystallographic characterisation was performed using a PANalytical
Empyrean XRD Diffractomer with Co anode, Kα0.1789nm operated
at 40kV and 40mA over a scan range of 10 – 60 o at 1o/min.
The micro-Raman spectra were recorded on a Renishaw InVia
Raman spectrometer integrated with a Leica optical microscope. A
laser line of 532 nm was selected as excitation source and operated
below 1 mW in order to avoid any local heating. The excitation was
performed through a 50X objective (0.75 NA) giving a laser spot size
of 0.86 μm and a 1800 grooves/mm grating resulted to a spectral
resolution of ~ 2 cm-1.
Transmission Electron Microscopy
Transmission Electron Microscopy (TEM) micrographs were
obtained with a JEOL 2000FX instrument operated at 200 kV. The
samples were dispersed in tetrahydrofuran (THF) under
ultra-sonication and a droplet was placed on a carbon-coated copper
TEM grid.
Results and Discussion
Material and Electrochemical Characterisation
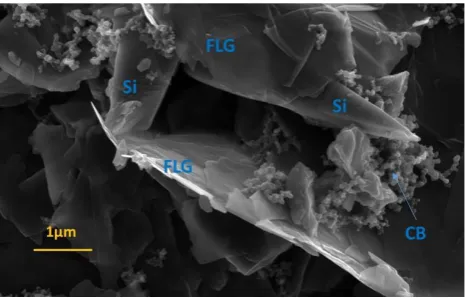
The Si-FLG composite anode materials are characterised by FE-SEM.
As shown in Figure 3, the Si microparticles, FLG and carbon
additives are distributed well within the electrode material and
together formulate quite a porous architecture. These carbon
networks represent effective anode “wiring” and ensures
maintenance of good electrical connection networks between
active particles down to the Cu current collector. It can be observed
from the SEM image that the sub-components of the anode’s
microstructure are multi-scale and hierarchical and this will benefit
short and long-range electrical conductivity. The anode’s porosity
will allow effective permeation of electrolyte solvents to allow for a
[image:6.595.304.537.65.214.2]more uniform distribution of Li.
Figure 3 FE-SEM Si-FLG composite (CB = carbon black)
intercalated molecules, which are typically O-bonded functional
groups and H2O molecules17.
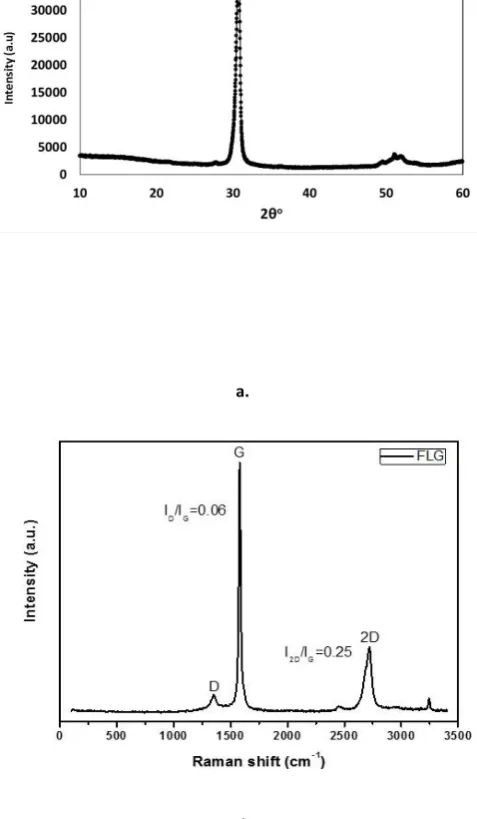
Figure 4a outlines the crystallographic characterisation of the FLG
by XRD. This gives information on the various structural properties
of FLG, namely the interplanar distances of the lattices and the
platelet thickness and the number of layers. The sharp peak at 30.7o
indicates the 002 plane with the interlayer distance calculated as
3.38Å.
At higher 2θ reflections there are broader, less intense regions at
49.5o, 51.0o and 51.9o, corresponding to d-lattice spacing of 2.14,
2.08 and 2.05Å, respectively. In graphite this value is typically
quoted as 3.35 – 3.36Å but the graphene layers differ in diffraction
characteristics due to the structural defects, such as nano-holes and
intercalated molecules, which are typically O-bonded functional
groups and H2O molecules 17. Figure 4b shows the Raman spectra of
the FLG with all the characteristic peaks of graphene. The D band at
1350 cm-1 is activated from the defects on graphene honeycomb
structure and to the edges of the graphene layers. The intense peak
at 1580 cm-1 (G band) is attributed to the bond stretching of the
in-plane sp2carbon atoms while the overtone of the D band which is
activated from a two-phonon scattering process is centred at 2720
and the large FWHM (71 cm-1) together with the high I
G/I2D ratio
indicate that the material is a multilayer graphene consisting of at
least 5 graphene sheets 19. Figure 5 outlines the electrochemical
testing of the electrodes in half cells (vs. Li). Fig 5a compares the
first cycle charge-discharge voltage profiles for electrodes cycled to
different capacity limits of 1200, 1800 and 3600mAh/g. The first
(formation) cycle used a higher capacity limit than that adopted for
subsequent charge-discharge cycling. This attempts to ensure
sufficient amorphisation of the active material, such that further
crystalline-to-amorphous transformation is avoided as much as
possible within the fixed capacity cycling. The irreversible capacity
loss on the first cycle (FCL %) for each cell is 19.1%, 18.4% and 27%
respectively with the largest loss incurred at the full discharge
capacity. Figure 5b and c compare the capacities and coulombic
efficiencies during successive cycling of Si-FLG anodes at half and
full specific capacity (1800 and 3579 mAh/g) against a Si anode
containing no FLG. Whilst there is an initial decline in delithiation
capacity from full lithiation to ca. 2000 mAh/g reversible capacity,
there is a reasonably stable region of charge-discharge cycling to
around 150 cycles. This can be attributed to effective interactions
between the Si and FLG to give a structurally more stable electrode
than is typically seen with only Si as the active material. This is
demonstrated in profiles (iii) in 5b and c whereby a Si-only anode
cannot endure more than 80 cycles at 2000mAh/g before the
capacity fade becomes very pronounced with increasing cycle
numbers. One possible explanation is that the more weakly
connected particles now start to become fully isolated through an
incremental breakdown of conductive networks and continued
capacity fade.
This performance observation is supported by the coulombic
efficiency data that clearly show a more profound efficiency decline
in 5c (ii) and to a slightly lesser extent in 5c (i). Interestingly the
efficiency begins to slightly increase in 5c (i) after ca. 150 cycles and
according to Dahn20 this may be attributable to the maturing of the
SEI in this region of cycling with an associated slowing down of the
parasitic reactions associated with electrolyte decomposition. The
particles that remain in electrical contact with slowed SEI growth
rate could be cycling more efficiently at this point.
a.
[image:7.595.303.542.283.693.2]b.
Figure 4 a. X-Ray Diffractogram and b. Raman Spectrum of XG
a.
b.
[image:8.595.44.244.81.472.2]c.
Figure 5 a. Voltage vs. Capacity for Si-FLG Anodes at Capacities (i)
1200mAh/g (ii) 1800mAh/g (iii) 3579mAh/g 5 b. Comparison of
performance in coin cells vs. Li/Li+ showing delithiation capacity as a
function of cycle number for (i) FLG anode (3579mAh/g), (ii)
Si-FLG anode (1800mAh/g); (iii) Si only anode (2000mAh/g) (iii) . c.
Coulombic efficiency vs. cycle number for (i) Si-FLG anode cycled at
3579mAh/g, (ii) Si-FLG anode cycled at 1800mAh/g and (iii) Si only
anode cycled at 2000mAh/g.
An examination of the selected area electron diffraction (SAED)
pattern provides further information of the layered structure. The
inner diffraction ring of the (002) plane consists of a set of 12 (6
pairs) of intense diffraction peaks, and the rotation between the
graphene layers is calculated to be 12°.
Firstly there is the interaction with the active material (as depicted
in Figure 1), and it is reported that there are three different modes
of binding that occur between expansive materials (such as Si) and
polymers21: (i) particles are stuck together with a “flexible paste”;
(ii) a flexible binder matrix is formed of covalent bonding between
in which the active material is also covalently bound (via ester bond
formation between the PAA-COOH and the Si-silanol groups; (iii) a
similar embedded interaction exists but instead of covalent bonding
there is a hydrogen-bonding network. This is stated to be
advantageous as the bonds are non-permanent and thus able to
break and reform as the Si particles move during expansion. The
last mode of binding can only exist in polymers that contain
hydroxyl groups. The partial neutralisation of the polymer using a
sodium counter-ion induces chain extension by reducing inter- and
(screening of electrostatic interactions). The flexibility of solvent
selection with PAA also offers additional routes to electrode
optimisation by allowing variable concentrations of polymer
solution with a range of viscosities. Therefore, the polymer binder
plays a key role in the retention of the electrode’s microstructure
stability for longer-term cycling. The electrochemical lithiation /
delithiation behaviour of FLG resembles that of bulk graphite
(whereas single layer graphene behaves dramatically differently) 22
and plays a key role in the retention of the microstructure stability
[image:9.595.304.548.62.440.2]for longer-term cycling.
Table 1 outlines the lithiation and delithiation processes that occur
within graphitic carbon as a function of voltage and will be
considered the same phases that occur in FLG materials.
Voltage Lithiation / Delithiation Process
<0.9 a. Continued decomposition of electrolyte and formation of SEI b. LiC72 → LiC36
0.2 – 0.1 Formation of LiC27 and LiC18
≈0.1 LiC18 → LiC12
0.1 – 0.25 LiC12 → LiC18
0.25 – 0.5 LiC18 →LiC36
0.5 – 1.0 LiC36 → LiC72
Table 1. Key lithiation stages within graphitic carbon
a.
[image:9.595.57.278.417.584.2]b.
Figure 6 a. Voltage vs. Capacity (mAh/g) 1st Cycle
lithiation-delithiation of a FLG anode vs. Li. b. Voltage vs. Capacity (mAh/g) 1st
and 10th Cycle lithiation-delithiation FLG anode vs. Li.
There are multiple slopes and plateaus in graphitic carbons, each
representing a lithiation or delithiation process summarised by the
reaction schemes in Table 1 23. The specific surface area of the FLG
is measured as 123 m2/g and constitutes a large substrate to
accommodate electrolyte decomposition and surface reaction of Li
species. The voltage profile of the FLG, unlike that of artificial and
display the classic plateaued profile of layered carbon. Interestingly
the type of slope is similar to that seen in hard carbon materials and
is ascribed to the disordered crystal structure. Hard carbon
materials can contain significant quantities of nano-scale porosity,
which can be modelled by a series of graphene sheets arranged like
a so-called “house of cards” where a proportion of the particles
comprise of two or three stacked layers and constitute lithium
insertion sites24. In the case of FLG carbon these stacked layers
represent the majority of the material and will vary in layer number,
size and chemical environment resulting in the capacity developing
over a range of potentials to generate a “sloping” voltage profile.
When comparing cycles 1 and 10 in Figure 6b it is evident that there
is a significant difference in capacity loss 60% on the first cycle but
this reduces to 15.9% on cycle 10. The formation of SEI, especially
on high surface area materials such as FLG, is a major contributor to
early capacity loss but is not the entire story. The electrolyte
additives used in this study were selected to promote a more stable
SEI on the Si and reduce its dynamic breakdown and reformation.
The effectiveness comes from the formation of fluoride ions from
electrolyte breakdown, which leads to the chemical attack of any
Si-oxide surface passivation layers subsequently forming a kinetically
stable SEI that is based predominantly on lithium fluoride and
lithium oxide. See Equation 1. Previous work has also indicated that
polycarbonates such as polymeric fluorocarbonate and vinylene
carbonate (VC) are formed during the reduction of FEC and also
serve to stabilise the SEI.
Xu et al 25 extend the claims to FEC acting to prevent particle
agglomeration, cracking and influencing the salt dissolution
reaction. However, it is unlikely that any layer of inorganic, organic
or combined species formed can contain the expansive forces that
lead to individual Si particle cracking. The effectiveness of FEC in
improving the coulombic efficiency and capacity retention has been
investigated by Schroder et al 26. There is a clear shift in the shape
of the voltage profile during the lithiation phase of cycle 10. The
voltage descends far more steeply and the plot has a more
distinctive plateau at voltages below 0.1V. Figure 7a shows the DFT
pore size distribution and specific surface area (as calculated by BET
method) for the FLG nano-platelets. Figure 7b shows an FIB
prepared cross-section of an electrode coated using FLG and PAA
(refer to Section 2.4 for formulation details). The multiple layers are
easily identifiable and the coating structure is very porous and will
allow good permeation of electrolyte solvents. The largest
Equation 1. Electroreduction of fluoroethylene carbonate to lithium
fluoride. 2: electroreduction of fluoroethylene carbonate to form
lithium fluoride methylenedioxyl ion or carbon dioxide and lithium
ethoxide 26.
incremental pore volume is attributable to 34-37 nm pore widths
and represents >50% of the cumulative pore volume, with ca. 80%
of the total pore volume being found in pores greater than 30 nm.
Further smaller distributions are observed centred at 15, 9 and 1.5
nm, accounting for the remaining pore volume. This pore structure
spans both the micro and mesoporous scale, with the higher
a.
[image:11.595.304.552.482.673.2]
b.
Figure 7a. Density Functional Theory (DFT) pore size distribution
and surface area measurement for FLG nanoplatelets b. FIB section
of a FLG nanoplatelets-based anode coating.
wetting and diffusion of electrolyte species throughout the material
and maximum utilisation in cycling. The polydispersed nature of the
Si particles used in this study are observed in Figure 8, with a D50 of
2.92µm but the particle size range extends to around 20µm for a
smaller volume % of the material. This is quite a common
phenomenon with metallurgical powders that have any grinding or
milling stages within their manufacture.
This this broad particle size distribution can impact the local
chemical and electrical behaviour of a porous anode. Firstly it has
been demonstrated using simulations based on
computer-generated electrode microstructures that broad particle size
distributions can deliver up to twice the energy density of
monodispersed particles27.
However, electrodes based on monodisperse particle size
distributions deliver the highest combined energy and power
density due to a higher surface area of active material per unit
Figure 8 Particle Size Distribution of micro-sized Si particles.
Differential Capacity Characterisation
(i) Si-FLG Composite dQ/dV Evaluation.
Figure 9a. shows the differential capacity (dQ/dV) plots for cycle 2 –
10 in the potential range 0 – 1V to a capacity of 3579 mAh/g,
showing information about structural transformations during
lithiation and delithiation for Si-FLG anodes vs. Li/Li+ in a half-cell.
The profiles show characteristic Si lithiation processes with the 1st
lithiation being distinctly different to subsequent lithiation
processes due to the dominant conversion processes that transform
crystalline (c-Si) to amorphous silicon (a-Si).
During the discharge process three peaks are observed at:
(i) The 1st discharge process between 0.25-0.3V appears as quite a
broad doublet peak that possibly indicates a two-stage gradual
lithiation of the a-Si lattice to form a-Li2.0Si (see process 1 in Figure
7a.) According to Grey et al this phase is still composed of extended
Si networks and large Si-Si clusters 28. It has also been reported
elsewhere that doublet or split peaks within discharge dQ/dV peaks
can be attributed to non-uniform lithiation events or intermediate
phases26.
(ii) The second discharge process occurring at 0.09-0.1V
corresponds to the formation of Li3.5Si and is recognized as the
further breaking of Si-Si bonds to form small Si clusters and
eventually isolated Si atoms 28. On cycle 2 only there is a small peak
around 50mV which has been reported to correspond with the
formation of c-Li3.75Si from a-LixSi 28–30.
(iii) During the delithiation processes two single peaks are observed
at 0.45V – this corresponds to the transformation of the lithium-rich
c-Li3.75Si phase and partially delithiated / more defective c-Li3.75Si
crystalline phase, to amorphous lithium silicide a-Li2.0Si26.
(iv) The delithiation at 0.27 V corresponds to the delithiation of
a-Li~2.0Si / a-Li~1.1Si.
Figure 9b compares the differential capacity plots for
lithiation-delithiation cycles 2-10 and 91-100. Whilst the dQ / dV peak at 0.25
V occurring during lithiation consistently splits into a double peak in
the first 10 cycles, it is no longer evident approaching cycle 100.
a.
[image:12.595.304.552.262.694.2]
b.
numbers a. dQ/dV Plot Si-FLG cycle number 2 – 10, b. (i) 2-10 and
(ii) 91-100.
Over increasing cycle numbers up to 100 there is an obvious gradual
reduction in the peak intensity during delithiation as a function of
cycle number. Additionally, there is a shift in the profiles’ peak
voltage towards lower values during lithiation, suggesting
increasing resistance with higher cycle number as the cell is
challenged to reach capacity.
This reflected in the dQ/dV plot by way of a much reduced peak
height resulting from the lower available capacity as a function of
cycle number.
The wider peak-peak separation reflects an increase in electrode
resistance and this will continue to build up as a result of continual
SEI growth on the Si, a proportion of electrically isolated active
particles from breakdown in the connective C-network, but also
from areas where an onset of delamination occurs of the electrode
coating from the separator. After 100 cycles the area beneath the
lithiation peaks continues to decrease until these peaks essentially
flatten at 170 cycles where the capacity retention has reduced
considerably.
Few Layer Graphene Electrochemical Evaluation
Figure 10a compares the differential capacity curves of FLG anode
vs. Li during the 1st, 2nd, 4th and 10th charge-discharge cycle in
profiles i - iv. In cycle 1 and 10 lithiation peaks occur at 0.19, 0.17
and 0.12V with subsequent delithiation events taking place within 2
broad sets of voltage range (0.1-0.3V and 0.5-0.7V). There are peak
shifts during cycles 1- 10 when delithiation processes occur with
broad peaks developing during the 4th and 10th cycle.
Lithiation peaks display more of a consistent overlap than the
corresponding delithiation peaks, which display more divergence
and increasing voltage separation between delithiation events as a
function of cycle number. This suggests a shifting energy
requirement to remove Li from the graphene structures as a
function of increasing cycle number. Figure 10b shows the
delithiation capacity (mAh/g) as a function of cycle number for an
anode with FLG as the total anode active material vs Li in a half-cell
cycling test.
The anode is capable of reversible lithiation to capacities of
>500mAh/g for ≥ 100 cycles in a non-optimised anode formulation,
with a discharge capacity retention of 92.5% at cycle 100 Therefore,
in addition to enhancing the conductivity of the composite film and
introducing any improvements to the tensile properties of the
b.
Figure 10 a. Differential Capacity Analysis of discharge capacities of
FLG anode vs. Li (i) Cycle 1 (ii) Cycle 2 (iii) Cycle 4 and (iv) Cycle 10.
b. Delithiation Capacity and Coulombic Efficiency (%) vs. Cycle No.
of FLG anode vs. Li.
reversible capacity to a higher level than is possible with bulk
graphite (372mAh/g). It has been reported that in Si-only anode
films the continual large volume changes that accompany the
charge-discharge process leads to the agglomeration of the Si 31.
This in turn causes destructive microstructural changes that result
in the gradual breakdown of the conductive network down to the
current collector with concomitant capacity fade. It is therefore a
possibility that the presence of a significant amount of FLG can
influence this phenomenon beneficially.
Conclusions
This investigation shows the enriched electrochemical performance
of silicon anodes that incorporate few layer graphene in addition to
conventional carbon additives. Reasonable reversible lithiation
behaviour is achievable at 1800 and 2000 mAh g-1 (with the hybrid
system out-performing an anode based only on a Si active mass but
there is a requirement to continue to improve the coulombic
efficiency of these anode systems, especially as larger format cells
are developed with long-term cycling requirements. Further
improvements can also be made by optimising the ratio of the Si
and FLG. The high capacity durability over hundreds of cycles of
these anode systems derives from improving multiple cell
components in unison. FLG contributes to the reversible capacity,
showing reasonable electrochemical behaviour as a single active
material, demonstrating reversible capacities of almost 600 mAh/g.
The inclusion of FLG is also likely to be enhancing the tensile
strength of the electrode but to confirm this requires further
measurement and characterisation. Poly (acrylic acid) incorporating
a Na-counter ion to extend its chain configuration, is an effective
enduring volume expansion and particle movement for ca. 200
charge-discharge cycles. There is scope to further investigate what
constitutes the optimal Si-FLG ratio for this type and particle size of
Si and improve the electrode stability and performance even more.
Using dQ / dV analysis some interesting features, particularly at
higher capacities, are seen. During lithiation, there are two main
stages; break-up of the amorphous silicon structure to form large
clusters, and then further break up to small clusters and isolated
silicon atoms. The proportion of the total lithiation charge on the
small clusters / isolation stage usually decreases during initial
cycles, but can then increase again. With further optimisation of the
electrode formulation and further testing in full cells there is
development opportunity for an inexpensive route for making a
durable anode capable of being reversibly cycled to capacities much
higher than that of current graphite technologies.
Acknowledgements
This work was supported by the High Value Manufacturing Catapult
(RESWM8053) at the University of Warwick’s Energy Innovation
Centre.
References
1 D. Ma, Z. Cao and A. Hu, Nano-Micro Lett., 2014, 6, 347–
358.
2 L.-F. Cui, L. Hu, H. Wu, J. W. Choi and Y. Cui, J. Electrochem.
Soc., 2011, 158, A592.
3 M. N. Obrovac and L. J. Krause, J. Electrochem. Soc., 2007,
154, A103.
4 J.-G. Ren, Q.-H. Wu, G. Hong, W.-J. Zhang, H. Wu, K. Amine,
J. Yang and S.-T. Lee , Energy Technol., 2013, 1, 77–84.
5 X. H. Liu, L. Zhong, S. Huang, S. X. Mao, T. Zhu and J. Y.
Huang, ACS Nano, 2012, 6, 1522–1531.
6 A. Magasinski, B. Zdyrko, I. Kovalenko, B. Hertzberg, R.
Burtovyy, C. F. Huebner, T. F. Fuller, I. Luzinov and G.
Yushin, ACS Appl. Mater. Interfaces, 2010, 2, 3004–10.
7 S.-L. Chou, Y. Pan, J.-Z. Wang, H.-K. Liu and S.-X. Dou, Phys.
Chem. Chem. Phys., 2014, 16, 20347–59.
8 J. S. Kim, W. Choi, K. Y. Cho, D. Byun, J. Lim and J. K. Lee, J.
Power Sources, 2013, 244, 521–526.
9 J. Song, M. Zhou, R. Yi, T. Xu, M. L. Gordin, D. Tang, Z. Yu,
M. Regula and D. Wang, Adv. Funct. Mater., 2014, 24,
5904–5910.
10 D. Chen, R. Yi, S. Chen, T. Xu, M. L. Gordin and D. Wang,
Solid State Ionics, 2014, 254, 65–71.
11 L. Luo, J. Wu, J. Luo, J. Huang and V. P. Dravid, Sci. Rep.,
2014, 4, 3863.
12 L. L. Tian, Q. C. Zhuang, J. Li, Y. L. Shi, J. P. Chen, F. Lu and S.
G. Sun, Chinese Sci. Bull., 2011, 56, 3204–3212.
13 B. Partoens and F. M. Peeters, Phys. Rev. B - Condens.
Matter Mater. Phys., 2006, 74, 1–11.
14 I. Bloom, A. N. Jansen, D. P. Abraham, J. Knuth, S. a. Jones,
V. S. Battaglia and G. L. Henriksen, J. Power Sources, 2005,
139, 295–303.
15 I. Bloom, J. Christophersen and K. Gering, J. Power Sources,
2005, 139, 304–313.
16 I. Bloom, J. P. Christophersen, D. P. Abraham and K. L.
Gering, J. Power Sources, 2006, 157, 537–542.
17 S. C. Jun, Fundamental of Graphene, Wiley-VCH verlag
GmbH & Co. KgaA, 2015.
18 A. C. Ferrari, J. C. Meyer, V. Scardaci, C. Casiraghi, M.
Roth and A. K. Geim, Phys. Rev. Lett., 2006, 97.
19 Y. Hao, Y. Wang, L. Wang, Z. Ni, Z. Wang, R. Wang, C. K.
Koo, Z. Shen and J. T. L. Thong, 2010, 195–200.
20 B. Gyenes, D. a. Stevens, V. L. Chevrier and J. R. Dahn, J.
Electrochem. Soc., 2014, 162, A278–A283.
21 U. S. Vogl, P. K. Das, A. Z. Weber, M. Winter, R. M. Kostecki
and S. F. Lux, Langmuir, 2014, 30, 10299–10307.
22 E. Pollak, B. Geng, K. J. Jeon, I. T. Lucas, T. J. Richardson, F.
Wang and R. Kostecki, Nano Lett., 2010, 10, 3386–3388.
23 J. Shim and K. A. Striebel, J. Power Sources, 2004, 130, 247–
253.
24 D. A. Stevens and J. R. Dahn, J. Electrochem. Soc, 2001, 148,
A803–A811.
25 C. Xu, F. Lindgren, B. Philippe, M. Gorgoi, F. Björefors, K.
Edström and T. Gustafsson, Chem. Mater., 2015, 27, 2591–
2599.
26 K. Schroder, J. Alvarado, T. A. Yersak, J. Li, N. Dudney, L. J.
Webb, Y. S. Meng and K. J. Stevenson, 2015.
27 C. Erk, T. Brezesinski, H. Sommer, R. Schneider and J. Janek,
ACS Appl. Mater. Interfaces, 2013, 5, 7299–307.
28 K. Ogata, E. Salager, C. J. Kerr, a E. Fraser, C. Ducati, A. J.
Morris, S. Hofmann and C. P. Grey, Nat. Commun., 2014, 5,
3217.
29 M. N. Obrovac and L. Christensen, Electrochem. Solid-State
Lett., 2004, 7, A93.
30 M. T. McDowell, I. Ryu, S. W. Lee, C. Wang, W. D. Nix and Y.
Cui, Adv. Mater., 2012, 24, 6034–41.
31 L. Ji, H. Zheng, A. Ismach, Z. Tan, S. Xun, E. Lin, V. Battaglia,
V. Srinivasan and Y. Zhang, Nano Energy, 2011, 1–8.