University of Warwick institutional repository: http://go.warwick.ac.uk/wrap
A Thesis Submitted for the Degree of PhD at the University of Warwick
http://go.warwick.ac.uk/wrap/49625
This thesis is made available online and is protected by original copyright.
Please scroll down to view the document itself.
Transcriptional Regulatory Codes Underlying
Arabidopsis Stress Responses
by
Richard John Hickman
Thesis
Submitted to the University of Warwick for the degree of
Doctor of Philosophy
Department of Systems Biology
Contents
List of Tables v
List of Figures vi
Acknowledgments ix
Declarations x
Abstract xi
Abbreviations xii
Chapter 1 Introduction 1
1.1 Plant stress and food security . . . 1
1.2 Regulation of gene expression . . . 2
1.2.1 The multiple levels of gene regulation . . . 2
1.2.2 Regulation of transcription . . . 3
1.2.3 Transcriptional regulatory networks . . . 4
1.2.3.1 Methods for elucidating transcriptional networks . . . 5
1.3 Stress responses in Arabidopsis . . . 7
1.3.1 The role of plant hormones in the stress response . . . 7
1.3.1.1 Abscisic acid (ABA) . . . 8
1.3.1.2 Jasmonic acid (JA) . . . 9
1.3.1.3 Ethylene (ET) . . . 10
1.3.1.4 Salicylic acid (SA) . . . 10
1.3.1.5 Hormone crosstalk . . . 11
1.3.2 Transcriptional control of stress-associated gene expression. . . 12
1.3.2.1 The NAC transcription factor family . . . 13
1.4 Leaf senescence . . . 16
1.4.1 Senescence and the link to stress . . . 16
1.5 Infection by Botrytis cinerea . . . 18
1.5.1 The plant response to Botrytis infection . . . 18
1.5.2 Transcriptional responses to Botrytis infection . . . 19
1.6 The PRESTA project . . . 20
1.7 Organisation of this thesis . . . 22
Chapter 2 Materials and Methods 23 2.1 Plant material . . . 23
2.2 Plant and fungal growth . . . 23
2.2.1 Plant growth . . . 23
2.2.2 Botrytis growth . . . 23
2.2.3 Botrytis infected-leaf expression analysis . . . 24
2.2.4 Dark-induced senescence expression analysis . . . 24
2.3 Microarray analysis . . . 25
2.3.1 RNA extraction . . . 25
2.3.2 RNA amplification . . . 25
2.3.3 Microarray experimental design . . . 27
2.3.4 Direct labelling of amplified RNA . . . 27
2.3.5 CATMA array hybridisation . . . 27
2.3.6 Microarray scanning . . . 28
2.3.7 Expression analysis . . . 28
2.3.8 Gene Ontology (GO) analysis . . . 28
2.3.9 AtGenExpress Affymetrix microarray data . . . 28
2.4 Conservation analysis of promoters using EARS . . . 29
2.5 Yeast-1-Hybrid . . . 30
2.5.1 Yeast-1-Hybrid components . . . 30
2.5.2 Amplification of promoter fragments . . . 31
2.5.2.1 Restriction based primers . . . 31
2.5.2.2 Gateway cloning based primers . . . 31
2.5.3 Amplified product clean-up and purification . . . 31
2.5.4 Generation of bait vectors . . . 34
2.5.4.1 Cloning into pHISLEU2 . . . 34
2.5.4.2 Verifying promoter insert in pHISLEU2 vectors . . . 34
2.5.4.3 Cloning into pHISLEU2GW . . . 35
2.5.5 Generation of mutagenised promoter fragments . . . 35
2.5.6 Yeast growth media . . . 37
2.5.6.1 YPDA media . . . 37
2.5.7 Yeast transformations . . . 38
2.5.8 TF-library construction . . . 38
2.5.9 Screening a promoter fragment against AD-TD library . . . 38
2.5.9.1 Mating bait and prey strains to generate co-transformants 38 2.5.9.2 Selection and characterisation of positive interactions . . 39
2.5.9.3 Re-testing positive interactions by direct co-transformation 39 Chapter 3 Software and Method Development 41 3.1 Introduction . . . 41
3.2 Results . . . 43
3.2.1 Object-orientated design . . . 43
3.2.2 APPLES functionality . . . 44
3.2.2.1 Genome sequence retrieval . . . 46
3.2.2.2 Motif scanning . . . 46
3.2.2.3 Motif-sequence overrepresentation . . . 48
3.2.2.4 Motif-sequence set overrepresentation . . . 48
3.2.2.5 Motif finding . . . 49
3.2.2.6 Motif similarity and clustering . . . 49
3.2.3 APPLES workflow . . . 50
3.3 Discussion . . . 52
3.3.1 Functional decomposition . . . 55
3.3.2 Future development . . . 55
Chapter 4 Transcriptional Regulatory Codes in Stress Responses 57 4.1 Introduction . . . 57
4.2 Results . . . 60
4.2.1 Elucidating the regulatory role of HSF3 . . . 60
4.2.2 Identification of promoter motifs regulating leaf senescence . . . . 65
4.2.3 Identification of promoter motifs regulating the response to infec-tion byBotrytis cineria . . . 73
4.3 Discussion . . . 79
Chapter 5 High-throughput Yeast-1-Hybrid 84 5.1 Introduction . . . 84
5.1.1 ANAC092 as a candidate for testing the Y1H procedure . . . 85
5.2 Results . . . 86
5.2.1 Establishing a strategy for high-throughput Y1H screens using a TF library . . . 86
5.3 Discussion . . . 96
Chapter 6 Local Network Reconstruction 99 6.1 Introduction . . . 99
6.2 Results . . . 100
6.2.1 ANAC019,ANAC055 and ANAC072 are differentially expressed in response to many stresses. . . 100
6.2.2 Core promoter conservation ofANAC019,ANAC055 andANAC072103 6.2.3 Y1H assays identify TFs that interact withANAC019,ANAC055 and ANAC072 promoters . . . 104
6.2.3.1 In silico analysis can predict TF binding locations. . . . 109
6.2.3.2 Functional analysis of interacting TFs . . . 110
6.2.4 MYB TFs bind to the promoters of ANAC019, ANAC055 and ANAC072 . . . 118
6.2.5 Expression of ANAC019, ANAC055 and ANAC072 is perturbed inMYB2 andMYB108 Arabidopsis mutants . . . 123
6.2.6 Global assessment of gene expression changes inmyb2 andmyb108 mutants during response to Botrytis infection and dark-induced senescence . . . 127
6.2.6.1 Response to Botrytis infection . . . 127
6.2.6.2 Response to dark-induced senescence . . . 129
6.2.6.3 Regulatory overlap . . . 131
6.3 Discussion . . . 134
Chapter 7 General Discussion 140
Appendix A Computing similarity between two PSSMs 144
Appendix B Predicted direct targets of HSF3 146
Appendix C Known motif enrichment in clusters of genes derived from
senescence and Botrytis time-courses 148
Appendix D List of NAC TFs displaying enhanced expression during
senescence or Botrytis infection 156
Appendix E Y1H colony growth indicating interactions between AD-TF
and NAC gene promoters 158
List of Tables
2.1 Primers used to amplify promoter fragments for use in restriction based
cloning . . . 32
2.2 Primers used to amplify promoter fragments for use in Gateway cloning system . . . 33
2.3 Primers used for site directed mutagenesis of ANAC055 promoter frag-ment 4 . . . 37
3.1 List of major APPLES classes. . . 45
4.1 Frequency of pHSF3E in promoters of genes upregulated in HSF3Ox plants and in randomly selected promoter sets . . . 62
6.1 Positive interactions between TFs and promoters ofANAC019,ANAC055 and ANAC072 . . . 108
6.2 ABA related genes downregulated in Botrytis infected myb2 leaves. . . 130
6.3 Stress related genes downregulated inmyb2 following infection by Botrytis and during dark-induced senescence. . . 132
6.4 Stress related genes downregulated inmyb108 following infection by Botry-tis and during dark-induced senescence. . . 133
B.1 Predicted direct targets of HSF3 based on pHSF3E enrichment . . . 146
C.1 Known motifs enriched in senescence clusters . . . 148
C.2 Known motifs enriched in Botrytis clusters . . . 150
List of Figures
1.1 The multiple levels of gene regulation . . . 3
1.2 Modelling TF binding sites . . . 5
2.1 Quantification of dark-induced senescence in single leaves. . . 26
2.2 Plasmids used in Y1H experiments . . . 30
3.1 Biological entities incorporated into the APPLES object structure . . . . 44
3.2 Example APPLES object models . . . 46
3.3 Scoring sequences within APPLES . . . 51
3.4 APPLES workflow for promoter analysis . . . 53
3.5 Sample script that uses APPLES objects . . . 54
4.1 HSF3 regulates drought tolerance and productivity . . . 59
4.2 Similarity of putative HSF3 binding site to known HSF motifs . . . 61
4.3 Positional bias of the pHSF3E . . . 64
4.4 Experimental validation of HSF3 direct/indirect targets . . . 65
4.5 Gene Ontology (GO) categories overrepresented in the set of putative HSF3 direct targets . . . 66
4.6 Clustering analysis of genes differentially expressed during senescence . . 67
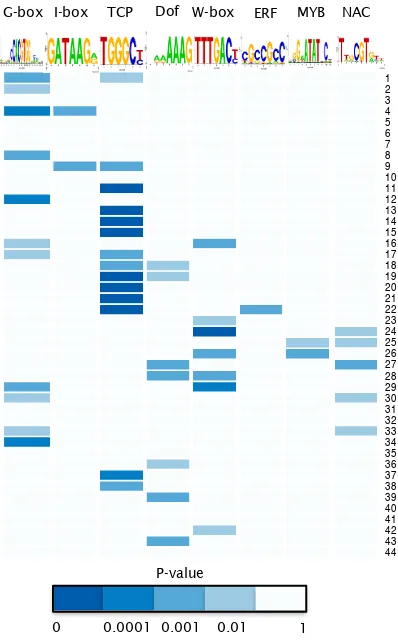
4.7 Overrepresentation of known TF binding sites is associated with distinct expression profiles during the senescence time-course . . . 69
4.8 Overrepresentation of known TF binding motifs in promoters of coex-pressed genes . . . 70
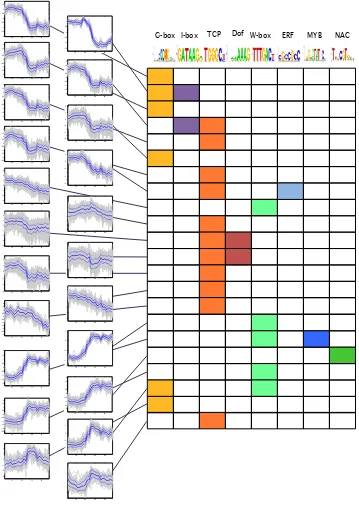
4.9 Hints at combinatorial motif patterns . . . 74
4.10 Clustering analysis of genes differentially expressed following infection by Botrytis . . . 75
4.11 Overrepresentation of known TF binding sites is associated with distinct expression profiles during the Botrytis time-course . . . 77
5.1 The Yeast-1-Hybrid (Y1H) system . . . 86 5.2 Expression time-course profiles ofANAC092 during stress treatments . . 87 5.3 High-throughput Y1H screening assay workflow . . . 89 5.4 Interactions between TFs and ANAC092 promoter fragments identified
in Y1H screen . . . 90 5.5 Co-transformation of bait and prey plasmids to re-test interactions and
identify novel ones . . . 93 5.6 Expression profiles of TFs that bind upstream ofANAC092 during
senes-cence and Botrytis time-courses . . . 94 5.7 Expression profiles of TFs that bind upstream of ANAC092 during
abi-otic, hormone and biotic stress treatments . . . 95
6.1 ANAC019, ANAC055 and ANAC072 expression is induced by multiple stresses . . . 102 6.2 NAC paralog core promoter sequence conservation . . . 104 6.3 Overview of Y1H screening strategy for identification of TFs that interact
withANAC019,ANAC055 and ANAC072 promoters . . . 106 6.4 Identification of TFs that interact with the promoters ofANAC019,ANAC055
and ANAC072 . . . 107 6.5 Identification of putative binding locations for TFs that interact with the
promoter ofANAC019 in Y1H assays . . . 112 6.6 Identification of putative binding locations for TFs that interact with the
promoter ofANAC055 in Y1H assays . . . 113 6.7 Identification of putative binding locations for TFs that interact with the
promoter ofANAC072 in Y1H assays . . . 114 6.8 Conserved regions contain combinatorial motif patterns . . . 115 6.9 Temporal expression patterns of interacting TFs in response to various
environmental stimuli . . . 116 6.10 Expression profiles of interacting TFs in senescence and Botrytis-infection
time-courses . . . 117 6.11 CBF TFs that interact with ANAC072 promoter . . . 119 6.12 MYB TFs interact with all promoters ofANAC019,ANAC055andANAC072121 6.13 Interacting MYB TFs belong to a phylogenetic clade based on similarity
in DNA binding domain . . . 122 6.14 Expression of MYB2 and MYB108 is positively correlated with that of
6.16 Expression profiling of ANAC019, ANAC055 and ANAC072 in MYB2 and MYB108 mutant backgrounds under different stress conditions . . . . 126 6.17 GO categories overrepresented in genes that are downregulated in the
myb2 knockout during Botrytis infection . . . 129 6.18 Integrated NAC centred transcriptional network . . . 138
A.1 Assessing similarity between two PSSMs. . . 145
Acknowledgments
I would like to begin by thanking my supervisors, Prof. Vicky Buchanan-Wollaston and Dr Sascha Ott for their continual advice, guidance, support and motivation from the beginning until the end of the project. I would also like to express my appreciation to Dr Katherine Denby, Prof. Jim Beynon and all members of the PRESTA group for their advice and support. In addition, special thanks must go to Dr Claire Hill for being a constant source of help and guidance throughout my time in the lab.
Declarations
Abstract
Plant adaptation to stress is dependent upon the initialisation of molecular signalling net-works that regulate the expression of stress-related genes. By examining high-resolution microarray datasets it has been possible to track gene expression changes over time dur-ing senescence and in response to infection by fungal pathogenBotrytis cineria in the model organism Arabidopsis thaliana. Dramatic variations in gene expression are ob-served at the onset of stress with different groups of genes showing different expression time-courses. This observation must, for a large part, be down to the action of different transcription factors (TFs) binding to thecis-regulatory DNA in the promoters of genes in each group and it is this regulatory code that underpins the gene regulatory networks that regulate stress responses. This thesis presents an interdisciplinary investigation of the regulatory codes that are responsible for controlling plant stress responses.
Computational analysis of non-coding sequences provides a powerful approach to identify patterns within DNA that may function to regulate gene expression. This thesis covers the development of Analysis of Plant Promoter-Linked Elements (APPLES), an object-orientated software framework for the analysis of non-coding DNA. Within this environment, methods were developed to probe the regulatory codes that exist within these non-coding sequences and identify regulatory motifs that may function to regulate stress responses in Arabidopsis. APPLES methods were used to identify a novel motif that is likely to play a role in regulating drought responses in Arabidopsis, with exper-imental approaches providing support for this view. Using known motifs that describe previously characterised TF binding sites, it was possible to identify motifs that are associated with clusters of co-regulated genes identified from the senescence and Botry-tis microarray time-course datasets. This analysis revealedcis-regulatory elements that may contribute to generating the observed expression patterns.
Abbreviations
35S Cauliflower mosaic virus promoter
ABA Abscisic acid
ABRE Abscisic acid response element
AD GAL4 activation domain
APPLES Analysis of Plant Promoter-Linked Elements
bHLH Basic helix-loop-helix
bp Base pair
bZIP Basic leucine-zipper protein
CATMA Complete Arabidopsis Transcriptome Micro Array
cDNA Complementary DNA
ChIP Chromatin immunoprecipitation
CO2 Carbon dioxide
Col-0 Columbia 0
Col-4 Columbia 4
DAS Days after sowing
dATP deoxyadenosine triphosphate
dGTP deoxyguanosine triphosphate
dTTP deoxythymidine triphosphate
DNA Deoxyribonucleic acid
DNase Deoxyribonuclease
E. coli Escherichia coli
ERF Ethylene response factor
EtOH Ethanol
g Gram
g Centrifugal force
GAL4 Yeast transcriptional activator
GO Gene Ontology
GRN Gene regulatory network
h Hour
H2O Water
His Histidine
HIS3 Yeast histidine biosynthesis gene
HSE Heat shock element
JA Jasmonic acid
JAZ Jasmonate ZIM domain
kb Kilobase
L Litre
Leu Leucine
LOWESS Locally weighted sum of squares
µg Microgram
µM Micromolar
MEME Multiple EM for motif elicitation
miRNA Micro RNA
ml Millilitre
mm Millimetre
mM Millimolar
min Minute
M Molar
OO Object-orientated
OOP Object-orientated programming
ORF Open reading frame
PCR Polymerase chain reaction
PEG Polyethylene glycol
PRESTA Plant Response to Environmental STress in Arabidopsis
PSSM Position specific scoring matrix
RNA Ribonucleic acid
RNAi Ribonucleic acid interference
mRNA Messenger ribonucleic acid
ROS Reactive oxygen species
RPM Revolutions per minute
qRT-PCR Quantitative reverse transcriptase polymerase chain reaction
SA Salicylic acid
SAG Senescence associated gene
SD Synthetic Defined
sec Seconds
SOC Super Optimal broth with Catabolite repression media
T-DNA Transfer DNA
TF Transcription factor
Trp Tryptophan
UTR Untranslated region
UV Ultra Violet
VBSSM Variational Bayesian State Space Modelling
W Watts
WM Weight matrix
WT Wild-type
Y1H Yeast-1-Hybrid
Chapter 1
Introduction
1.1
Plant stress and food security
Food insecurity and the threat of famine have historically always been at the forefront of issues affecting mankind. Today, the precarious nature of food supply is threatened by an ever-expanding population, which is expected to increase a further 50% by the year 2050. Environmental stress is a particular problem and is already responsible for reduced crop yields worldwide. Alongside this, the effects of climate change have al-ready been noted, with more variable conditions likely to lead to increased exposure to environmental stress. An increase in global temperatures will lead to drought and the expected increase in humidity is likely to increase plant susceptibility to pathogens, which is already a major source of crop spoilage throughout the world. These factors are conspiring to greatly endanger food security, leading to social instability and in-creased poverty, particularly in developing countries. Clearly, however, this is not just a problem for the developing world, but is a global problem affecting the entire population.
1.2
Regulation of gene expression
1.2.1 The multiple levels of gene regulation
The genomes of higher eukaryotes typically contain tens of thousands of genes, which en-code the proteins and RNAs that perform all of the structural and biochemical functions within a cell. The expression of these genes must be controlled to ensure the relevant gene products are produced at the appropriate time and place within an organism. The intricate regulation of gene expression generates complex expression patterns that ensure proper development and responses to internal and external stimuli.
Regulation of gene expression is complex and can occur at multiple levels (Figure 1.1). Within the nucleus, DNA wraps around histone proteins, which themselves assemble into higher-order structures known as nucleosomes. This tightly coiled DNA-protein complex- chromatin allows the entire genome to be compacted within a single nucleus and provides the highest level of gene regulation (reviewed in Pfluger and Wagner 2007). Chromatin controls gene usage by impeding the access of TFs and RNA polymerase to the DNA. To allow transcription to proceed, the condensed chromatin must open up, allowing the DNA to interact with all the relevant factors needed to initiate transcrip-tion. Manipulation of chromatin states requires the function of chromatin re-modelling factors, which typically function by chemically-modifying histone proteins. These mod-ifications, such as acetylation and methylation, interfere with positive-charged histones, which disrupt the interaction with negatively charged DNA and therefore leads to more open and accessible DNA.
When free of the restrictions imposed by nucleosomes, gene expression is then regu-lated at the transcriptional level by regulatory proteins that bind to sites on the open, transcriptionally active DNA and act to increase or decrease the rate of mRNA produc-tion (see below).
Chromatin condensation/decondensation!
Histone modification: methylation, acetylation!
Transcription factors (TFs)!
Transcriptional co-activators!
Alternative splicing!
mRNA degradation: miRNAs!
Protein folding!
Protein modification!
Protein localisation!
1. DNA level
!
2. Transcriptional level
!
3. Post-transcriptional level
!
[image:20.595.140.466.100.336.2]4. Protein level
!
Figure 1.1: The multiple levels of gene regulation.
Following translation, the resulting peptide can be subject to extensive regulation that fine-tunes behaviour further. Interactions with other proteins can modify protein func-tion (Weltmeieret al., 2006; Djamei et al., 2007). Chemical modification such as phos-phorylation can induce conformational changes which alter functionality or result in protein re-localisation (Maoet al., 2011). Phosphorylation can also increase protein sta-bility (Lopez-Molinaet al., 2001), while ubiquitination targets a protein for degradation (Hardtkeet al., 2000).
1.2.2 Regulation of transcription
TFs preferentially interact with specific patterns of nucleotides known as motifs. These motifs are typically short (5-15 bp long) and can consist of any pattern of the four nucleotides, often containing degenerate positions (Harbison et al., 2004). TFs con-tact positions within the motif through specific DNA-binding domains, which interact with specific residues of closed-form DNA. Protein-DNA binding is due to non-covalent chemical interactions between the DNA-binding domain and chemical groups present on different nucleotides, and it is these specific properties of the nucleotide that are recognised by the TF. Because individual nucleotides share chemical properties, several nucleotides can be recognised by a DNA-binding domain, leading to degeneracy in the TF binding site. Moreover, not all of the positions within a motif explicitly interact with the TF, resulting in an additional source of degeneracy.
Motifs describe the binding specificities of a TF by summarising instances of TF binding sites. By observing the sequences with which a TF can interact, a more detailed descrip-tion of the TF binding specificity can be made. This informadescrip-tion can be summarised by storing it as a matrix, which describes how often each of the four nucleotides are observed at each position of the motif. These matrices are usually referred to as a position specific scoring matrix (PSSM) or a weight matrix (WM). The same information can then be described visually as a sequence logo, where the specificity of each position in the motif is measured in terms of information content (Schneider and Stephens, 1990). Approaches to modelling the binding specificity/motif for a given TF is shown in Figure 1.2.
1.2.3 Transcriptional regulatory networks
Site 1 GACACGTGTC
Site 2 TCCACGTGGA
Site 3 TACACGTGTA
Site 4 GCCACGTGGC
Site 5 GTGACGTCAC
Site 6 CTGACGTCAG
Site 7 ATGACGTCAT
Site 8 NNGACGTCNN
Site 9 NNCACGTGNN
Binding sites instances
1 2 3 4 5 6 7 8 9 10 A 1 2 0 9 0 0 0 0 3 2
C 1 2 5 0 9 0 0 4 0 3
G 3 0 4 0 0 9 0 5 2 1
T 2 3 0 0 0 0 9 0 2 1
Nucleotide counts at each position in binding site!
N H S A C G T S D N
1 2 3 4 5 6 7 8 9 10 A 0.15 0.28 0.02 0.92 0.02 0.02 0.02 0.02 0.40 0.28
C 0.15 0.28 0.52 0.02 0.92 0.02 0.02 0.42 0.03 0.40
G 0.40 0.03 0.42 0.02 0.02 0.92 0.02 0.52 0.28 0.15
T 0.28 0.40 0.02 0.02 0.02 0.02 0.92 0.02 0.28 0.15
(A)!
(B)!
(C)!
(D)!
Position Specific Scoring Matrix (PSSM)!
[image:22.595.186.438.93.462.2]Sequence logo!
Figure 1.2:Modelling TF binding sites. Building models of TF binding site sequence motifs.
(A) Defining the binding specificity of a TF requires the assembly of instances of TF binding. These sequences are aligned so that it is possible to observe the preferred nucleotides at each position in the motif. (B) A matrix is constructed containing the number of observed nucleotides at each position in the motif. (C) A PSSM/WM is generated using the matrix of observed nucleotide counts, by computing the ratio of the nucleotide count at a single position in the motif to the total number of nucleotides observed at that position. Pseudocounts are used to correct for small sample size (small number of binding site instances). (D) A motif can be visualised as a sequence logo, where the height of a base is proportional to its frequency at that position, while the height of the stack is proportional to the level of conservation at that position.
1.2.3.1 Methods for elucidating transcriptional networks
TFs that interact with a specific DNA sequence. By focusing on non-coding DNA such as promoter sequences it is possible to identify TFs that may directly regulate a gene. The two types of approach complement one another and as each has its own caveats, a combination of both is needed to comprehensively map transcriptional networks operat-ing duroperat-ing complex biological processes such as stress responses.
Chromatin immunoprecipitation (ChIP) based technologies are the most common and powerful TF-centred methods and have been used to identify hundreds of target genes for certain plant TFs (Morohashi et al., 2009). In this approach, the TF is chemically cross-linked to the DNA in vivo followed by immunoprecipitation of the TF together with the associated DNA fragment. The location of the resulting DNA fragments within the genome can then be identified using next generation sequencing (ChIP-SEQ) or mi-croarrays (ChIP-CHIP) (Kaufmannet al., 2010). The drawback of ChIP-based methods, however, is the reliance on antibodies to immunoprecipitate the TF of interest. Due to the high sequence similarity amongst many TF families, generation of a specific antibody is often difficult. Even if a suitable antibody is available, if the levels of TF within the sample are low, it may be difficult to isolate sufficient levels of chromatin.
Another approach that attempts to identify the genome wide binding profile of a TF is to first elucidate its binding specificity and then use this to scan the genome for pu-tative binding sites and target genes (Walhout, 2006). Many experimental techniques exist that can reveal TF binding specificity, such as bacterial-1-hybrid, protein-binding microarrays and SELEX (Noyeset al., 2008; Godoyet al., 2011; Oliphantet al., 1989). This interaction specificity can then be modelled as a PSSM and used to scan the genome for instances of the motif. Predictions of the genes targeted by the TF can be improved by scanning sequences that are likely have regulatory role, such as the core promoter of a gene.
1.3
Stress responses in Arabidopsis
Plants are constantly exposed to a plethora of biotic and abiotic stresses. Abiotic stresses include those that arise as a result of the plant’s environment, such as drought, cold, high salinity and heat. Biotic stresses, on the other hand, refer to living organisms such as bacteria, viruses, and fungi. In addition to environmental stress, developmental pro-cess such as senescence can also be a source of cellular stress. Such stresses pose a huge problem to plants and are the main source of reduced crop yields throughout the world. As sessile organisms, plants have been under constant evolutionary pressure to develop techniques that allow them to recognise and respond to particular stresses.
During the last decade, effort has focused on elucidating the genetic pathways responsible for stress perception, signal transduction and response in the model organism Arabidop-sis thaliana(Arabidopsis). Post genomic era technologies, such as microarrays provide a way to analyse how the transcriptome landscape changes in response to certain stresses. Various studies have used this approach to carry out genome-wide expression profiling under a range of stress conditions in Arabidopsis (Sekiet al., 2001; Kreps et al., 2002; Ma et al., 2006; Takahashi et al., 2004; Zeller et al., 2009; Breeze et al., 2011). These studies show substantial changes to gene expression with many genes showing strong upregulation or downregulation in response to each stress. These stress-responsive genes encode products that function to directly defend the organism from stress or those that contribute towards the regulation of the stress response. These regulatory genes can encode TFs or proteins that participate in the production of plant hormones, which play critical roles in stress-mediated signalling. These regulatory factors act together to fine-tune the expression of genes that trigger the molecular mechanisms that underpin the physiological and biochemical events that lead to stress tolerance.
1.3.1 The role of plant hormones in the stress response
1.3.1.1 Abscisic acid (ABA)
ABA is a key phytohormone that has long been implicated in signalling pathways that regulate response to abiotic and biotic stress. In addition to stress, ABA functions in regulating plant growth and development. ABA was orignally linked to the response to water deficit, which induces the expression of genes encoding ABA biosynthesis enzymes (Zeevaart and Creelman, 1988). Further studies expanded the role of ABA as a general regulator of osmotic stresses such as drought and salt stress (reviewed in Cutleret al. 2010). The subsequent accumulation of ABA causes stomatal closure and induces ex-pression of genes that encode proteins such as enzymes that synthesise osmolytes, water transporters and dehydrins that help to retain water and protect against cellular damage as well as other proteins involved in stress tolerance. ABA has also been implicated in the induction of senescence as demonstrated by the accumulation of ABA in senescing leaves (Breeze et al., 2011). In addition to this observation, exogenous application of ABA also induces premature senescence (Gepstein and Thimann, 1980). Expression pro-filing studies have demonstrated that many ABA inducible genes are upregulated during senescence, which may reflect the induction of abiotic stress signalling pathways during this stressful process (Buchanan-Wollastonet al., 2005; van der Graaffet al., 2006).
In addition to abiotic stresses, ABA also has an important role in biotic stress. While the effect of ABA signalling in response to abiotic stress is generally positive, the role of ABA as a regulator of biotic stress responses is more complicated with apparent positive and negative effects (reviewed in Asselberghet al. 2008). Whether ABA signalling has a positive or negative effect appears to vary according to the timing of infection (Ton et al., 2009). Initially ABA induced stomatal closure can help protect the leaf against
pathogen infection (Melotto et al., 2006), while accumulation of ABA during infection can interfere with other plant defence responses resulting in an increase in susceptibility (de Torres-Zabalaet al., 2007).
genes that play key roles in regulating responses to osmotic-related stresses.
In addition to ABRE motifs, many ABA-regulated genes contain binding sites for other TFs. For example, binding sites for MYC and MYB TFs, which bind MYC2 and MYB2 respectively, have been shown to have important roles in ABA mediated expression of stress related genes such asRD22 andADH1 (Abeet al., 2003). Another sequence motif that functions in ABA mediated expression is the dehydration response element (DRE) which has been shown to act synergistically with the ABRE to positively regulate ABA mediated expression in response to abiotic stress (Narusakaet al., 2003).
1.3.1.2 Jasmonic acid (JA)
JA functions as a signalling molecule with a prominent role in mediating responses to biotic stress. Along with ET, with which it acts synergistically, JA controls defence responses to necrotrophic pathogens. The JA signalling network is primarily controlled by a collection of jasmonate ZIM-domain (JAZ) proteins, which repress transcription of JA-inducible genes through direct interaction with JA associated TFs (Katsiret al., 2008). Biotic stress induces the accumulation of JA, which then induces COI1 to inter-act with JAZ repressors and mark them for degradation by ubiquitination (Chiniet al., 2007). This process relieves repression of key JA signalling TFs such as MYC2, ERF1 and ORA59, which can then induce expression of defence related genes (Pr´eet al., 2008). TFs that regulate JA mediated expression are represented by multiple different families and therefore interact with different motifs present within the promoters of JA regulated genes. MYC2 is a bHLH TF that binds to the G-box motif, which has the consensus CACGTG (Dombrechtet al., 2007). JA inducible TFs that are members of the ethylene response factor family, such as ERF1, ERF2, ERF4, ORA47 and ORA59 interact with the GCC-box, which has the consensus GCCGCC.
These JA inducible TFs regulate multiple classes of genes that encode proteins that func-tion in plant defence. Genome-wide expression profiling studies have revealed that JA induces expression of genes involved in production of stress-associated metabolites, such as glucosinolates, phenylpropanoids, and anthocyanins (Sasaki-Sekimoto et al., 2005; Pauwelset al., 2009). In addition to activating the expression of defence related genes, JA also plays a role in controlling cell growth and proliferation. This regulation is through the repression of cell cycle genes, suggesting that JA regulates the reallocation of energy from growth to defence (Pauwelset al., 2008).
1994; Lehmannet al., 1995). JA has also been shown to function in leaf senescence and levels of JA increase as the leaf senescences (Breeze et al., 2011). Expression studies also show that genes associated with senescence are upregulated by JA treatment (Jung et al., 2007). The role of JA in the senescence process may overlap with its apparent function during response to biotic stress; downregulation of genes involved in growth and photosynthesis and upregulation of stress related genes.
1.3.1.3 Ethylene (ET)
ET regulates multiple aspects of plant growth and development, and is a key signalling molecule in stress responses. In particular, ET is a prominent regulator of the defence response to necrotrophic pathogens. ET is perceived by membrane bound receptors such as ETR1, ETR2, and EIN4, which under non-stress conditions repress the activity of EIN2, a positive regulator of ET signalling, through the protein kinase CTR1 (Alonso et al., 1999). Receptor interaction with ET abolishes repression of EIN2 via CTR1, which
then goes on to positively regulate downstream ET signalling; EIN2 enhances the level of EIN3/EIL TFs, which in turn activate ERF family TFs such as ERF1 (Solanoet al., 1998). These TFs regulate the expression of genes that encode stress-related proteins. ERFs target the GCC-box (GCCGCC) present in the promoters of many stress-related genes (Okamuroet al., 1997). Even though they recognise the same core motif, flanking bases may discriminate binding between different members of the ERF family (Tournier et al., 2003). The importance of the ERFs in stress response signalling is noted in the
observation that mutants in several ERFs result in reduced resistance to biotic stress (O˜nate-S´anchez and Singh, 2002; Lorenzo et al., 2004). ET is known to play a key role in senescence as indicated byEIN2 mutants showing delayed senescence (Ohet al., 1997). ET biosynthetic genes are upregulated during leaf senescence and the hormone is a major positive regulator of leaf senescence with levels of the hormone increasing during the senescence process (van der Graaffet al., 2006).
1.3.1.4 Salicylic acid (SA)
SA signalling pathway also has a role in regulating gene expression during senescence (Morris et al., 2000). Mutant Arabidopsis plants that are insensitive to SA display delayed developmental senescence, as highlighted by reduced chlorophyll degradation (Morriset al., 2000).
1.3.1.5 Hormone crosstalk
Plants are not often exposed to a single stress, nor do they experience these as a linear sequence of events. In rapidly changing environments, plants must be able to adapt by constantly fluctuating the expression of different sets of genes. Crosstalk between hormone pathways is a phenomenon that provides a mechanism to balance responses to multiple stresses, which in turn improves the organism’s viability (reviewed in Pieterse et al.2009). The interactions between different hormone signalling pathways is complex with many synergistic and antagonistic interactions occurring under different contexts.
One of the best characterised examples of antagonistic crosstalk is between two biotrophic pathogen hormones, JA and SA. Biotrophic pathogens that trigger SA signalling in Ara-bidopsis strongly suppresses induction of JA-regulated genes activated by necrotrophic fungi (Spoelet al., 2007). This antagonistic regulation is largely mediated by TFs that exist in the individual signalling cascades of each hormone. In the SA signalling pathway, TGA and WRKY TFs will repress the expression of JA inducible genes (Ndamukong et al., 2007; Liet al., 2004), while in the JA pathway, MYC2 can repress genes positively
regulated by SA (Laurie-Berryet al., 2006).
In contrast to JA-SA pathways, the JA-ET pathways are largely synergistic in terms of gene regulation with large overlap in the genes differentially expressed by JA and ET treatment (Schenket al., 2000). The Arabidopsis TFs, ERF1 and ORA59 are both key regulators of JA and ET mediated expression, indicating that they are convergence points for both pathways (Pr´e et al., 2008; Lorenzoet al., 2003). The ET and SA path-ways are another example of a synergistic relationship, with ET playing an important role inducing SA defence responses and enhancing positively regulated genes.
1.3.2 Transcriptional control of stress-associated gene expression.
Stress signalling pathways are ultimately localised to the nucleus where TFs regulate the transcription of stress-responsive genes. Initial studies predicted that approximately 1500 TFs are encoded in the Arabidopsis genome (Riechmannet al., 2000). Subsequent analysis within our lab group has shown that the genome actually contains well over 2000 TFs (data not shown). These TFs fall into clearly defined families with particular members and the cis-regulatory elements with which they interact being linked with regulating the stress response. As described above, many TFs function within hormone signalling pathways where they function to directly regulate transcription.
Several different transcriptional regulatory systems are involved in stress-responsive gene induction, with some regulatory factors appearing to function in response to multiple conditions. Numerous studies have investigated gene expression overlap in response to different stress conditions and results demonstrate that some genes are induced by mul-tiple stresses. This indicates that plant stress responses are mediated by overlapping pathways.
Early experiments that probed this potential cross-talk between stress-signalling path-ways used microarrays to identify genes induced by ABA and other abiotic stresses such as drought, cold and osmotic stress (Sekiet al., 2002; Kreps et al., 2002). These studies identified genes that were differentially expressed under several conditions, indicating that common sets of TFs may be functioning to regulate responses to multiple different forms of stress.
Later, the AtGenExpress project produced high-quality transcriptome data using Affymetrix ATH1 microarrays to analyse global transcriptional responses of the 24,000 genes repre-sented on the array to many different abiotic and biotic stresses in Arabidopsis genotype Col-0. Abiotic treatments included cold, osmotic stress, salt, drought, genotoxic stress, ultraviolet light, oxidative stress, and wounding (Kilian et al., 2007). Biotic stresses included infection with variety of pathogens such as virulent and avirulentP. syringae, P. infestansand pathogen related compounds such as bacterial elicitor flg22. Data were also collected for Arabidopsis treated with stress related hormones such ABA, JA, and SA (Goda et al., 2008). Overall, the AtGenExpress datasets provide the most compre-hensive analysis of the transcriptional changes that occur when plants are exposed to stress. All data are in the public domain and there have been a number of studies into overlapping transcriptional responses to stress using the data.
stress in Arabidopsis and identified a strong cross-talk between stress-signalling path-ways. Of 680 genes induced by high-salinity, 75% were also induced by biotic, osmotic, cold, ABA and JA, with the remaining 25% being salt-stress specific (Maet al., 2006). In a study by Swindell (2006) analysis of microarray data from the AtGenExpress project focusing on transcriptional responses to multiple abiotic stress identified extensive over-lap in expression patterns and provided further evidence that there are many TFs that are functioning to regulate the responses to several different types of stress.
1.3.2.1 The NAC transcription factor family
The NAC family of TFs were initially described more than a decade ago. The first NAC genes described were NAM (NO APICAL MERISTEM) and CUC2 (CUP-SHAPED COTYLEDON), which were identified in mutant screens for defective shoot apical meris-tem (SAM) development in Petunia and Arabidopsis respectively (Souer et al., 1996; Aidaet al., 1997). Sequence analysis identified two Arabidopsis clones,ARABIDOPSIS TRANSCRIPTION ACTIVATION FACTOR 1/2 (ATAF1/2) that were homologous to the region encoding the N-terminal part of the CUC2 protein (Aida et al., 1997). The conserved N-terminal domain was named the NAC domain (for Petunia NAM and Arabidopsis ATAFI, ATAF2, and CUC2). Sequence analysis has revealed that there are at least 105 putative NAC TFs present in the Arabidopsis genome (Ookaet al., 2003), together with several hundred found in the genomes of rice, soybean and tobacco (Fang et al., 2008; Mochida et al., 2009; Rushton et al., 2008). While the NAC TF family is
broadly dispersed in plants, no orthologs have been identified in other eukaryotes (Aida et al., 1997).
Structurally, NAC proteins consist of two domains that exert their functionality. The highly conserved N-terminal domain contains the DNA binding ability, while the C-terminal region serves as the activation domain. The N-C-terminal NAC domain is ap-proximately 150 amino acids in length and is made up of five subdomains (Ooka et al., 2003). The X-ray crystallographic structure of the NAC domain of ANAC019 reveals that the binding motif does not conform to any known binding domains (Ernst et al., 2004). The NAC domain adopts a twisted anti-parallel beta-sheet surrounded by two he-lices. The C-terminal domains of NAC TFs display significant variability amongst family members and have been characterised as having transcriptional activator or repressor functionality (Fujita et al., 2004; Hu et al., 2006; Tran et al., 2004). The C-terminal domain has also been reported to possess protein-binding ability (Kimet al., 2007).
bind within a 63 bp fragment of the ERD1 promoter using a Y1H system (Tranet al., 2004). Gel retardation assays were used to confirm that ANAC019 and ANAC055 could specifically bind to the 63 bp fragment. ANAC019 and ANAC055 trans-activated the ERD1 promoter demonstrating that they are functional transcriptional activators. The 63 bp promoter was mutated in order to identify a more well defined NAC recognition sequence, and identified CACG as the core NAC TF binding motif (Tran et al., 2004). This limited understanding of the core NAC binding motif was expanded in a study by Olsenet al.(2005) that elucidated a detailed description of the NAC binding specificity. Using the SELEX approach, the authors found that ANAC019 bound to the consensus TTNCGTA while ANAC092 bound to TTGCGTGT. While not completely identical, they do share a core, CGT[GA], which is the reverse complement of the CACG mo-tif core idenmo-tified for ANAC019, ANAC055 and ANAC072 in the study by Tranet al. (2004). Other studies have revealed different core binding site for a Calmodulin-binding NAC TF, which bound to the core GCTT motif (Kimet al., 2007). This finding suggests that other members of the NAC TF family have different binding specificities.
The NAC TFs have been implicated in regulating a diverse set of biological processes. NAC TFs were originally identified in mutant screens for defects in SAM formation and cotyledon development (Soueret al., 1996; Aida et al., 1997), implicating NAC TFs in the regulation of SAM and organ development. Studies have also identified regulatory roles in terms of lateral root development, growth of leaf cells and secondary wall biosyn-thesis (Xieet al., 2000; Kato et al., 2010; Zhong et al., 2010).
In addition to developmental processes, NAC TFs have been heavily implicated in reg-ulating abiotic and biotic stress responses. The first NAC TF to be functionally linked to regulating stress responses was ANAC072 (also called RESPONSE TO DESICCA-TION 26; RD26), which was isolated from drought-stressed plants (Fujitaet al., 2004). ANAC072 expression was also found to be induced by ABA, while microarray analysis of leaves overexpressingANAC072 compared to wild-type identified an enrichment for ABA- and drought-associated genes.
to uncover another protein that bound to the ERD1 promoter adjacent to the NAC binding site (Tranet al., 2007). This DNA-binding protein, zinc finger homeodomain 1 (ZFHD1) bound to the motif AATTT, and was found to be induced by drought, high-salt and ABA (Tranet al., 2007). Yeast-2-hybrid analysis revealed ZFHD1 can interact with ANAC019, ANAC055 and ANAC072, while overexpression of both ZFHD1 and any of the three NAC TFs resulted in upregulation ofERD1 (Tranet al., 2007). These results suggest that combinatorial motifs within theERD1 promoter are responsible for driving gene expression.
In addition to regulating responses to abiotic stress, ANAC019 and ANAC055 have also been identified as key regulators of responses to biotic stress (Buet al., 2008). More specifically, ANAC019 and ANAC055 were shown to be responsible for regulating the JA-induced expression of defence genes. Expression of genes that are normally highly induced by JA were greatly reduced in ananac019anac055 double mutant. Transgenic plants overexpressingANAC019 or ANAC055, however, showed enhanced JA-induced expression. Double mutants also displayed increased resistance to the necrotrophic fun-gus Botrytis (Buet al., 2008).
ANAC002/ATAF1 expression was strongly enhanced under drought conditions and by ABA (Lu et al., 2007). Arabidopsis ANAC002 knockout plants displayed improved drought tolerance suggesting an important role in regulating responses to water deficit. ANAC002 has also been implicated as a regulator of defence responses against necrotrophic fungal and bacterial pathogens (Wang et al., 2009). In another study, work with ABA insensitive mutants foundANAC002 expression to be induced in an ABA-independent manner, whileANAC002 mutants further implicated the TF as a regulator of responses to necrotrophic pathogens such as Botrytis (Wuet al., 2009).
ANAC092 has been implicated in the salt-stress response (Heet al., 2005). Microarray analysis of genes induced by salt stress, identifiedANAC092 as being strongly upregu-lated. Balazadehet al.(2010b) used an inducible line to identify immediate downstream targets of ANAC092, and these were heavily enriched for known senescence associated genes. A study by Woo et al. (2004) examined the response to oxidative stress in an ANAC092 mutant, by treating plants with chemicals known to induce oxidative stress. The ANAC092 loss of function mutant showed enhanced resistance to oxidative stress. These observations may indicate that ANAC092 participates in regulating a general ox-idative stress resistance mechanism.
and senescence in Arabidopsis was revealed in a study by Kimet al.(2009). Expression of ANAC092 is induced by EIN2, a positive regulator of the ET signalling cascade. In young leaves,ANAC092 expression was found to be negatively regulated by the miRNA, miR164. As the leaf ages, miRNA164 is negatively regulated in anEIN2 dependent man-ner, which then allows ANAC092 levels to increase and in turn initiate senescence and cell death (Kimet al., 2009).
Other members of the NAC family that have been shown to regulate stress-related processes includeANAC029,ANAC059 andANAC078. ANAC029 and ANAC059 posi-tively regulate senescence (Guo and Gan, 2006; Balazadehet al., 2011), while ANAC078 regulates high-light induced flavonoid biosynthesis (Morishitaet al., 2009).
1.4
Leaf senescence
1.4.1 Senescence and the link to stress
A key developmental process that is linked to plant stress responses is senescence. Leaf senescence symbolises the final phase of leaf development and involves the co-ordinated degeneration and redistribution of the organs cellular components (reviewed in Buchanan-Wollaston 1997). Senescence is associated with large-scale physiological and biochemical changes, including the degradation of chlorophyll, proteins, lipids and nucleic acids. Chlorophyll is degraded together with chloroplast associated proteins such as Rubisco, eventually leading to the destruction of the entire chloroplast. Targeted use of proteases and lipases result in the gradual degradation of the leaf protein content and cell walls respectively. At the later stages of senescence the nucleus, together with the nucleic acids contained within it, are also degraded. This widespread degradation and subsequent remobilisation of molecules generates increased levels of reactive oxy-gen species (ROS), a major source of cellular damage. Oxidative stress induces stress response pathways (Neill et al., 2002), and protecting cells against the effects of oxida-tive stress is an important aspect of the senescence process (Buchanan-Wollastonet al., 2005). Mutants that display delayed senescence have been found to be more tolerant to oxidative stress (Wooet al., 2004).
2005; Breeze et al., 2011; van der Graaff et al., 2006; Morris et al., 2000). Consistent with this link, genes differentially expressed in response to abiotic and biotic stress over-lap with those differentially expressed during senescence (Weaveret al., 1998; Quirino et al., 1999; Pontier et al., 1999). Overlapping expression patterns highlight genes that function during multiple stress-related processes. Amongst the genes induced by stress and senescence are sets of TFs, indicating shared regulatory components operate in these processes.
1.4.2 Transcriptional control of leaf senescence
The model plant Arabidopsis has been used to study transcriptional regulation of senes-cence and has led to the identification of many TFs that are enhanced or repressed dur-ing this process. Microarray time-course experiments have revealed dramatic changes in gene expression at the onset of senescence, which continue to change until the leaf is fully senescent, with different sets of genes showing different expression time-courses (Buchanan-Wollastonet al., 2005; Breezeet al., 2011). Among the senescence enhanced genes, are hundreds of TFs from many different families. Of these TFs, however, only a minor fraction has been functionally associated with senescence.
Several members of the WRKY TF family, which generally bind to the w-box motif (TTGAC[G/T]), have been shown to play prominent roles in controlling leaf senescence in Arabidopsis. WRKY53 has been shown to be important for the progression of senes-cence, withWRKY53 knockout andWRKY53 overexpressor mutants exhibiting delayed and premature senescence respectively (Miaoet al., 2004). Plant defence-linked WRKY6 has been shown to positively regulate SIRK, a receptor-like kinase that is specifically enhanced during senescence (Robatzek and Somssich, 2002). WRKY70 has been impli-cated as a negative regulator of senescence with knockout mutants displaying premature senescence (Ulkeret al., 2007).
RELATED TO ABI3/VP1 (RAV1), a member of the RAV TF family, was also shown to regulate senescence in a positive manner (Wooet al., 2010). Constitutive and inducible overexpression ofRAV1 produced an early senescence phenotype.
The NAC domain TF family is emerging as key regulators of senescence and stress responses in general, with a large proportion of this family displaying enhanced expres-sion during senescence (Breezeet al., 2011). In Arabidopsis, three NAC family members, ANAC029, ANAC059 and ANAC092, have been shown to have a regulatory function in senescence. ANAC029 knockout and overexpression mutants exhibited delayed and pre-mature senescence respectively (Guo and Gan, 2006). ANAC092, as has been described previously, functions in a regulatory network with EIN2 and miRNA164 to ensure that senescence occurs at the correct time in development (Kimet al., 2009), whileANAC059 has recently been shown to play an important role in regulating senescence (Balazadeh et al., 2011).
1.5
Infection by
Botrytis cinerea
1.5.1 The plant response to Botrytis infection
The necrotrophic fungal pathogenBotrytis cinerea (Botrytis) is a major source of crop spoilage worldwide. This is particularly prevalent in regions with humid climates. As a necrotrophic pathogen, Botrytis aims to kill host cells quickly as to obtain nutrients from the host. Botrytis is equipped with an arsenal of infection mechanisms including a variety of cell wall-degrading enzymes and toxins (reviewed in Glazebrook 2005). These pathogen-produced toxins are thought to promote host cell death by increasing cellular levels of ROS and play a major role in pathogen infection.
1.5.2 Transcriptional responses to Botrytis infection
The expression of defence genes is tightly controlled at the transcriptional level and many TFs, often acting through specific hormone signalling cascades, have been shown to play critical roles in regulating these defence responses. As mentioned previously, JA and ET signalling is key to induction of resistance mechanisms to necrotrophic pathogens. Mu-tations that attenuate the JA or ET signalling cascades result in increased susceptibility to Botrytis (Thomma et al., 1998, 1999). MYC2, which is a central integrator of JA and ET signalling has been shown to play an important role in regulating host defence responses. Interestingly, MYC2 appears to regulate sets of genes that lead to enhanced resistance and genes that result in enhanced susceptibility (Glazebrook, 2005). Ara-bidopsis plants that overexpressORA59 display enhanced resistance to Botrytis, while ORA59-silenced plants are more susceptible (Pr´eet al., 2008). In the same study, ERF1 was also shown to positively regulatePDF1.2, although levels of this key defence gene were significantly lower inORA59-silenced plants, indicating the importance of ORA59 for regulating the JA-mediated expression of defence genes. Taken together, ORA59 andERF1 act to integrate JA and ET signals during the response to Botrytis.
The NAC TFs ANAC019 and ANAC055 act redundantly to regulate JA mediated expression during Botrytis infection. Phenotyping analysis revealed anac019anac055 mutants to be more resistant to Botrytis, while single knockout mutants are unaltered compared to wild type (Buet al., 2008). The increased resistance phenotype is similar to that observed inmyc2 Arabidopsis plants, while overexpression ofANAC019 inmyc2 background rescues the miss-regulation of JA-regulated genes. These findings suggest that ANAC019 and ANAC055 function downstream of MYC2 in JA-signalling in re-sponse to Botrytis infection.
Members of the WRKY TF family play important roles in regulating defence responses to multiple different pathogens, including Botrytis (Rushtonet al., 2010). WRKY33 has emerged as having a particularly prominent role in regulating the response to Botrytis withwrky33 mutants displaying increased susceptibility to the pathogen (Zhenget al., 2006). The regulatory role of WRKY33 was revealed in a recent study, where it was shown to act a positive regulator of camalexin biosynthesis (Maoet al., 2011). Another family member, WRKY70 has been also been linked with positively regulating responses to Botrytis infection (AbuQamar et al., 2006), while WRKY50 and WRKY51 have demonstrated that they negatively regulate defence against Botrytis, possibly through the SA pathway (Gaoet al., 2011).
MYB46, which is involved in regulating secondary wall biosynthesis, has recently been identified as a prominent mediator of pathogen responses (Ram´ırez et al., 2011). Ara-bidopsis myb46 lines display enhanced resistance to Botrytis, which is predicted to be through the observed misregulation cell wall proteins and enzymes (Ram´ırezet al., 2011). MYB108 is another TF that has been implicated in regulating responses to Botrytis. MYB108 was originally isolated from Arabidopsis the BOS1 (BOTRYTIS- SUSCEPTI-BLE1) gene following a T-DNA insertion mutant screen for altered Botrytis susceptibil-ity. The T-DNA insertion was found to be at theMYB108 locus. Thebos1 lines were shown to have increased susceptibility to Botrytis infection. Botrytis-induced expression ofBOS1 was reduced in Arabidopsis mutants that have impaired JA-signalling, indicat-ing thatBOS1 is part of the JA cascade in response to biotic stress. Interestingly, the bos1 plants produce increased amounts of full length MYB108 transcript compared to wild-type (Mandaokar and Browse, 2009). In a recent thesis (Windram, 2010), different MYB108 knockout lines were generated and assessed for altered Botrytis susceptibility. Two independent lines demonstrated increased resistance to Botrytis. Given the oppo-site phenotypes, this finding suggests that the T-DNA insertion present in bos1 lines, which is present in the upstream non-coding sequence, has a positive effect onMYB108 expression.
1.6
The PRESTA project
Plant Responses to Environmental STress in Arabidopsis (PRESTA) is a systems biology project spanning multiple lab groups at the Universities of Warwick, Essex and Exeter, that aims to elucidate transcriptional networks that regulate responses to developmen-tal, abiotic and biotic stress. The systems approach is centred around the generation of large microarray datasets that follow gene expression changes over time in response to multiple stresses, including senescence and Botrytis.
For the senescence time-course, Arabidopsis thaliana plants were grown under 12 h day/12 h night conditions. Leaf 7 was tagged on emergence and biological replicates were harvested both morning and evening (7 h and 14 h into light period) every other day from 19 days after sowing (DAS) until 39 DAS. This resulted in a time-course con-sisting of 22 time point samples from before full expansion to fully senescent. Combining the morning and evening samples for a single day gave another version of the senescence time-course, which had 11 timepoints in total. This experiment was covered in a recent publication by Breezeet al. (2011).
thaliana plants and placed on a tray. Leaves were inoculated with 10µl droplets of a suspension ofBotrytis cinerea spores at a concentration 100,000 spores per ml in grape juice. Droplets of grape juice alone were put on mock inoculated leaves. Leaves were harvested from plates every 2 h after infection up to 48 h post infection. This resulting time-course consisted of 24 timepoints comparing transcriptional differences between in-fected and mock inin-fected leaves. The publication that details the Botrytis experiment is currently being prepared (Windramet al., in preparation).
Both senescence and Botrytis time-course experiments were performed using Complete Arabidopsis Transcriptome Micro Array (CATMA) arrays (Sclep et al., 2007). In con-trast to Affymetrix arrays, which are single channel arrays, CATMA arrays are two-channel (or two-colour), and require the hybridisation of cDNA from two samples that are alternately labelled with the fluorescent dyes Cy3 and Cy5. The CATMAv3 ar-rays used in these studies contain probes that map to approximately 24,000 Arabidopsis coding sequences. This excellent gene coverage combined with the affordability of man-ufacturing the arrays made them an logical choice for such a large scale experiment.
These high-resolution datasets can be used to elucidate transcriptional networks using a variety of theoretical and experimental approaches. Network inference is a theoretical modelling approach that uses expression profiles to predict regulatory relationships be-tween genes. The high-resolution nature of the time-course is more suited to inference methods than previous transcriptional profiling experiments consisting of fewer time-points (Breeze et al., 2011). Network inference methods such as VBSSM (Beal et al., 2005) have been used to reconstruct transcriptional networks using expression data from the senescence and Botrytis time-courses.
A key part of elucidating transcriptional networks is the identification of TFs that bind to the promoters of differentially expressed genes, including other TFs. The PRESTA project has developed a Y1H system that uses a TF library consisting of approximately 1400 Arabidopsis TFs. Using the promoters of genes that are differentially expressed in the PRESTA time-course datasets, it is possible to use Y1H to build models of regula-tory networks around these genes. Protein-DNA interactions can also be used as priors for future rounds of network inference.
1.7
Organisation of this thesis
Chapter 2
Materials and Methods
2.1
Plant material
The myb2 (SALK 045455) and myb108 (SALK 076395) mutants of Arabidopsis Col-0 were obtained from T-DNA insertion lines from the Salk Institute Genomic Analysis Laboratory (http://signal.salk.edu/). The SALK 076395 line was heterozygous and was selfed to generate homozygous lines by Oliver Windram at The University of Warwick. TheMYB108Ox line is the bos1 mutant (Mengisteet al., 2003).
2.2
Plant and fungal growth
2.2.1 Plant growth
Arabidopsis seeds were stratified in 0.1% w/v agarose at 4◦C for 72 h in complete darkness. Stratified seeds were sown in pre-watered Arabidopsis soil mix (6:1:1 ratio of Levington F2 compost:sand:vermiculite) in 4-cm pots (P24, Plant-pak). Pots were covered with cling film and placed in a growth chamber to germinate. The covering was removed 7 days post sowing and seedling thinned out to give one plant per pot. Plants were grown in standardised conditions under 16 h days at 20◦C, 350 ppm CO2
concentration and 120µmol.m2.s−1 light.
2.2.2 Botrytis growth
suspending spores in half strength sterile grape juice (Tesco) and concentration adjusted to 1×10⁵ spores/ml. Spore concentration was measured with a hemocytometer.
2.2.3 Botrytis infected-leaf expression analysis
For Botrytis infection expression analysis, leaf 7 was tagged on emergence. Leaf 7 from 4-week old plants was detached and placed on 1% w/v agar in propagator trays. Col-0, myb2 and myb108 leaves were inoculated with 4-6 (depending on leaf size) evenly spaced 10µl droplets of Botrytis spores at the above concentration. An identical number of leaves from each line were mock inoculated with half-strength sterile grape juice (Tesco). Propagator lids were placed on trays and grown under 16 h days at 20◦C, 350 ppm CO2 concentration and 120 µmol.m2.s−1 light and 90% humidity. Infected leaves
from mutants and Col-0 were harvested at the same time post infection to provide 4 biological replicates. Samples for the comparison between MYB108 mutant lines (myb108 knockout andMYB108Ox) and Col-0 were harvested at 26 hours post infection (hpi) and 30 hpi to give two timepoints. Samples for the comparison between myb2 knockout line and Col-0 were harvested at 24 hpi and 30 hpi to give two timepoints. Whole leaf samples were snap frozen in liquid nitrogen at the time of harvesting and stored at -80◦C.
2.2.4 Dark-induced senescence expression analysis
the average ratio of Col-0 samples was>0.8, leaf 5 from different Petri dishes for Col-0, myb2 and myb108 lines were harvested at the same time to give a total of 4 biological replicates for each line. Whole leaf samples were snap frozen in liquid nitrogen at the time of harvesting and stored at -80◦C. The same sampling procedure was then performed on consecutive days to sample as senescence progresses.
2.3
Microarray analysis
2.3.1 RNA extraction
Snap-frozen Arabidopsis leaves were ground in 1ml Trizol reagent (Invitrogen) using a Dremel drill for 1 min until the sample was completely homogenised. The drill-bit was frozen in liquid nitrogen prior to use to prevent thawing of leaf tissue. Samples were incubated at room temperature for 5 min to allow for dissociation of nucleoprotein complex before adding 200µl chloroform. Reaction was shaken vigorously by hand for 15 sec and incubated for 3 min at room temperature. Samples were then centrifuged at 8,000 ×gfor 15 min at 4◦C. The upper aqueous phase (∼0.5ml) was transferred to a fresh 1.5ml Eppendorf tube followed by addition of 0.5ml of isopropanol to precipitate the RNA. Samples were mixed by inverting tubes several times and incubated at -20◦C for 2 h. Samples were centrifuged at 8,000×gfor 20 min at 4◦C. RNA pellets were washed with 1ml 75% EtOH followed by centrifugation at 8,000×g for 10 min at 4◦C. Supernatant was completely removed and pellet allowed to air-dry for 5 min before re-suspension in 100µl RNase free water. Total RNA was purified using Qiagen RNeasy purification kit (Qiagen) according to the manufacturers protocol except for the last step, where purified RNA was eluted from the column with 2x40µl RNase free water. Total RNA concentration was measured using a Nanodrop ND-1000 spectrophotometer (Thermo Scientific) using 1µl sample. Total RNA quality was determined using a 2100 Bioanalyzer with the RNA 6000 Nano LabChip kit according to manufacturers instructions (Agilent). The Bioanalyzer assesses total RNA integrity by observing the 18S and 28S rRNA peaks using a high-resolution electrophoresis system. Where total RNA samples displayed no rRNA peaks or a poor 18S/28S ratio (ratio<1), total RNA was isolated from alternative single leaf samples.
2.3.2 RNA amplification
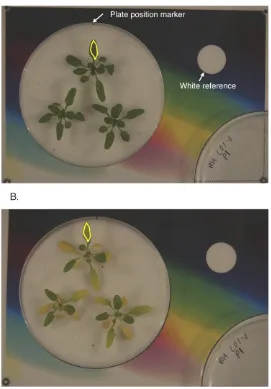
Figure 2.1: Quantification of dark-induced senescence in single leaves. (A) Petri dishes containing whole Arabidopsis rosettes were placed on a coloured background according to a set position marker. A camera was suspended above the background and the zoom adjusted until the corners of the background are just visible. The background contains a white reference point that serves to normalise RGB values of each leaf within a Petri dish. Photographs are imported into ImageJ where RGB values are computed for the area covering leaf 5 (yellow outline). Photographs of the same samples are taken every day until the onset of senescence. (B) The same plate as shown in (A) as it begins to visibly senesce.
concentration<300ng/µl, total RNA for that sample was re-amplified.
2.3.3 Microarray experimental design
For both the dark-induced senescence and Botrytis treatments, mutant samples (i.e., myb2,myb108 and MYB108Ox lines) were compared with Col-0 samples at each given timepoint. For each sample, amplified RNA from 4 biological replicates were pooled. Each comparison consists of 4 technical replicates including two dye-swaps.
2.3.4 Direct labelling of amplified RNA
Approximately 5µg of pooled amplified RNA, generated by combining equal amounts of amplified RNA from each of the appropriate biological replicates, was combined with 0.5µl random nonamers (3µg/ul) (Invitrogen), 0.5µl of RNase inhibitor (RNase OUT; Invitrogen) and made up to a final volume of 10.5µl. Samples were incubated at 70◦C in a thermocycler for 10 min. Superscript mastermix was created by combining the following reagents per reaction: 4µl 5×Superscript II First Strand Buffer (Invitrogen), 2µl 0.1M DTT (Invitrogen), 1µl dNTP mix (10mM dATP, 10mM dGTP, 10mM dTTP, 2mM dCTP) and 1µl SuperScript II reverse transcriptase (Invitrogen). Samples were labelled by adding 8µl of mastermix with 1.5µl of either Cy3- or Cy5-dCTP (GE Healthcare) followed by incubation in the dark at 42◦C for 2.5 h. 2µl of 2.5M NaOH was added to each of the labelled cDNA samples followed by incubation at 37◦C for 15 min. Samples were combined with 10µl of 2M MOPS buffer and purified using a QiaQuick PCR purification kit (Qiagen) according to manufacturers instructions. At the end of the procedure, the purified cDNA was eluted with 2× 30µl of Buffer EB (Qiagen). The concentration of the purified sample was measured at 532nm (Cy3) or 635nm (Cy5) using a Nanodrop ND-1000 spectrophotometer.
2.3.5 CATMA array hybridisation
CATMAv4 array slides were prepared for hybridisation by incubating them in Coplin jars with Pre-Hybridisation buffer (1.2g Bovine Serum Albumin (Sigma Aldrich, A9418), 5×SSC, 0.1% SDS in 120ml sterile H20) (pre-warmed to 42◦C at 42◦C) for 1 h. CATMA
arrays slides were washed by submergence into sterile H2O for a total of 5 washes and
a final wash with isopropanol. Slides were dried by centrifugation for 1 min at 2,000×
g. Combinations of 40pmol of the appropriate Cy3- and Cy5-labelled samples were freeze dried until nearly dry and resuspended in 50µl of hybridisation buffer (12.5µl For-mamide, 12.5µl 20×SSC, 0.35µl 14% SDS, 6.25µl 4µg/µl Yeast tRNA (Invitrogen) and 18.4µll sterile H2Oµl). Resuspended sample was then incubated at 95◦C for 5 min in a
was applied to an array slide located within a hybridisation chamber (Corning) followed by the application of a coverslip (Sigma Aldrich) and chamber cover. Hybridisation chambers were placed in a humid environment at 42◦C for 16 h.
Coverslips were removed by submerging array slides in 250ml Wash Solution 1 (2 × SSC, 0.07% SDS, 250ml H20) (preheated to 42 ◦C) until free. Hybridised slides were
then incubated in Wash Solution 1 in a hybridisation rack for 5 min on an orbital shaker. Slides were then incubated in 250ml Wash Solution 2 (0.1 × SSC, 0.07% SDS, 250ml H20) for 10 min on an orbital shaker. Slides were then incubated in Wash Solution 3
(0.1×SSC and 995ml H20) for 1 min on an orbital shaker for a total of 4 washes. Slides
were briefly immersed in isopropanol and dried by centrifugation for 1 min at 1,000 ×
g.
2.3.6 Microarray scanning
Arrays were scanned on a 428 Affymetrix scanner at wavelengths of 532nm and 635nm for the Cy3 and Cy5 labelled samples respectively. The gain was adjusted on a slide-to-slide basis in an attempt to give unsaturated foreground and minimal background fluorescence. Scanned images were quantified using Imagene 7.5.0 software (BioDiscovery, Inc.).
2.3.7 Expression analysis
Comparisons between mutant and wild-type samples were analysed using the R Biocon-ductor package limmaGUI (Wettenhall and Smyth, 2004). Raw data were normalised within arrays using a PrintTip lowess transformation and then normalised between ar-rays using the quantile-normalisation. The data were fitted to a linear model using a least squares method. P-values were adjusted for multiple testing using Benjamini and Hochberg method to control the false discovery rate (Benjamini and Hochberg, 1995).
2.3.8 Gene Ontology (GO) analysis
Overrepresentation within gene lists for Gene Ontology (GO) categories is analysed using BINGO (Maere et al., 2005). BINGO performs hypergeometric tests to determine if a particular GO term associated with a set of genes is expected by chance when considering the number of genes associated with that term in the whole Arabidopsis genome.
2.3.9 AtGenExpress Affymetrix microarray data